Bond Prices and Yields Bond Characteristics n Fixed

Bond Prices and Yields

Bond Characteristics n Fixed income security q q n n Face or par value Coupon rate q n An arragement between borrower and purchaser The issuer makes specified payments to the bond holder on specified dates Zero coupon bond Indenture q The contract between the issuer and the bondholder

Different Issuers of Bonds n U. S. Treasury q Notes and Bonds q Ranging from 10 to 30 years q In denominations $1. 000 or more q Minimum reduced in 2008 to $100 q Semiannual payments
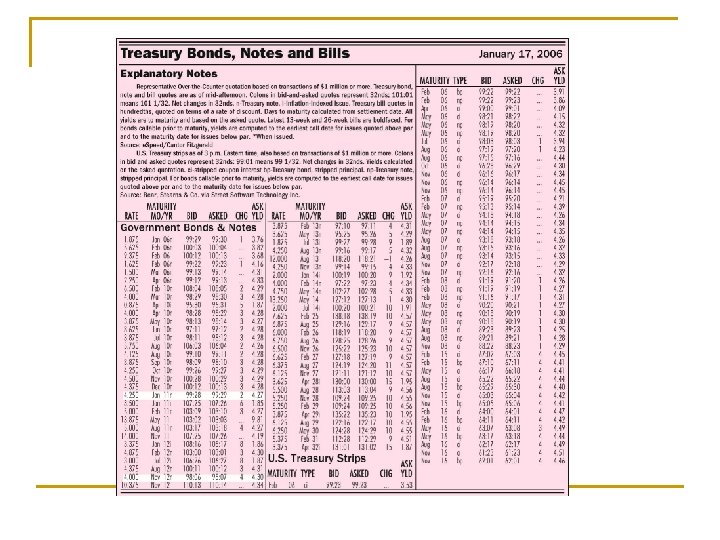

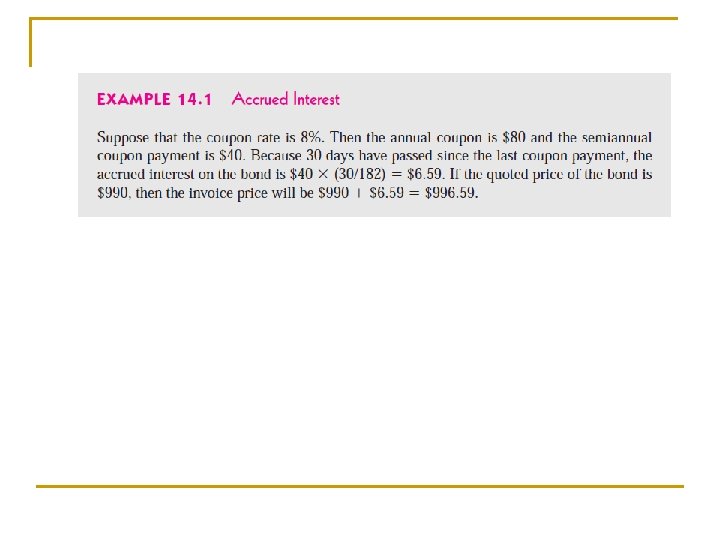
Accrued Interest and Quoted Bond Prices n n Quoted prices are not the prices that investor pay for the bond Quoted price does not include the interest that accrues between coupon payments dates

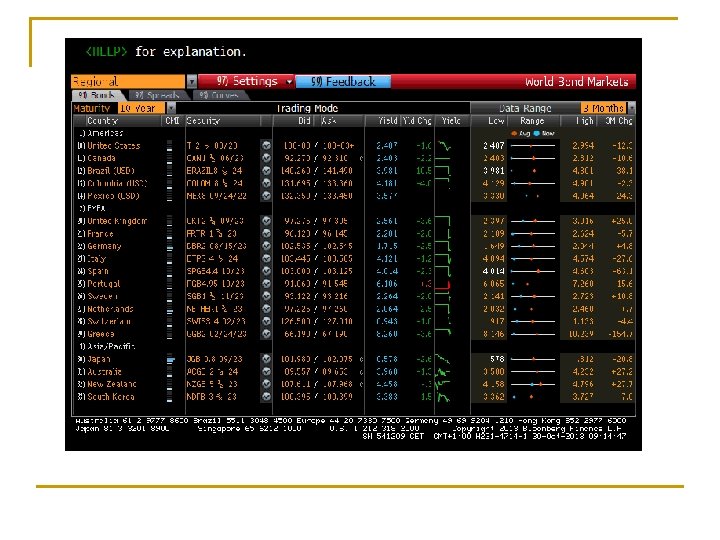
Commercial bonds n Corporations q n n Most of them traded in OTC markets by bond dealers Municipalities International Governments and Corporations Innovative Bonds q Floaters and Inverse Floaters q Asset-Backed q Catastrophe Indexed Bonds

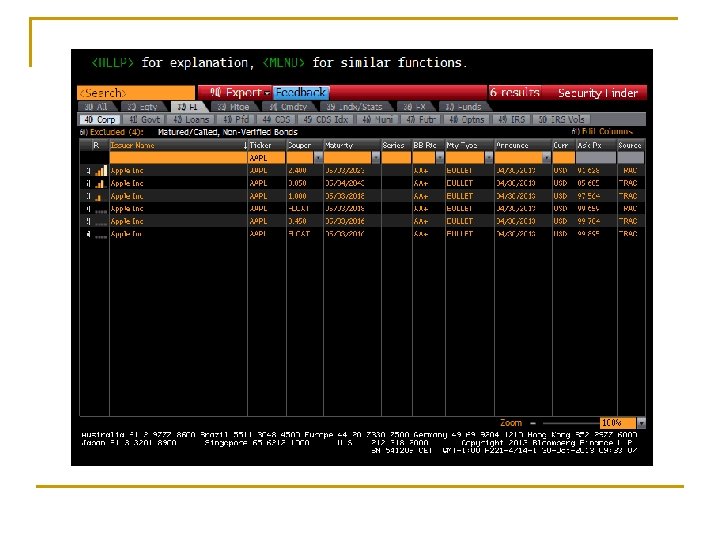
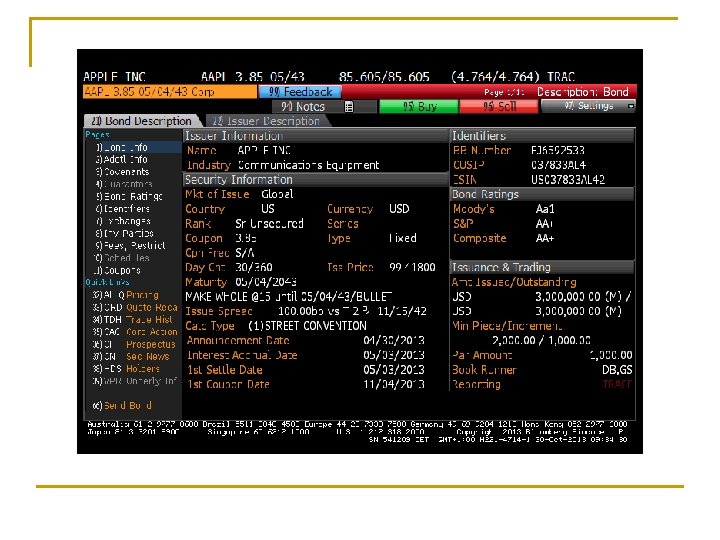
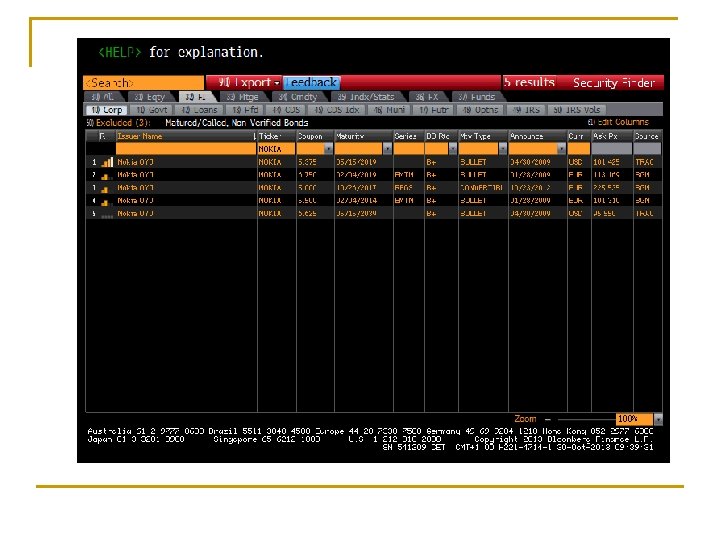
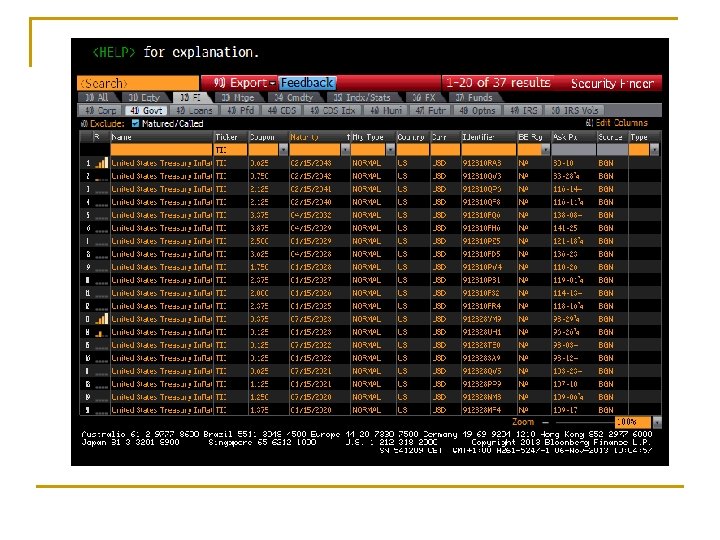
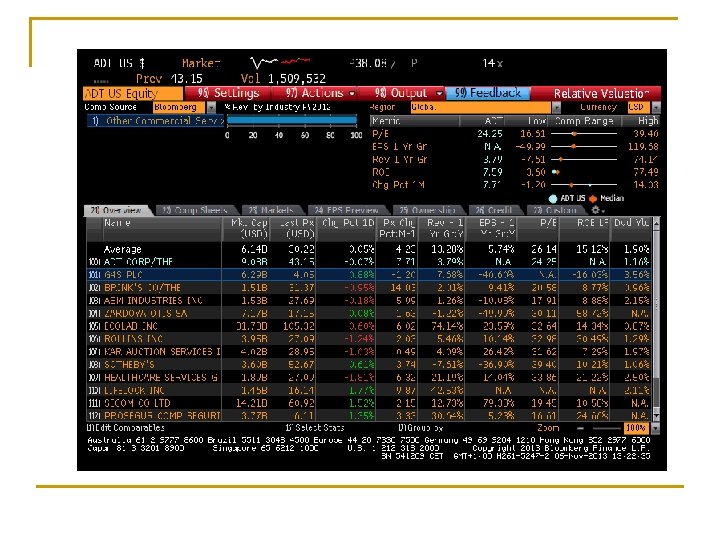
Figure 14. 2 Corporate Bond Listings

Innovative Bonds q Floaters and Inverse Floaters n n q Asset-Backed n n q Income from a specified group of assets is used to service the debt Walt Disney Bonds Catastrophe n q Same as floating-rate bonds Coupon rate on these bond falls when the general level of interest rates rises Way how to transfer catastrophe risk in capital market Indexed bonds n Payments are tied to a general price index or a price of a commodity q TIPS

Table 14. 1 Principal and Interest Payments for Treasury Inflation Protected Security


Bond Pricing n Repayments occur months or years in the future q n Nominal risk free rate q n Depend on the future value and present value Real risk free rate + compensation for expected inflation Not riskless q Additional premium n Default risk, liquidity, taxation, call risk, etc.

Bond Pricing PB = Price of the bond Ct = interest or coupon payments T = number of periods to maturity y = semi-annual discount rate or the semi-annual yield to maturity
, Face = $1, 000 Ct P T r")
Price: 10 -yr, 8% Coupon (SA), Face = $1, 000 Ct P T r = 40 (SA) = 1000 = 20 periods = 3% (SA)

n At a higher interest rate q n n PV is lower Bond price will fall as market interest rates rise The negative shape (Bond Price x Interest Rate) q q Inverse relationship between prices and yields An increase in the interest rate results in a price decline that is smaller than the price gain resulting from decrease in the interest rate n convexivity

Figure 14. 3 The Inverse Relationship Between Bond Prices and Yields

n n n The inverse relation between price and yield is a central feature of fixed-income securities Interest rate fluctuations represent the main source of risk General rule in evaluating bonds price risk q q n Keeping all other factors same The longer the maturity of the bond, the greater the sensitivity of price to fluctuations in the interest rate This is why short-term T securities are considered to be the safest q Free not only of default risk but also largely price risk

Table 14. 2 Bond Prices at Different Interest Rates (8% Coupon Bond, Coupons Paid Semiannually

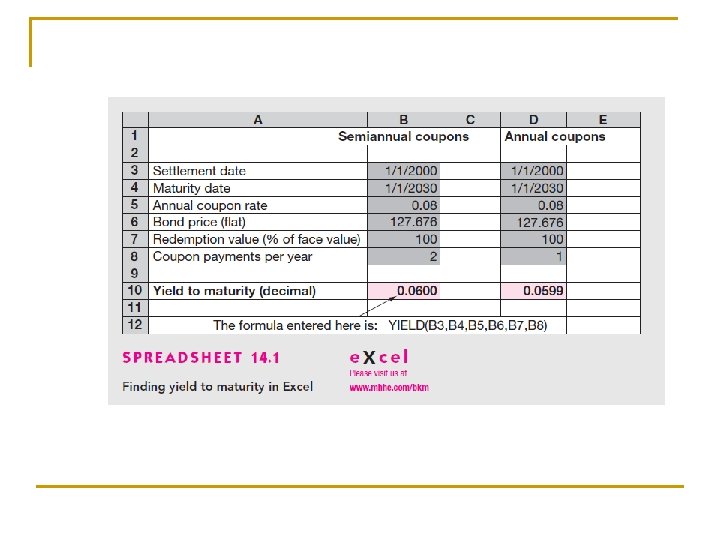
Yield to Maturity n A investor considering the purchase of a bond is not quoted q n Yield to maturity q n Use bond price, maturity day, coupon payment to infer return offered by the bond over its life Interest rate that makes the PV of a bond’s payments equal to its price The average rate of return that will be earned on a bond if it is bought now and held until maturity

Yield to Maturity Interest rate that makes the present value of the bond’s payments equal to its price. Solve the bond formula for r n

Yield to Maturity Example 10 yr Maturity Coupon Rate = 7% Price = $950 Solve for r = semiannual rate r = 3. 8635%

Effective annual yield n n n Annualized interest rate on a security computed using compound interest techniques. The yield on an investment in one year, taking into account the effects of compounding. AEY=(1+periodic rate)^period – 1 Number of period representing a year Eg. Semiannualy → periods = 2

Effective annual yield n For example, if one has a fixed-income investment such as certificate of deposit that pays 3% in interest each month, the annual percentage yield is more than 3% because compounding the interest results in a (slightly) higher return each month.

Effective annual yield n n In this example, the annual effective yield is calculated thus: Annual percentage yield = (1. 03)^12 - 1 =. 43 = 43%, where 1. 03 is 1 plus the monthly interest and 12 is the number of times in a year interest is compounded. It is also known as the annual effective yield. Use for comparison with e. g. bonds with different coupon periods

Yield to Call n Yield to maturity q n Hold till maturity Yield to Call

Figure 14. 4 Bond Prices: Callable and Straight Debt

Example 14. 4 Yield to Call n n Yield to call = = 6, 64% Yield to maturity = 6, 82%

Realized Yield versus YTM n Reinvestment Assumptions q q n All coupons from return realized over life if all coupons are reinvested at an interest rate equal to the bond’s yield to maturity Example: a 2 -year bond, paying 10% coupon once a year When reinvestment rate equal to the 10% q q Realized compound return equals yield to maturity If not - reinvestment rate risk n Changes in interest rate

Figure 14. 5 Growth of Invested Funds

Bond Prices Over Time n Bond prices are set according to the PV q If coupon rate > market interest rate n n q Income is greater than that available elsewhere in the market Price of these bonds above their par values If coupon rate < market interest rate n n Income is lower than that available elsewhere in the market Price of these bonds under their par values

Holding-Period Return: Single Period HPR = [ I + ( P 0 - P 1 )] / P 0 where I = interest payment P 1 = price in one period P 0 = purchase price

Holding-Period Example CR = 8% YTM = 8% N=10 years Semiannual Compounding P 0 = $1000 In six months the rate falls to 7% P 1 = $1068. 55 HPR = [40 + ( 1068. 55 - 1000)] / 1000 HPR = 10. 85% (semiannual)

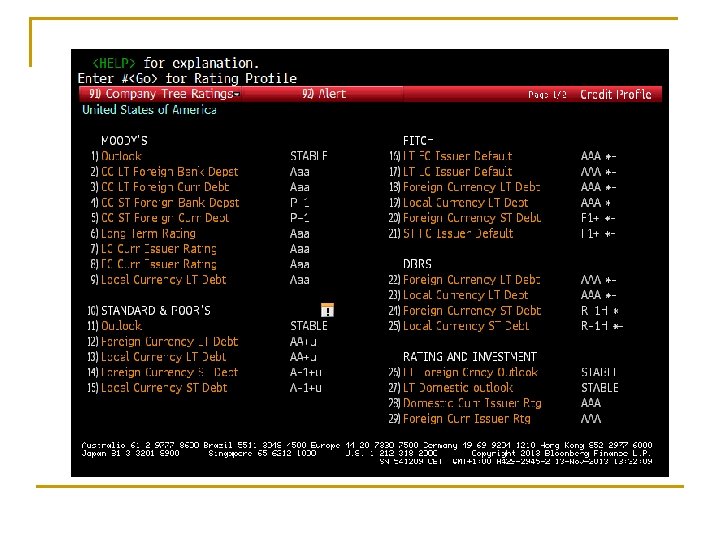
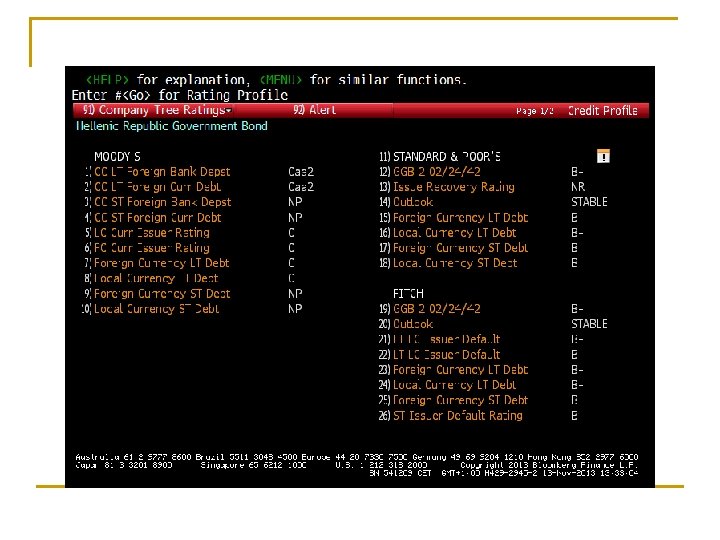
Default Risk and Ratings n Rating companies q q q n Moody’s Investor Service Standard & Poor’s Fitch Rating Categories q q Investment grade Speculative grade

Figure 14. 8 Definitions of Each Bond Rating Class

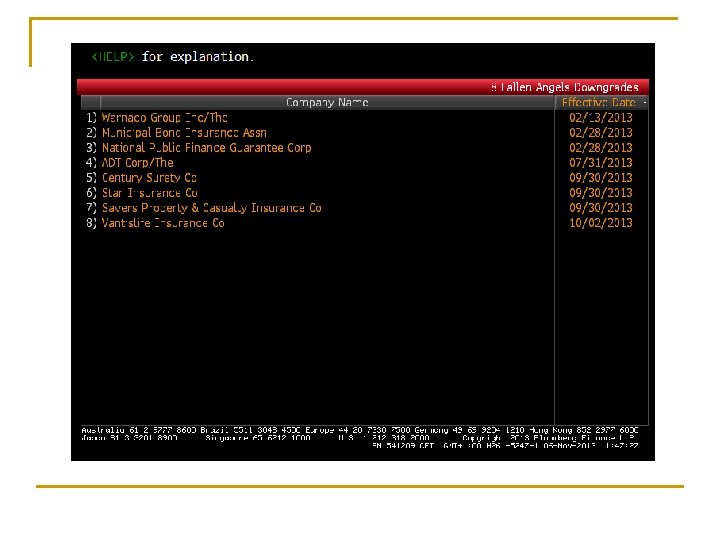
Junk Bonds n n High-yield bonds Before 1977 – fallen angels After 1977 – original-issue junk Drexel Burnham Lambert – Michael Milken q Network of potential investors into junk bonds n Till 1980’s

Factors Used by Rating Companies n Coverage ratios q q n Leverage ratios q n Debt-to-equity ratio Liquidity ratios q n Earnings to fixed costs Low or falling – cash flow difficulties Current: Quick (without inventories) Profitability ratios Cash flow to debt

Table 14. 3 Financial Ratios and Default Risk by Rating Class, Long. Term Debt

Protection Against Default n Sinking funds q n Subordination of future debt q n n To help ensure the commitment to spread payment problems over several years Factor that determine bond safety is total outstanding debt of the issuer Dividend restrictions Collateral

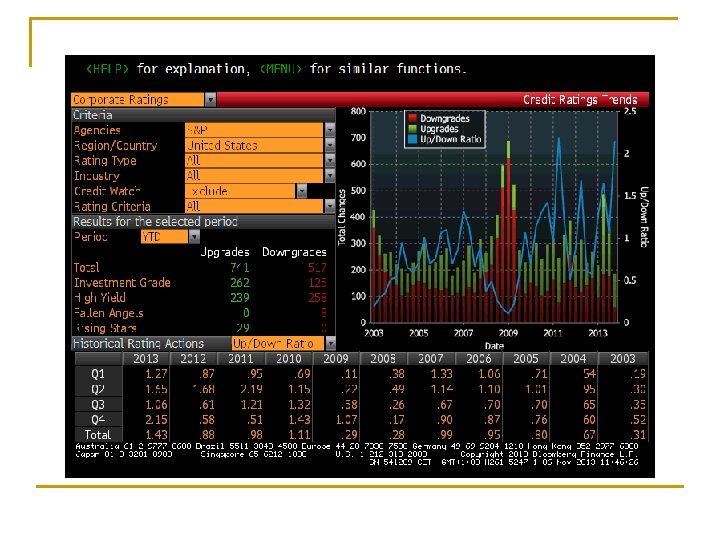
Default Risk and Yield n Yield to maturity and expected yield q n Maximum possible yield vs. yield with possibility of default Default premiums q q q To compensate for the possibility of default Yields compared to ratings Yield spreads over business cycles

Figure 14. 11 Yields on Long-Term Bonds, 1954 – 2006
- Slides: 64