Bond Prices and Yields Bond Characteristics n Fixed


Bond Prices and Yields

Bond Characteristics n Fixed income security q q n n Face or par value Coupon rate q n An arragement between borrower and purchaser The issuer makes specified payments to the bond holder on specified dates Zero coupon bond Indenture q The contract between the issuer nad the bondholder

Different Issuers of Bonds n U. S. Treasury q Notes and Bonds q Ranging from 10 to 30 years q In denominations $1. 000 or more q Minimum reduced in 2008 to $100 q Semiannual payments

Figure 14. 1 Listing of Treasury Issues

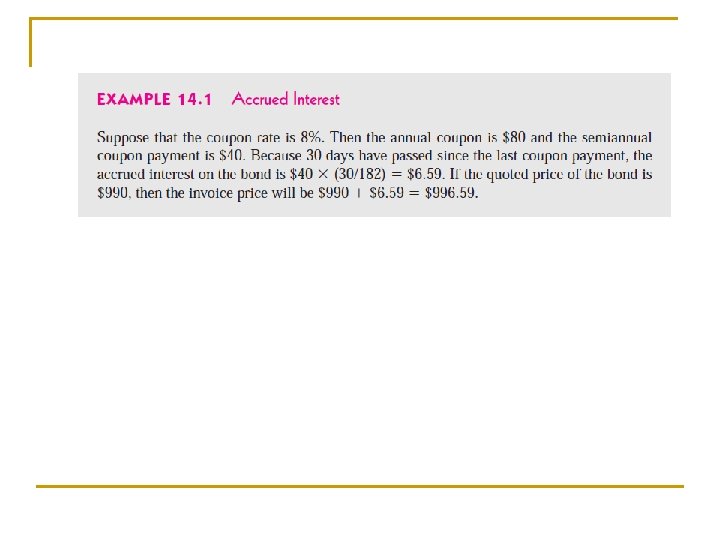
Accrued Interest and Quoted Bond Prices n n Quoted prices are not the prices that investor pay for the bond Quoted price does not include the interest that accrues between coupon payments dates

n Corporations q n n Most of them traded in OTC markets by bond dealers Municipalities International Governments and Corporations Innovative Bonds q Floaters and Inverse Floaters q Asset-Backed q Catastrophe Indexed Bonds

n Innovative Bonds q Floaters and Inverse Floaters n n q Asset-Backed n n q Same as floating-rate bonds Coupon rate on these bond falls when the general level of interest rates rises Income from a specified group of assets is used to service the debt Walt Disney Bonds Catastrophe n Way how to transfer catastrophe risk in capital market

Figure 14. 2 Corporate Bond Listings

Table 14. 1 Principal and Interest Payments for Treasury Inflation Protected Security

Bond Pricing n Repayments occur months or years in the future q n Nominal risk free rate q n Depend on the future value and present value Real risk free rate + compensation for expected inflation Not riskless q Additional premium n Default risk, liquidity, taxation, call risk, etc.

Bond Pricing PB = Price of the bond Ct = interest or coupon payments T = number of periods to maturity y = semi-annual discount rate or the semi-annual yield to maturity

Price: 10 -yr, 8% Coupon, Face = $1, 000 Ct P T r = 40 (SA) = 1000 = 20 periods = 3% (SA)

n At a higher interest rate q n n PV is lower Bond price will fall as market interest rates rise The negative shape q q Inverse relationship between prices and yields An increase in the interest rate results in a price decline that is smaller than the price gain resulting from decrease in the interest rate n convexivity
 have an inverse relationship n When")
Bond Prices and Yields (required rates of return) have an inverse relationship n When yields get very high the value of the bond will be very low. n When yields approach zero, the value of the bond approaches the sum of the cash flows.

Figure 14. 3 The Inverse Relationship Between Bond Prices and Yields

n n n The inverse relation between price and yield is a central feature of fixed-income securities Interest rate fluctuations represent the main source of risk General rule in evaluating bonds price risk q q n Keeping all other factors same The longer the maturity of the bond, the greater the sensitivity of price to fluctuations in the interest rate This is why short-term T securities are considered to be the safest q Free not only of default risk but also largely price risk

Table 14. 2 Bond Prices at Different Interest Rates (8% Coupon Bond, Coupons Paid Semiannually

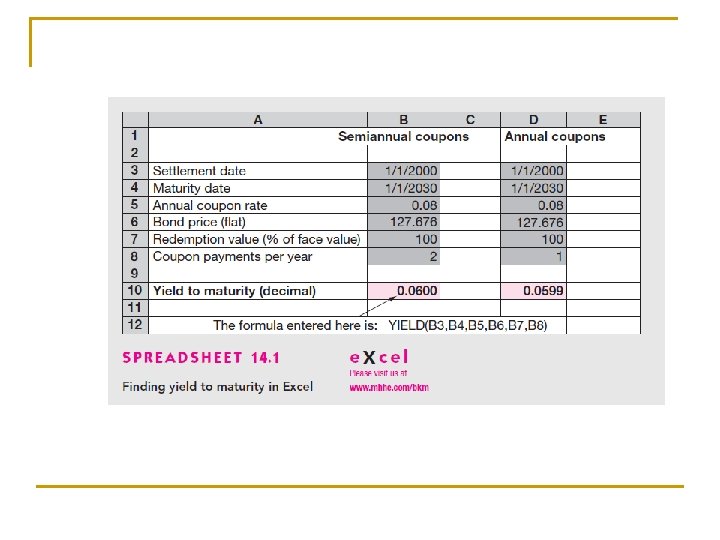
Yield to Maturity n A investor considering the purchase of a bond is not quoted q n Use bond price, maturity day, coupon payment to infer return offered by the bond over its life Yield to maturity q Interest rate that makes the PV of a bond’s payments equal to its price

Yield to Maturity Interest rate that makes the present value of the bond’s payments equal to its price. Solve the bond formula for r n

Yield to Maturity Example 10 yr Maturity Coupon Rate = 7% Price = $950 Solve for r = semiannual rate r = 3. 8635%

Yield to Call n Yield to maturity q n Hold till maturity Yield to Call

Figure 14. 4 Bond Prices: Callable and Straight Debt

Example 14. 4 Yield to Call

Realized Yield versus YTM n Reinvestment Assumptions q n All coupons from return realized over life if all coupons are reinvested at an interest rate equal to the bond’s yield to maturity When reinvestment rate equal to the 10% q q Realized compound return equals yield to maturity If not - reinvestment rate risk n Changes in interest rate

Figure 14. 5 Growth of Invested Funds

Bond Prices Over Time n Bond prices are set according to the PV q If coupon rate > market interest rate n n Income is greater than that available elsewhere in the market Price of these bonds above their par values

Holding-Period Return: Single Period HPR = [ I + ( P 0 - P 1 )] / P 0 where I = interest payment P 1 = price in one period P 0 = purchase price

Holding-Period Example CR = 8% YTM = 8% N=10 years Semiannual Compounding P 0 = $1000 In six months the rate falls to 7% P 1 = $1068. 55 HPR = [40 + ( 1068. 55 - 1000)] / 1000 HPR = 10. 85% (semiannual)

Figure 14. 7 The Price of a 30 -Year Zero. Coupon Bond over Time at a Yield to Maturity of 10%

Default Risk and Ratings n Rating companies q q q n Moody’s Investor Service Standard & Poor’s Fitch Rating Categories q q Investment grade Speculative grade

Figure 14. 8 Definitions of Each Bond Rating Class

Junk Bonds n n High-yield bonds Before 1977 – fallen angels After 1977 – original-issue junk Drexel Burnham Lambert – Michael Milken

Factors Used by Rating Companies n Coverage ratios q q n Leverage ratios q n Debt-to-equity ratio Liquidity ratios q n Earnings to fixed costs Low or falling – cash flow difficulties Current: Quick (without inventories) Profitability ratios Cash flow to debt

Table 14. 3 Financial Ratios and Default Risk by Rating Class, Long-Term Debt

Figure 14. 9 Discriminant Analysis

Protection Against Default n Sinking funds q n Subordination of future debt q n n To help ensure the commitment to spread payment problems over several years Factor that determine bond safety is total outstanding debt of the issuer Dividend restrictions Collateral

Default Risk and Yield n Yield to maturity and expected yield q n Maximum possible yield vs. yield with possibility of default Default premiums q q q To compensate for the possibility of default Yields compared to ratings Yield spreads over business cycles

Figure 14. 11 Yields on Long-Term Bonds, 1954 – 2006
- Slides: 41