BOLLINGER BANDS Arya Hafshejani MPP Data Science MCSA

BOLLINGER BANDS Arya Hafshejani MPP - Data Science MCSA SQL Server MS BI & Power BI Specialist

A SECRET AGENT’S CHOICE OF LIBATION?

JOHN BOLLINGER
 over a")
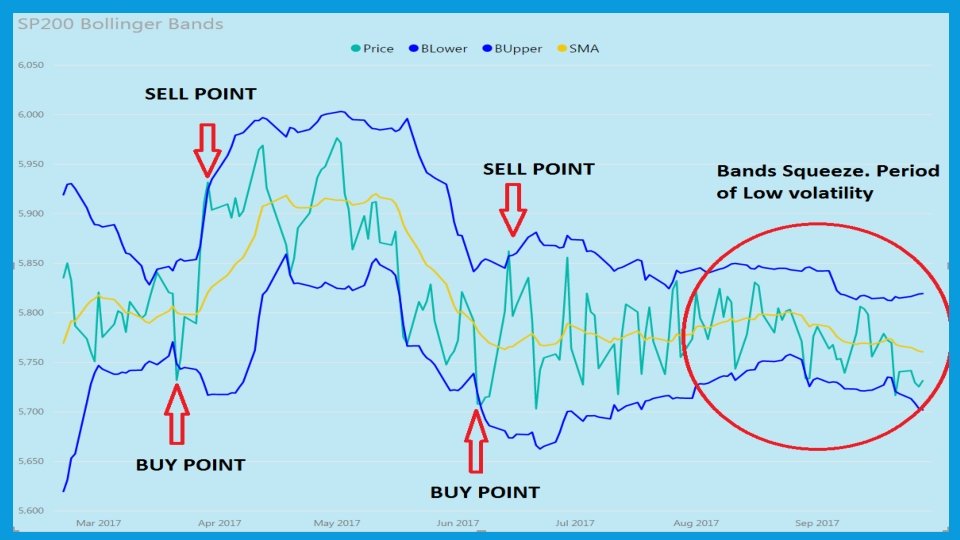
WHAT ARE BOLLINGER BANDS? Line graphs based on simple moving average (SMA) over a period. Upper band = SMA + 2 x. Standard Deviation SMA Lower band = SMA – 2 x. Standard Deviation SMA Bands can be indicators of selling & buying points Can be utilised on most monetary time sequence series: indices, overseas exchange, commodities, futures, options & bonds. Can be used on bars of any size, 5 minutes, one hour, day-to-day, weekly, and so forth. Don’t present steady recommendation. Traders use a strategy + other indictors with them Even there are no guarantees (Bellamy’s Milk) Other Applications Research papers on patterned fabric quality control to identify anomalies in fabric International Civil Aviation Organization is using bands to measure the accident rate as a safety indicator to measure efficacy of global safety initiatives.

IMPLEMENTATION Let’s implement S&P 500 for the last 100 days with SMA and Bollinger Bands We will also include a what-if scenario for changing the SMA period

OTHER CONSIDERATIONS This was only a SIMPLE demonstration in Power BI Desktop Think about how you would do this in real-time for several stocks in Power BI with a live stream data feed

ARYA. HAFSHEJANI@GMAIL. COM
- Slides: 8