
Boeing Cargo Liner Sonic Burner Update Dan Slaton
Boeing Cargo Liner Sonic Burner Update Dan Slaton, Technical Fellow Boeing Commercial Airplanes International Aircraft Materials Fire Test Working Group Solothurn, Switzerland June 25, 2014 Acknowledgements Tim Salter Lyle Bennett Tom Little Copyright © 2014 Boeing. All rights reserved. FAA Tech Center Boeing Engineering Operations & Technology Boeing Commercial Airplanes
Agenda § Background § Boeing Park vs. Boeing Sonic Burner results § Boeing Sonic Burner vs. Industry results § Observations/Discussion § Conclusions Copyright © 2009 Boeing. rights reserved. Copyright © 2014 Boeing. All rights reserved 2
Background § FAA TC has developed Sonic burner (configuration & settings) for cargo liner testing per 14 CFR 25. 855(c) – New Park oil burners as described in 14 CFR 25 Appendix F, Part III & Aircraft Materials Fire Test Handbook can no longer be procured -> alternative to Park burners required. § Overall FAA TC objectives: – 1. Create alternative to Park oil burner which will produce test results sufficiently similar to Park oil burner. – 2. Determine Sonic burner configuration and settings which enable reproducible results. § Boeing keenly interested in both objectives – Large volume of certification data collected using the Park oil burner. § For a slight design change, need to ensure future results from Sonic burner are sufficiently similar to Park oil burner certification results. – Need to ensure results from industry, including Boeing, are consistent and well-matched. Copyright © 2009 Boeing. rights reserved. Copyright © 2014 Boeing. All rights reserved 3
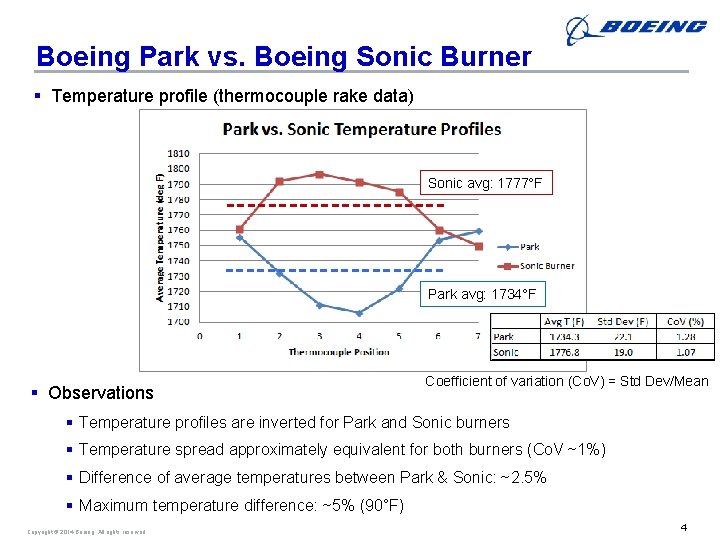
Boeing Park vs. Boeing Sonic Burner § Temperature profile (thermocouple rake data) Sonic avg: 1777°F Park avg: 1734°F § Observations Coefficient of variation (Co. V) = Std Dev/Mean § Temperature profiles are inverted for Park and Sonic burners § Temperature spread approximately equivalent for both burners (Co. V ~1%) § Difference of average temperatures between Park & Sonic: ~2. 5% § Maximum temperature difference: ~5% (90°F) Copyright © 2009 Boeing. rights reserved. Copyright © 2014 Boeing. All rights reserved 4
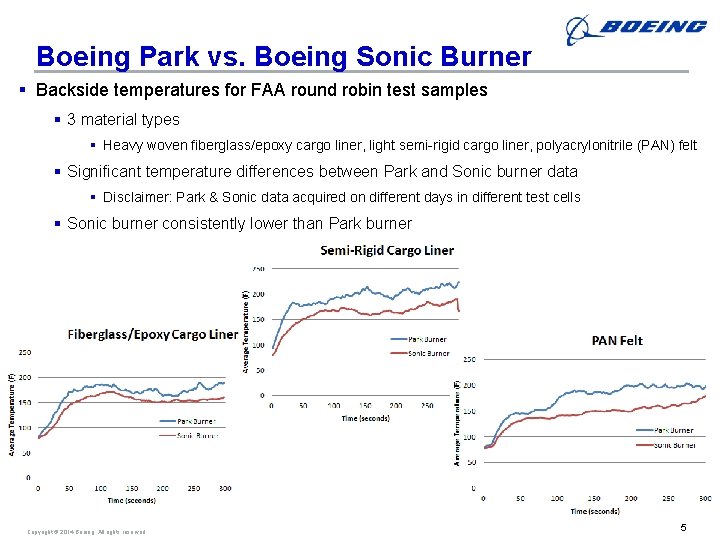
Boeing Park vs. Boeing Sonic Burner § Backside temperatures for FAA round robin test samples § 3 material types § Heavy woven fiberglass/epoxy cargo liner, light semi-rigid cargo liner, polyacrylonitrile (PAN) felt § Significant temperature differences between Park and Sonic burner data § Disclaimer: Park & Sonic data acquired on different days in different test cells § Sonic burner consistently lower than Park burner Copyright © 2009 Boeing. rights reserved. Copyright © 2014 Boeing. All rights reserved 5
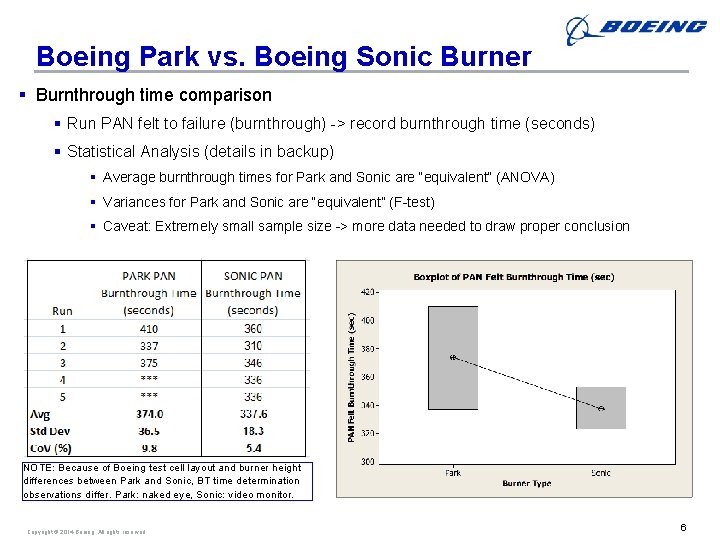
Boeing Park vs. Boeing Sonic Burner § Burnthrough time comparison § Run PAN felt to failure (burnthrough) -> record burnthrough time (seconds) § Statistical Analysis (details in backup) § Average burnthrough times for Park and Sonic are “equivalent” (ANOVA) § Variances for Park and Sonic are “equivalent” (F-test) § Caveat: Extremely small sample size -> more data needed to draw proper conclusion NOTE: Because of Boeing test cell layout and burner height differences between Park and Sonic, BT time determination observations differ. Park: naked eye, Sonic: video monitor. Copyright © 2009 Boeing. rights reserved. Copyright © 2014 Boeing. All rights reserved 6
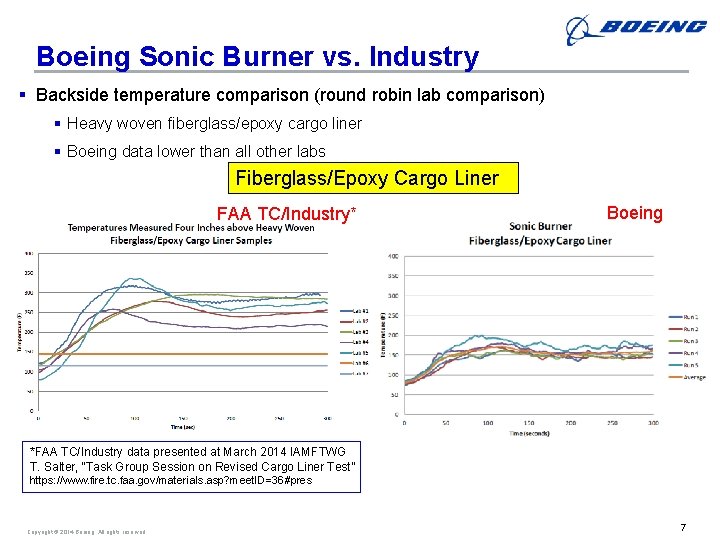
Boeing Sonic Burner vs. Industry § Backside temperature comparison (round robin lab comparison) § Heavy woven fiberglass/epoxy cargo liner § Boeing data lower than all other labs Fiberglass/Epoxy Cargo Liner FAA TC/Industry* Boeing *FAA TC/Industry data presented at March 2014 IAMFTWG T. Salter, “Task Group Session on Revised Cargo Liner Test” https: //www. fire. tc. faa. gov/materials. asp? meet. ID=36#pres Copyright © 2009 Boeing. rights reserved. Copyright © 2014 Boeing. All rights reserved 7
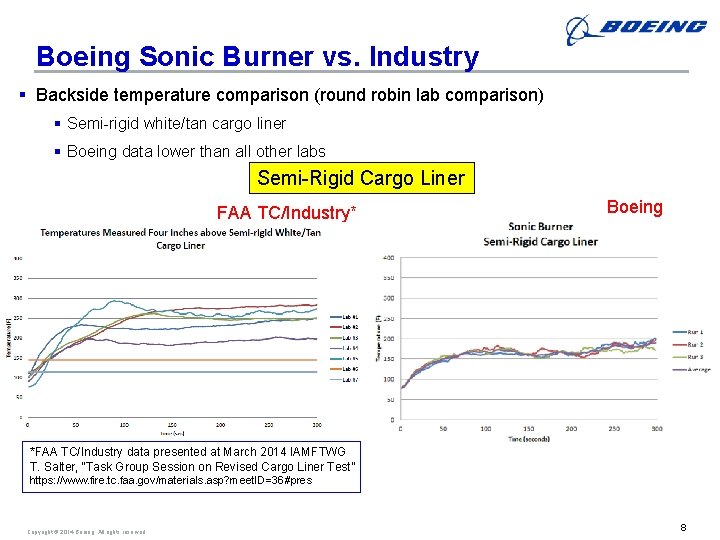
Boeing Sonic Burner vs. Industry § Backside temperature comparison (round robin lab comparison) § Semi-rigid white/tan cargo liner § Boeing data lower than all other labs Semi-Rigid Cargo Liner FAA TC/Industry* Boeing *FAA TC/Industry data presented at March 2014 IAMFTWG T. Salter, “Task Group Session on Revised Cargo Liner Test” https: //www. fire. tc. faa. gov/materials. asp? meet. ID=36#pres Copyright © 2009 Boeing. rights reserved. Copyright © 2014 Boeing. All rights reserved 8
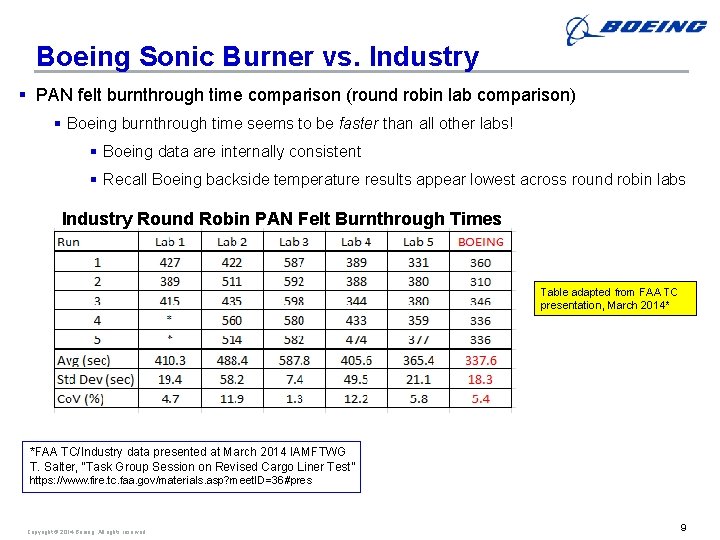
Boeing Sonic Burner vs. Industry § PAN felt burnthrough time comparison (round robin lab comparison) § Boeing burnthrough time seems to be faster than all other labs! § Boeing data are internally consistent § Recall Boeing backside temperature results appear lowest across round robin labs Industry Round Robin PAN Felt Burnthrough Times Table adapted from FAA TC presentation, March 2014* *FAA TC/Industry data presented at March 2014 IAMFTWG T. Salter, “Task Group Session on Revised Cargo Liner Test” https: //www. fire. tc. faa. gov/materials. asp? meet. ID=36#pres Copyright © 2009 Boeing. rights reserved. Copyright © 2014 Boeing. All rights reserved 9
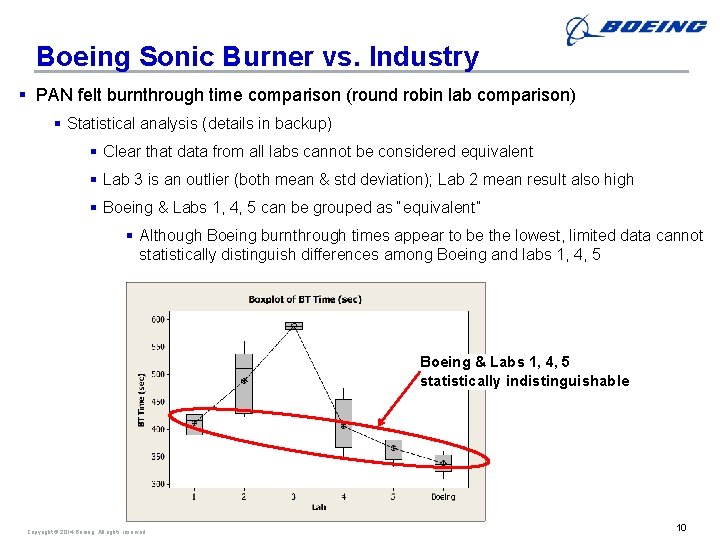
Boeing Sonic Burner vs. Industry § PAN felt burnthrough time comparison (round robin lab comparison) § Statistical analysis (details in backup) § Clear that data from all labs cannot be considered equivalent § Lab 3 is an outlier (both mean & std deviation); Lab 2 mean result also high § Boeing & Labs 1, 4, 5 can be grouped as “equivalent” § Although Boeing burnthrough times appear to be the lowest, limited data cannot statistically distinguish differences among Boeing and labs 1, 4, 5 Boeing & Labs 1, 4, 5 statistically indistinguishable Copyright © 2009 Boeing. rights reserved. Copyright © 2014 Boeing. All rights reserved 10
Observations & Discussion § Round robin results § Significant variations in experimental results across labs § Backside temperatures: average temperatures can differ by up to ~150 deg F § Burnthrough times: average BT times can differ by >4 minutes between 2 labs § What are the causes of variation? Answers may require: § Further analysis of existing data § TC rake data (average temperatures, temperature profiles) § Other parameters—fuel T, air T, fuel pressures, air pressures, exhaust flow, relative humidity, … § Additional data collection § Evaluation of input parameter tolerance range impacts § Collection of data from larger sets of samples § Collection of data from a wider range of materials § Equivalent performance validation (Park vs. Sonic) § Characterize how present materials/constructions perform for both burners § Determine degree of similarity between Park and Sonic burners Copyright © 2009 Boeing. rights reserved. Copyright © 2014 Boeing. All rights reserved 11
Conclusion § FAA has done significant development work on Sonic burner with quite good results to date § Still a variety of open issues related to… – Inter-lab matching of round robin results – Validation of Sonic burner as a comparable test method to Park oil burner § A new test method should not have a different safety basis § Continued development work required – Provide enhanced understanding of Sonic burner performance – Provide clues to the variations seen in results to date § Recommendation – FAA TC & Industry Task Group should determine next steps and develop a plan to move forward on continued Sonic burner test methodology development Copyright © 2009 Boeing. rights reserved. Copyright © 2014 Boeing. All rights reserved 12
Questions? Copyright © 2009 Boeing. rights reserved. Copyright © 2014 Boeing. All rights reserved 13
Backup Copyright © 2009 Boeing. rights reserved. Copyright © 2014 Boeing. All rights reserved 14
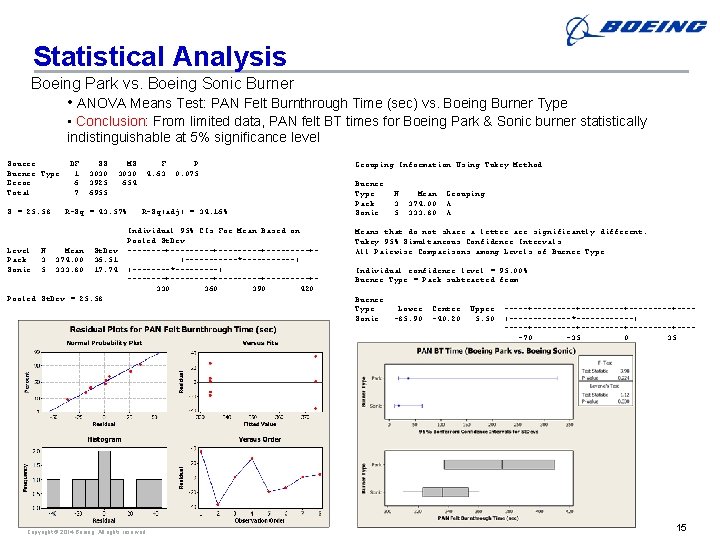
Statistical Analysis Boeing Park vs. Boeing Sonic Burner • ANOVA Means Test: PAN Felt Burnthrough Time (sec) vs. Boeing Burner Type • Conclusion: From limited data, PAN felt BT times for Boeing Park & Sonic burner statistically indistinguishable at 5% significance level Source Burner Type Error Total S = 25. 58 Level Park Sonic N 3 5 DF 1 6 7 SS 3030 3925 6955 MS 3030 654 R-Sq = 43. 57% Mean 374. 00 333. 80 St. Dev 36. 51 17. 74 F 4. 63 P 0. 075 R-Sq(adj) = 34. 16% Individual 95% CIs For Mean Based on Pooled St. Dev --------+-----+-----+(------*------) (----*-----) --------+-----+-----+330 360 390 420 Pooled St. Dev = 25. 58 Copyright © 2009 Boeing. rights reserved. Copyright © 2014 Boeing. All rights reserved Grouping Information Using Tukey Method Burner Type Park Sonic N 3 5 Mean 374. 00 333. 80 Grouping A A Means that do not share a letter are significantly different. Tukey 95% Simultaneous Confidence Intervals All Pairwise Comparisons among Levels of Burner Type Individual confidence level = 95. 00% Burner Type = Park subtracted from: Burner Type Sonic Lower -85. 90 Center -40. 20 Upper 5. 50 -----+---------+-----+---(-------*------) -----+---------+----70 -35 0 35 15
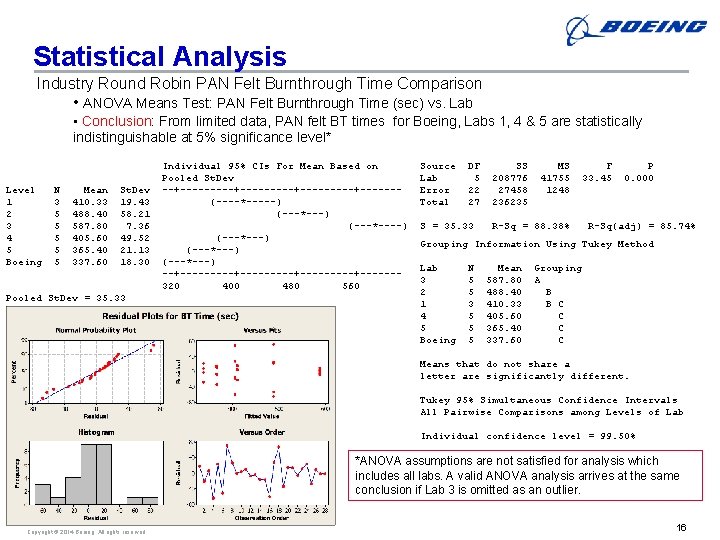
Statistical Analysis Industry Round Robin PAN Felt Burnthrough Time Comparison • ANOVA Means Test: PAN Felt Burnthrough Time (sec) vs. Lab • Conclusion: From limited data, PAN felt BT times for Boeing, Labs 1, 4 & 5 are statistically indistinguishable at 5% significance level* Level 1 2 3 4 5 Boeing N 3 5 5 5 Mean 410. 33 488. 40 587. 80 405. 60 365. 40 337. 60 St. Dev 19. 43 58. 21 7. 36 49. 52 21. 13 18. 30 Pooled St. Dev = 35. 33 Individual 95% CIs For Mean Based on Pooled St. Dev --+---------+-----+------(----*-----) (---*---) (---*---) --+---------+-----+------320 400 480 560 Source Lab Error Total DF 5 22 27 S = 35. 33 SS 208776 27458 236235 MS 41755 1248 R-Sq = 88. 38% F 33. 45 P 0. 000 R-Sq(adj) = 85. 74% Grouping Information Using Tukey Method Lab 3 2 1 4 5 Boeing N 5 5 3 5 5 5 Mean 587. 80 488. 40 410. 33 405. 60 365. 40 337. 60 Grouping A B B C C Means that do not share a letter are significantly different. Tukey 95% Simultaneous Confidence Intervals All Pairwise Comparisons among Levels of Lab Individual confidence level = 99. 50% *ANOVA assumptions are not satisfied for analysis which includes all labs. A valid ANOVA analysis arrives at the same conclusion if Lab 3 is omitted as an outlier. Copyright © 2009 Boeing. rights reserved. Copyright © 2014 Boeing. All rights reserved 16
- Slides: 16