
BMS 524 Introduction to Confocal Microscopy and Image
BMS 524 - “Introduction to Confocal Microscopy and Image Analysis” Lecture 5: Fluorescence Part II Department of Basic Medical Sciences, School of Veterinary Medicine Weldon School of Biomedical Engineering Purdue University J. Paul Robinson, Ph. D. SVM Professor of Cytomics & Professor of Biomedical Engineering Director, Purdue University Cytometry Laboratories, Purdue University These slides are intended for use in a lecture series. Copies of the slides are distributed and students encouraged to take their notes on these graphics. All material copyright J. Paul Robinson unless otherwise stated. No reproduction of this material is permitted without the written permission of J. Paul Robinson. Except that our materials may be used in notfor-profit educational institutions ith appropriate acknowledgement. It is illegal to upload this lecture to Course. Hero or any other site. You may download this Power. Point lecture at http: //tinyurl. com/2 dr 5 p This lecture was last updated in January, 2018 Find other PUCL Educational Materials at http: //www. cyto. purdue. edu/class © 1993 -2018 J. Paul Robinson - Purdue University Cytometry Laboratories Slide 1 /classes/BMS 524/524 lect 003. ppt
Overview • • Fluorescence The fluorescent microscope Types of fluorescent probes Problems with fluorochromes • General applications © 1993 -2018 J. Paul Robinson - Purdue University Cytometry Laboratories Slide 2 /classes/BMS 524/524 lect 003. ppt
Learning Objectives At the conclusion of this lecture you should: • Understand the nature of fluorescence • The restrictions under which fluorescence occurs • Nature of fluorescence probes • Spectra of different probes • Resonance Energy Transfer and what it is • Features of fluorescence © 1993 -2018 J. Paul Robinson - Purdue University Cytometry Laboratories Slide 3 /classes/BMS 524/524 lect 003. ppt
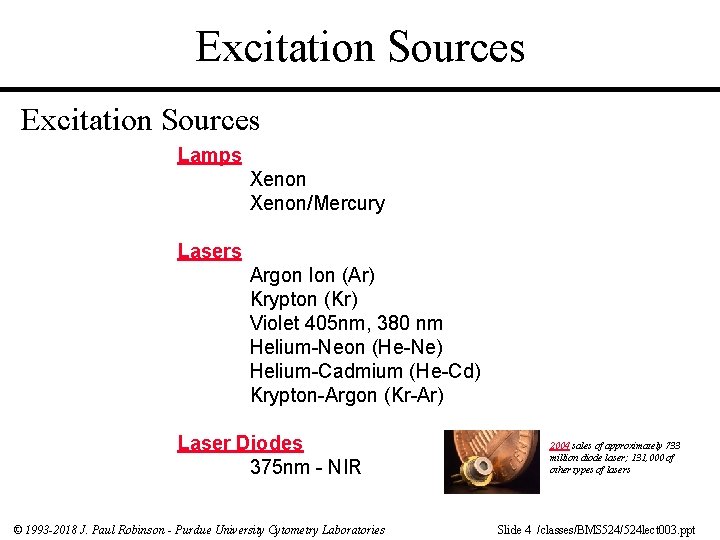
Excitation Sources Lamps Xenon/Mercury Lasers Argon Ion (Ar) Krypton (Kr) Violet 405 nm, 380 nm Helium-Neon (He-Ne) Helium-Cadmium (He-Cd) Krypton-Argon (Kr-Ar) Laser Diodes 375 nm - NIR © 1993 -2018 J. Paul Robinson - Purdue University Cytometry Laboratories 2004 sales of approximately 733 million diode laser; 131, 000 of other types of lasers Slide 4 /classes/BMS 524/524 lect 003. ppt
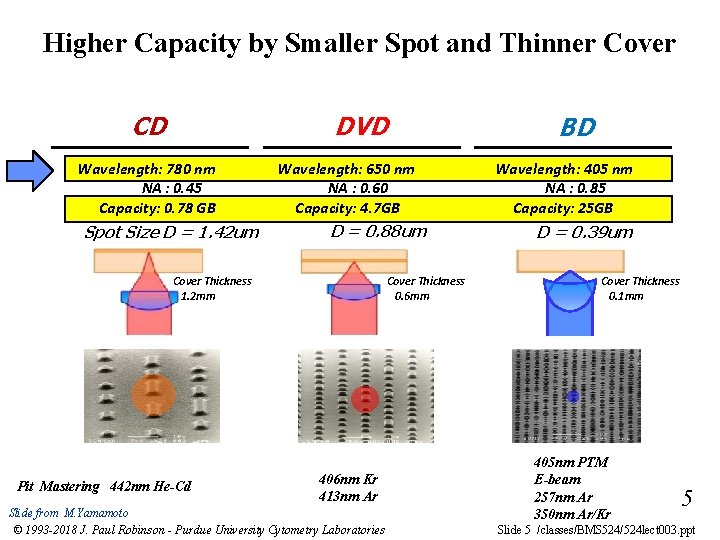
Higher Capacity by Smaller Spot and Thinner Cover CD DVD Wavelength: 780 nm NA : 0. 45 Capacity: 0. 78 GB Spot Size D = 1. 42 um Wavelength: 650 nm NA : 0. 60 Capacity: 4. 7 GB D = 0. 88 um Cover Thickness 1. 2 mm Pit Mastering 442 nm He-Cd Cover Thickness 0. 6 mm 406 nm Kr 413 nm Ar Slide from M. Yamamoto © 1993 -2018 J. Paul Robinson - Purdue University Cytometry Laboratories BD Wavelength: 405 nm NA : 0. 85 Capacity: 25 GB D = 0. 39 um Cover Thickness 0. 1 mm 405 nm PTM E-beam 257 nm Ar 350 nm Ar/Kr 5 Slide 5 /classes/BMS 524/524 lect 003. ppt
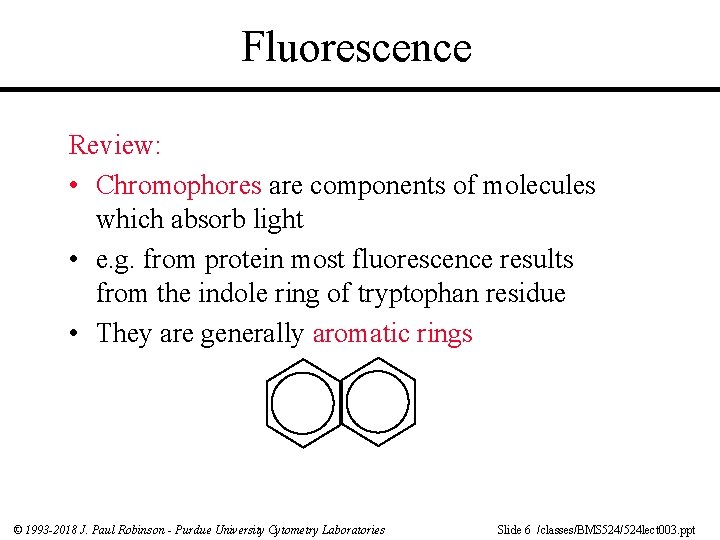
Fluorescence Review: • Chromophores are components of molecules which absorb light • e. g. from protein most fluorescence results from the indole ring of tryptophan residue • They are generally aromatic rings © 1993 -2018 J. Paul Robinson - Purdue University Cytometry Laboratories Slide 6 /classes/BMS 524/524 lect 003. ppt
Fluorescence • The wavelength of absorption is related to the size of the chromophores • Smaller chromophores, higher energy (shorter wavelength) © 1993 -2018 J. Paul Robinson - Purdue University Cytometry Laboratories Slide 7 /classes/BMS 524/524 lect 003. ppt
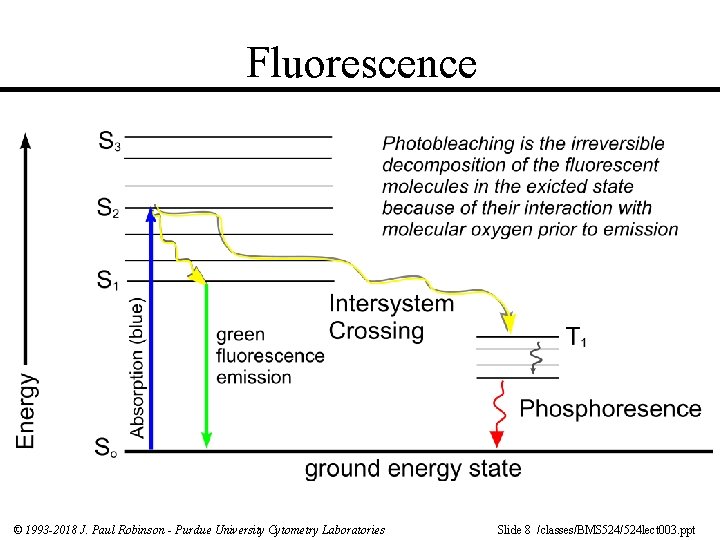
Fluorescence © 1993 -2018 J. Paul Robinson - Purdue University Cytometry Laboratories Slide 8 /classes/BMS 524/524 lect 003. ppt
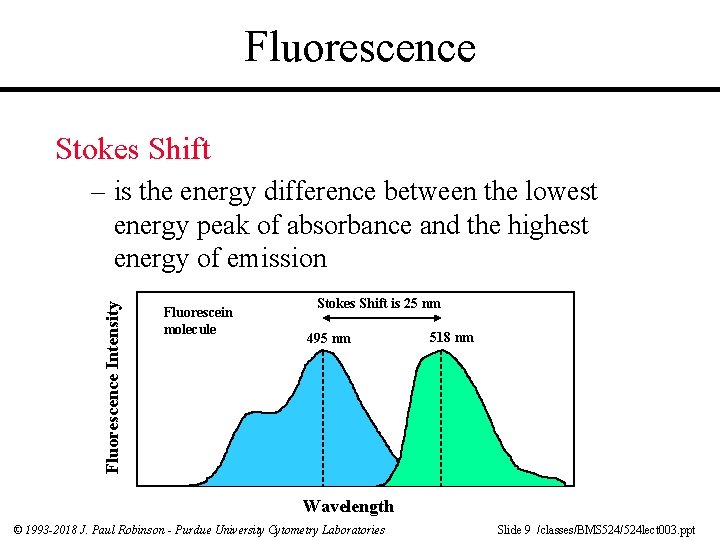
Fluorescence Stokes Shift Fluorescence Intensity – is the energy difference between the lowest energy peak of absorbance and the highest energy of emission Fluorescein molecule Stokes Shift is 25 nm 495 nm 518 nm Wavelength © 1993 -2018 J. Paul Robinson - Purdue University Cytometry Laboratories Slide 9 /classes/BMS 524/524 lect 003. ppt
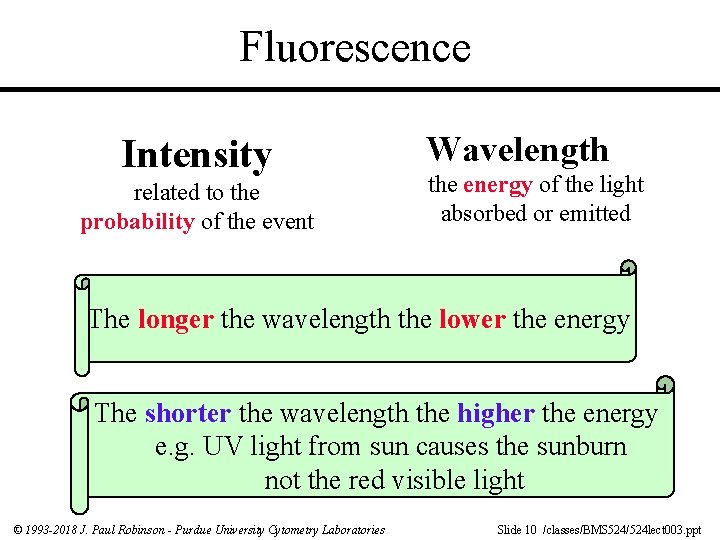
Fluorescence Intensity related to the probability of the event Wavelength the energy of the light absorbed or emitted The longer the wavelength the lower the energy The shorter the wavelength the higher the energy e. g. UV light from sun causes the sunburn not the red visible light © 1993 -2018 J. Paul Robinson - Purdue University Cytometry Laboratories Slide 10 /classes/BMS 524/524 lect 003. ppt
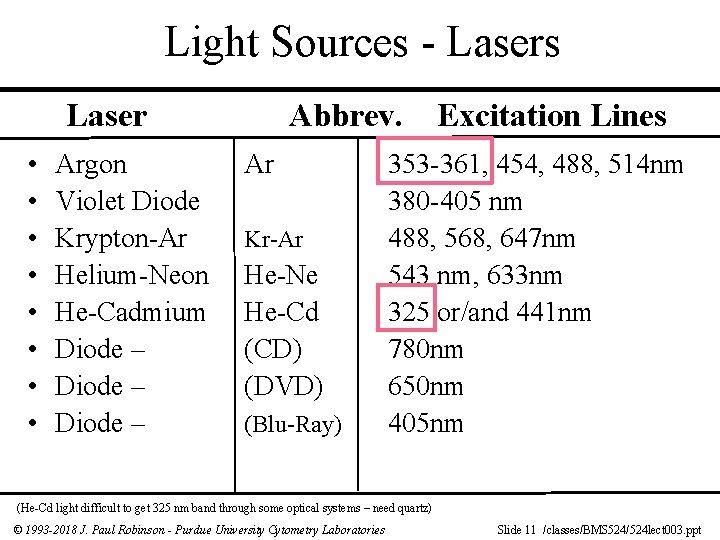
Light Sources - Lasers Laser • • Argon Violet Diode Krypton-Ar Helium-Neon He-Cadmium Diode – Abbrev. Ar Kr-Ar He-Ne He-Cd (CD) (DVD) (Blu-Ray) Excitation Lines 353 -361, 454, 488, 514 nm 380 -405 nm 488, 568, 647 nm 543 nm, 633 nm 325 or/and 441 nm 780 nm 650 nm 405 nm (He-Cd light difficult to get 325 nm band through some optical systems – need quartz) © 1993 -2018 J. Paul Robinson - Purdue University Cytometry Laboratories Slide 11 /classes/BMS 524/524 lect 003. ppt
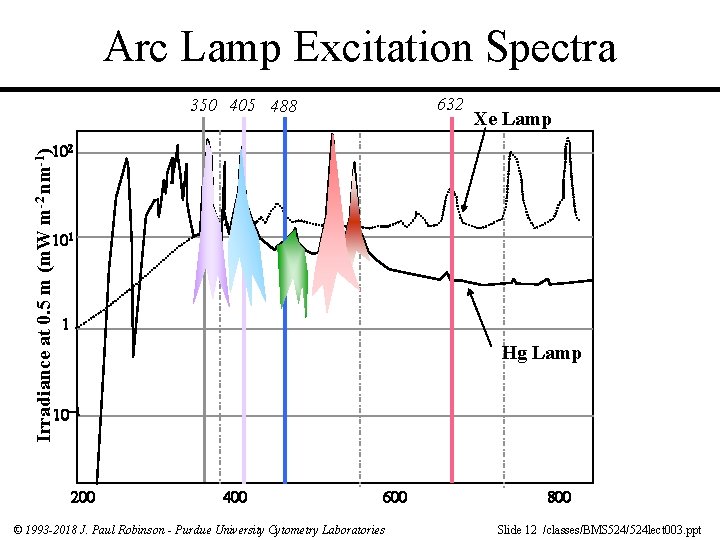
Arc Lamp Excitation Spectra 632 350 405 488 Xe Lamp Irradiance at 0. 5 m (m. W m-2 nm-1) Hg Lamp © 1993 -2018 J. Paul Robinson - Purdue University Cytometry Laboratories Slide 12 /classes/BMS 524/524 lect 003. ppt
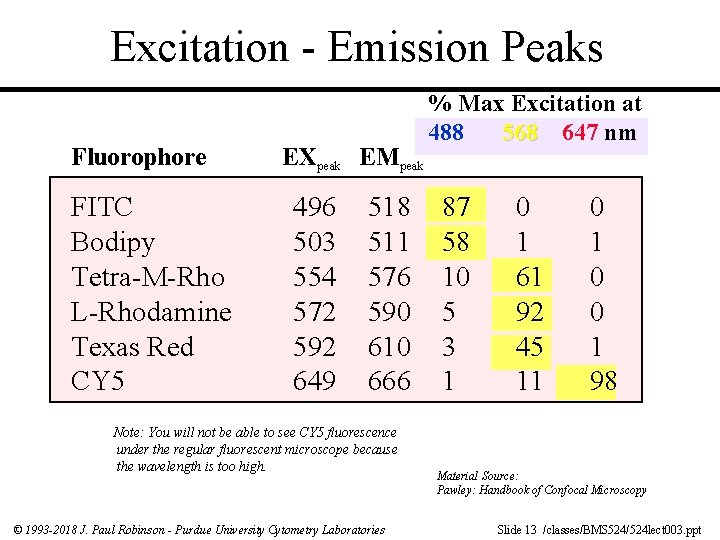
Excitation - Emission Peaks Fluorophore FITC Bodipy Tetra-M-Rho L-Rhodamine Texas Red CY 5 EXpeak EMpeak 496 503 554 572 592 649 518 511 576 590 610 666 Note: You will not be able to see CY 5 fluorescence under the regular fluorescent microscope because the wavelength is too high. © 1993 -2018 J. Paul Robinson - Purdue University Cytometry Laboratories % Max Excitation at 488 568 647 nm 87 58 10 5 3 1 0 1 61 92 45 11 0 0 1 98 Material Source: Pawley: Handbook of Confocal Microscopy Slide 13 /classes/BMS 524/524 lect 003. ppt
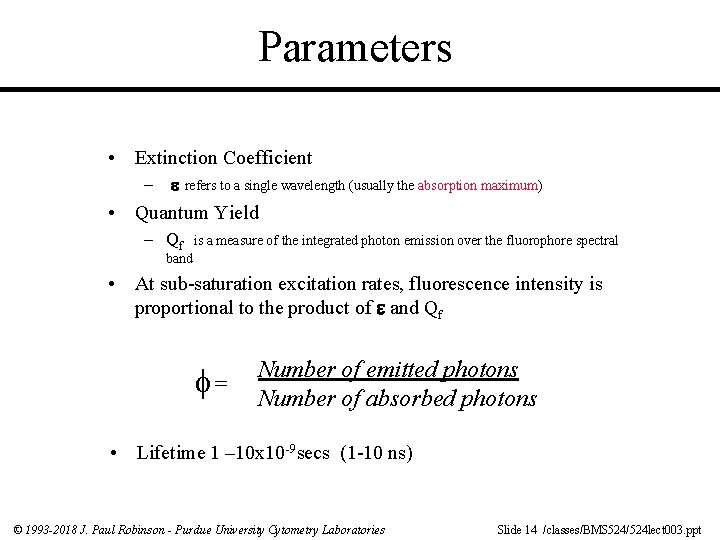
Parameters • Extinction Coefficient – refers to a single wavelength (usually the absorption maximum) • Quantum Yield – Qf is a measure of the integrated photon emission over the fluorophore spectral band • At sub-saturation excitation rates, fluorescence intensity is proportional to the product of and Qf = Number of emitted photons Number of absorbed photons • Lifetime 1 – 10 x 10 -9 secs (1 -10 ns) © 1993 -2018 J. Paul Robinson - Purdue University Cytometry Laboratories Slide 14 /classes/BMS 524/524 lect 003. ppt
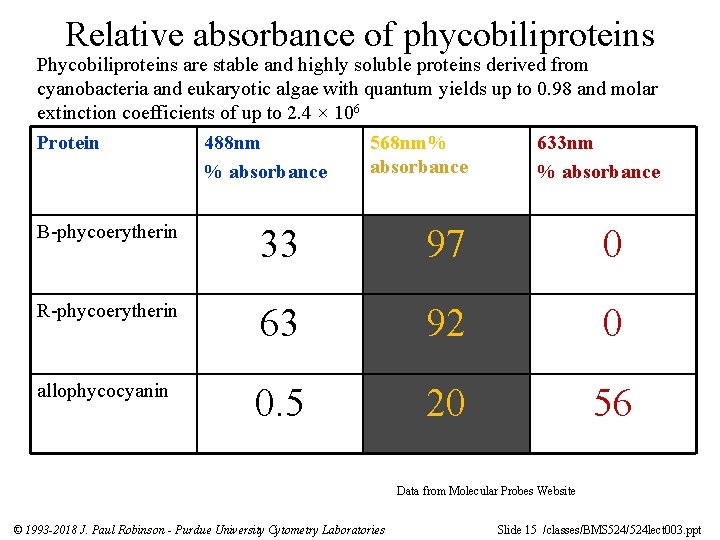
Relative absorbance of phycobiliproteins Phycobiliproteins are stable and highly soluble proteins derived from cyanobacteria and eukaryotic algae with quantum yields up to 0. 98 and molar extinction coefficients of up to 2. 4 × 10⁶ Protein 488 nm 568 nm% 633 nm absorbance % absorbance B-phycoerytherin 33 97 0 R-phycoerytherin 63 92 0 allophycocyanin 0. 5 20 56 Data from Molecular Probes Website © 1993 -2018 J. Paul Robinson - Purdue University Cytometry Laboratories Slide 15 /classes/BMS 524/524 lect 003. ppt
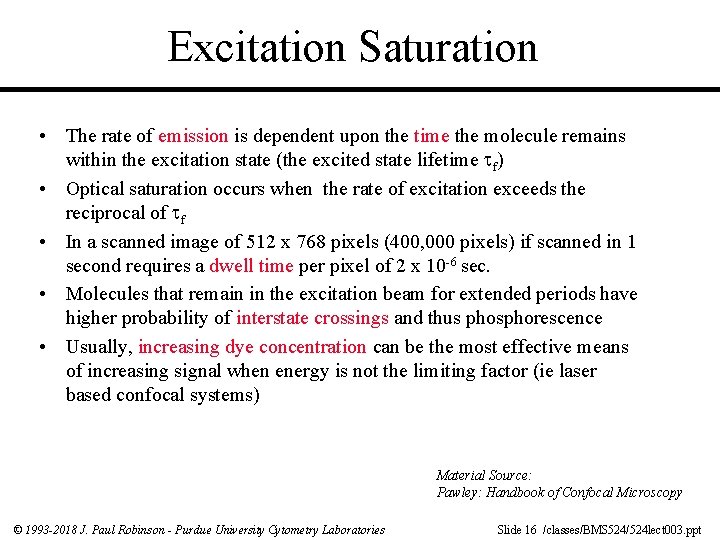
Excitation Saturation • The rate of emission is dependent upon the time the molecule remains within the excitation state (the excited state lifetime f) • Optical saturation occurs when the rate of excitation exceeds the reciprocal of f • In a scanned image of 512 x 768 pixels (400, 000 pixels) if scanned in 1 second requires a dwell time per pixel of 2 x 10 -6 sec. • Molecules that remain in the excitation beam for extended periods have higher probability of interstate crossings and thus phosphorescence • Usually, increasing dye concentration can be the most effective means of increasing signal when energy is not the limiting factor (ie laser based confocal systems) Material Source: Pawley: Handbook of Confocal Microscopy © 1993 -2018 J. Paul Robinson - Purdue University Cytometry Laboratories Slide 16 /classes/BMS 524/524 lect 003. ppt
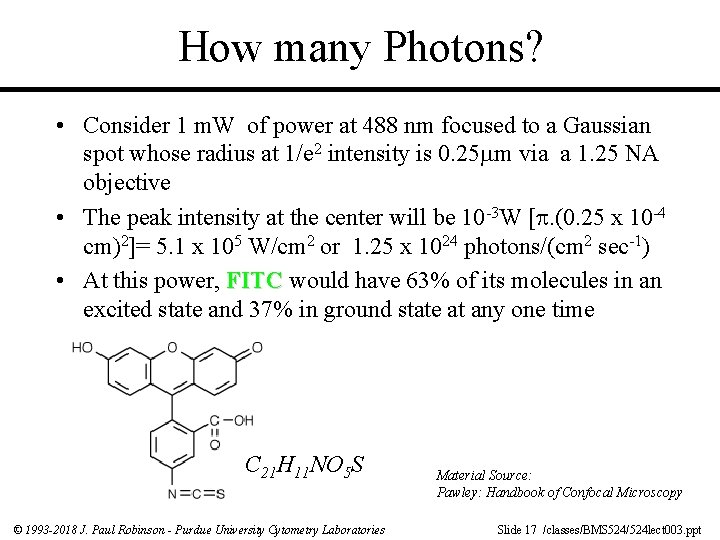
How many Photons? • Consider 1 m. W of power at 488 nm focused to a Gaussian spot whose radius at 1/e 2 intensity is 0. 25 m via a 1. 25 NA objective • The peak intensity at the center will be 10 -3 W [. (0. 25 x 10 -4 cm)2]= 5. 1 x 10⁵ W/cm 2 or 1. 25 x 1024 photons/(cm 2 sec-1) • At this power, FITC would have 63% of its molecules in an excited state and 37% in ground state at any one time C 21 H 11 NO 5 S © 1993 -2018 J. Paul Robinson - Purdue University Cytometry Laboratories Material Source: Pawley: Handbook of Confocal Microscopy Slide 17 /classes/BMS 524/524 lect 003. ppt
Photobleaching • Defined as the irreversible destruction of an excited fluorophore (discussed in later lecture) • Methods for countering photobleaching – – – Scan for shorter times Use high magnification, high NA objective Use wide emission filters Reduce excitation intensity Use “antifade” reagents (not compatible with viable cells) © 1993 -2018 J. Paul Robinson - Purdue University Cytometry Laboratories Slide 18 /classes/BMS 524/524 lect 003. ppt
Quenching Not a chemical process Dynamic quenching =- Collisional process usually controlled by mutual diffusion Typical quenchers – oxygen Aliphatic and aromatic amines (IK, NO 2, CHCl 3) Static Quenching Formation of ground state complex between the fluorophores and quencher with a non-fluorescent complex (temperature dependent – if you have higher quencher ground state complex is less likely and therefore less quenching) © 1993 -2018 J. Paul Robinson - Purdue University Cytometry Laboratories Slide 19 /classes/BMS 524/524 lect 003. ppt
Antifade Agents • Many quenchers act by reducing oxygen concentration to prevent formation of singlet oxygen • Satisfactory for fixed samples but not live cells! • Antioxidents such as propyl gallate, hydroquinone, pphenylenediamine are used • Reduce O 2 concentration or use singlet oxygen quenchers such as carotenoids (50 m. M crocetin or etretinate in cell cultures); ascorbate, imidazole, histidine, cysteamine, reduced glutathione, uric acid, trolox (vitamin E analogue) © 1993 -2018 J. Paul Robinson - Purdue University Cytometry Laboratories Slide 20 /classes/BMS 524/524 lect 003. ppt
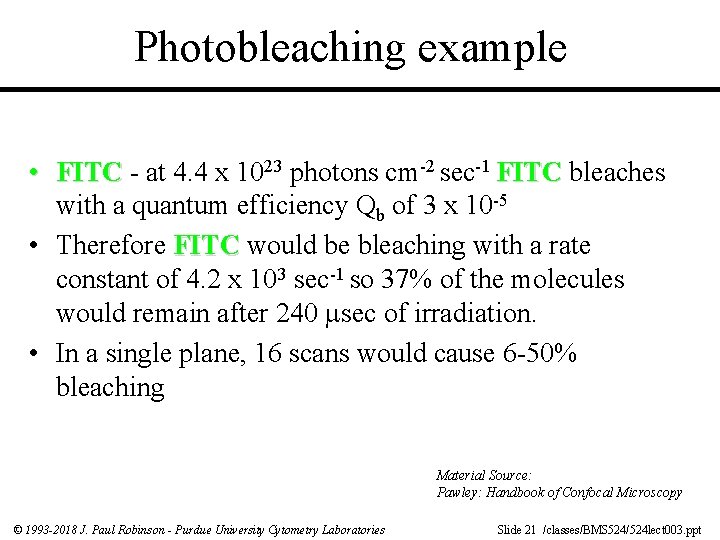
Photobleaching example • FITC - at 4. 4 x 10²³ photons cm-2 sec-1 FITC bleaches with a quantum efficiency Qb of 3 x 10 -5 • Therefore FITC would be bleaching with a rate constant of 4. 2 x 10³ sec-1 so 37% of the molecules would remain after 240 sec of irradiation. • In a single plane, 16 scans would cause 6 -50% bleaching Material Source: Pawley: Handbook of Confocal Microscopy © 1993 -2018 J. Paul Robinson - Purdue University Cytometry Laboratories Slide 21 /classes/BMS 524/524 lect 003. ppt
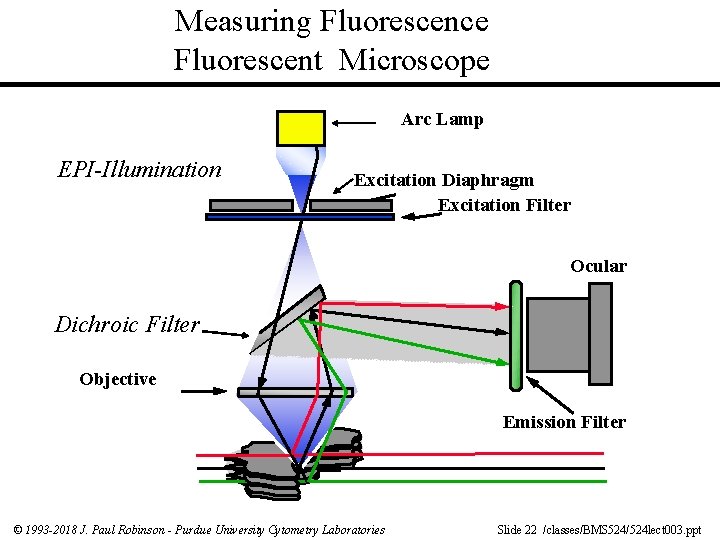
Measuring Fluorescence Fluorescent Microscope Arc Lamp EPI-Illumination Excitation Diaphragm Excitation Filter Ocular Dichroic Filter Objective Emission Filter © 1993 -2018 J. Paul Robinson - Purdue University Cytometry Laboratories Slide 22 /classes/BMS 524/524 lect 003. ppt
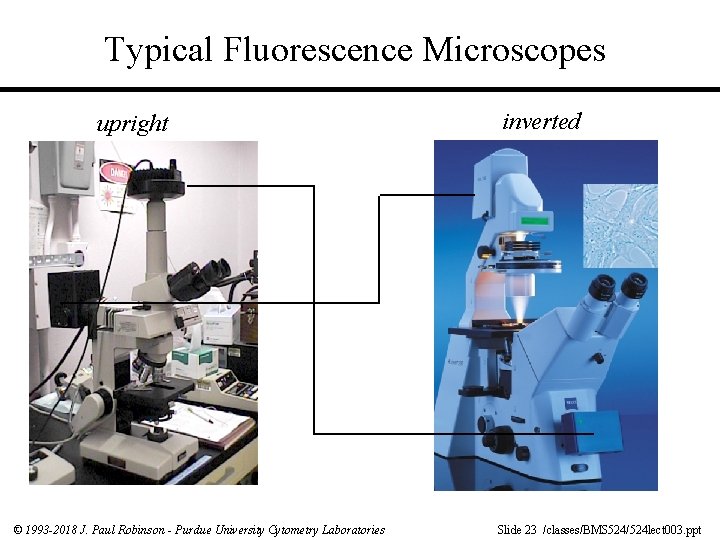
Typical Fluorescence Microscopes upright © 1993 -2018 J. Paul Robinson - Purdue University Cytometry Laboratories inverted Slide 23 /classes/BMS 524/524 lect 003. ppt
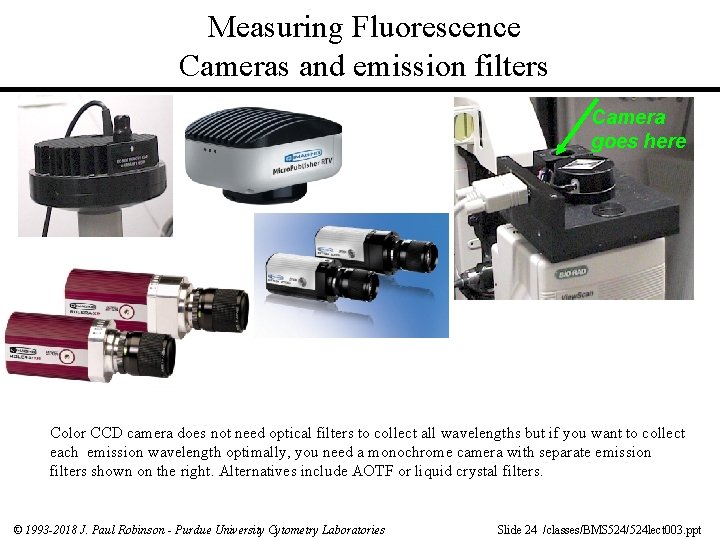
Measuring Fluorescence Cameras and emission filters Camera goes here Color CCD camera does not need optical filters to collect all wavelengths but if you want to collect each emission wavelength optimally, you need a monochrome camera with separate emission filters shown on the right. Alternatives include AOTF or liquid crystal filters. © 1993 -2018 J. Paul Robinson - Purdue University Cytometry Laboratories Slide 24 /classes/BMS 524/524 lect 003. ppt
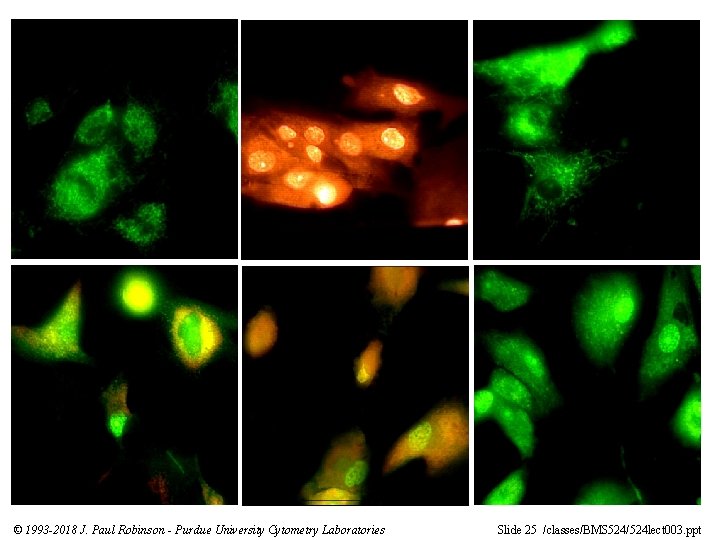
© 1993 -2018 J. Paul Robinson - Purdue University Cytometry Laboratories Slide 25 /classes/BMS 524/524 lect 003. ppt
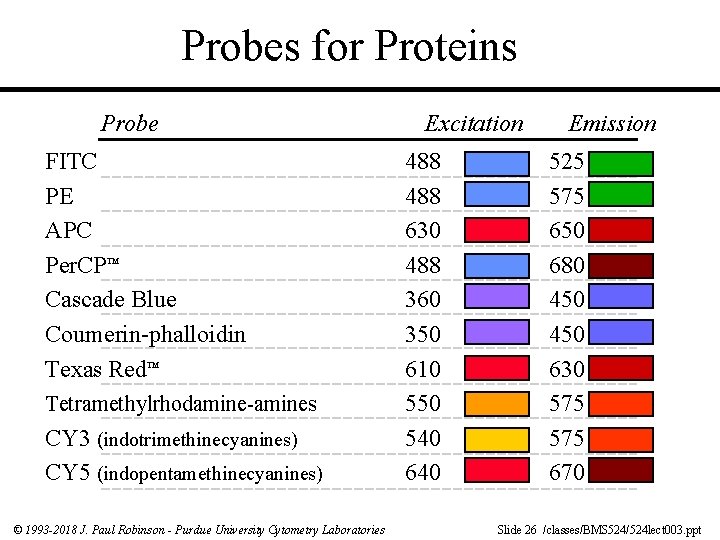
Probes for Proteins Probe FITC PE APC Per. CP™ Cascade Blue Coumerin-phalloidin Texas Red™ Tetramethylrhodamine-amines CY 3 (indotrimethinecyanines) CY 5 (indopentamethinecyanines) © 1993 -2018 J. Paul Robinson - Purdue University Cytometry Laboratories Excitation 488 630 488 360 350 610 550 540 640 Emission 525 575 650 680 450 630 575 670 Slide 26 /classes/BMS 524/524 lect 003. ppt
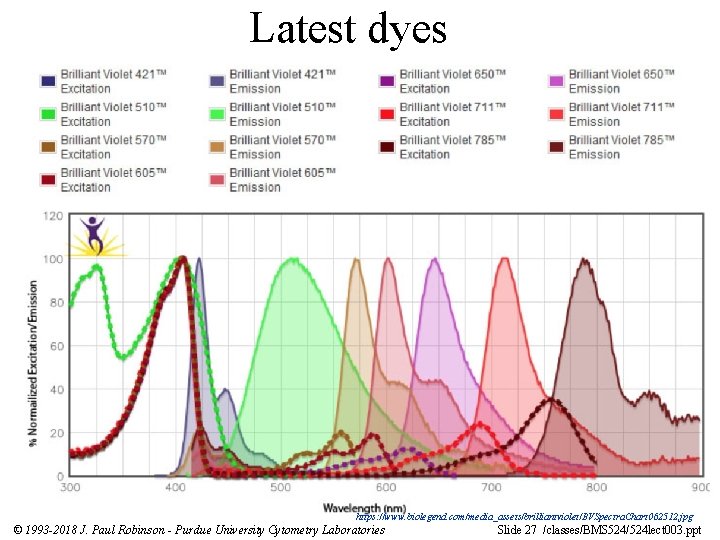
Latest dyes https: //www. biolegend. com/media_assets/brilliantviolet/BVSpectra. Chart 062512. jpg © 1993 -2018 J. Paul Robinson - Purdue University Cytometry Laboratories Slide 27 /classes/BMS 524/524 lect 003. ppt
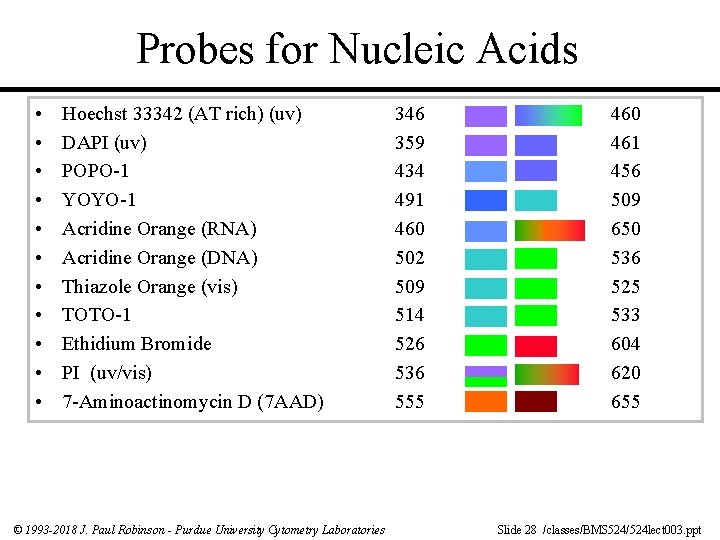
Probes for Nucleic Acids • • • Hoechst 33342 (AT rich) (uv) DAPI (uv) POPO-1 YOYO-1 Acridine Orange (RNA) Acridine Orange (DNA) Thiazole Orange (vis) TOTO-1 Ethidium Bromide PI (uv/vis) 7 -Aminoactinomycin D (7 AAD) © 1993 -2018 J. Paul Robinson - Purdue University Cytometry Laboratories 346 359 434 491 460 502 509 514 526 536 555 460 461 456 509 650 536 525 533 604 620 655 Slide 28 /classes/BMS 524/524 lect 003. ppt
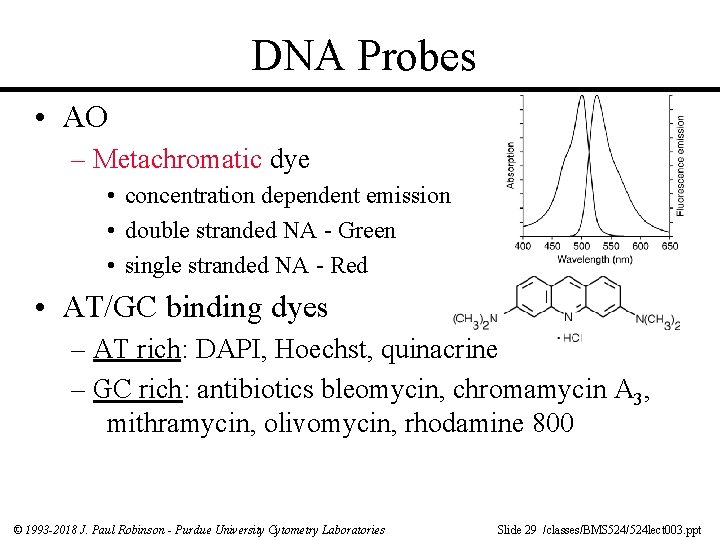
DNA Probes • AO – Metachromatic dye • concentration dependent emission • double stranded NA - Green • single stranded NA - Red • AT/GC binding dyes – AT rich: DAPI, Hoechst, quinacrine – GC rich: antibiotics bleomycin, chromamycin A 3, mithramycin, olivomycin, rhodamine 800 © 1993 -2018 J. Paul Robinson - Purdue University Cytometry Laboratories Slide 29 /classes/BMS 524/524 lect 003. ppt
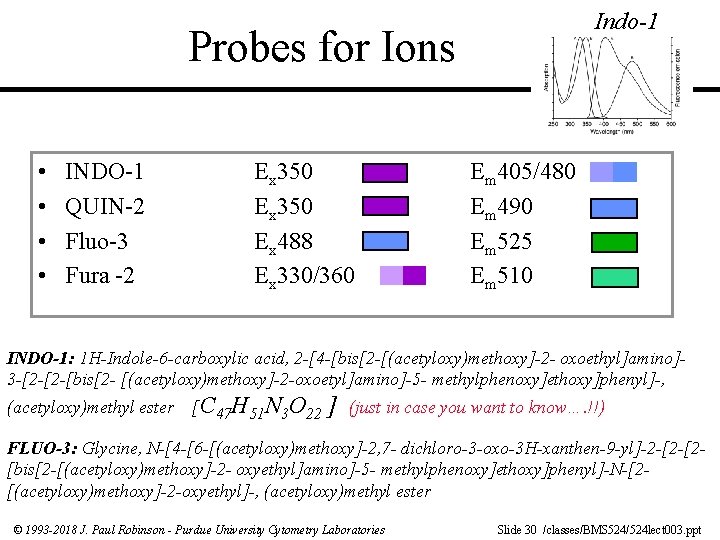
Indo-1 Probes for Ions • • INDO-1 QUIN-2 Fluo-3 Fura -2 Ex 350 Ex 488 Ex 330/360 Em 405/480 Em 490 Em 525 Em 510 INDO-1: 1 H-Indole-6 -carboxylic acid, 2 -[4 -[bis[2 -[(acetyloxy)methoxy]-2 - oxoethyl]amino]3 -[2 -[2 -[bis[2 - [(acetyloxy)methoxy]-2 -oxoetyl]amino]-5 - methylphenoxy]ethoxy]phenyl]-, (acetyloxy)methyl ester [C 47 H 51 N 3 O 22 ] (just in case you want to know…. !!) FLUO-3: Glycine, N-[4 -[6 -[(acetyloxy)methoxy]-2, 7 - dichloro-3 -oxo-3 H-xanthen-9 -yl]-2 -[2 -[2[bis[2 -[(acetyloxy)methoxy]-2 - oxyethyl]amino]-5 - methylphenoxy]ethoxy]phenyl]-N-[2[(acetyloxy)methoxy]-2 -oxyethyl]-, (acetyloxy)methyl ester © 1993 -2018 J. Paul Robinson - Purdue University Cytometry Laboratories Slide 30 /classes/BMS 524/524 lect 003. ppt
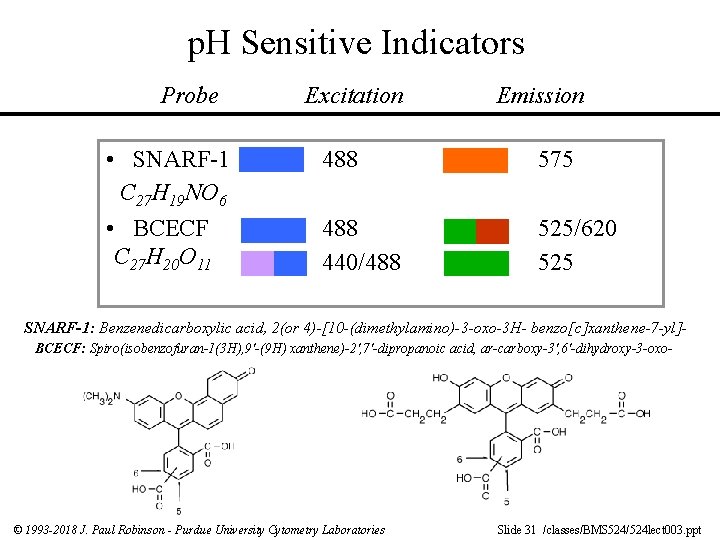
p. H Sensitive Indicators Probe • SNARF-1 C 27 H 19 NO 6 • BCECF C 27 H 20 O 11 Excitation Emission 488 575 488 440/488 525/620 525 SNARF-1: Benzenedicarboxylic acid, 2(or 4)-[10 -(dimethylamino)-3 -oxo-3 H- benzo[c]xanthene-7 -yl]BCECF: Spiro(isobenzofuran-1(3 H), 9'-(9 H) xanthene)-2', 7'-dipropanoic acid, ar-carboxy-3', 6'-dihydroxy-3 -oxo- © 1993 -2018 J. Paul Robinson - Purdue University Cytometry Laboratories Slide 31 /classes/BMS 524/524 lect 003. ppt
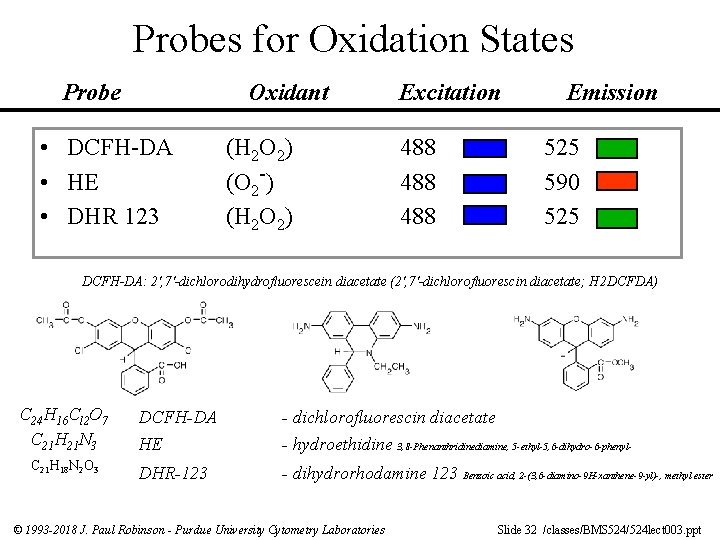
Probes for Oxidation States Probe Oxidant • DCFH-DA • HE • DHR 123 (H 2 O 2) (O 2 -) (H 2 O 2) Excitation 488 488 Emission 525 590 525 DCFH-DA: 2', 7'-dichlorodihydrofluorescein diacetate (2', 7'-dichlorofluorescin diacetate; H 2 DCFDA) C 24 H 16 Cl 2 O 7 C 21 H 21 N 3 C 21 H 18 N 2 O 3 DCFH-DA - dichlorofluorescin diacetate HE - hydroethidine 3, 8 -Phenanthridinediamine, 5 -ethyl-5, 6 -dihydro-6 -phenyl- DHR-123 - dihydrorhodamine 123 Benzoic acid, 2 -(3, 6 -diamino-9 H-xanthene-9 -yl)-, methyl ester © 1993 -2018 J. Paul Robinson - Purdue University Cytometry Laboratories Slide 32 /classes/BMS 524/524 lect 003. ppt
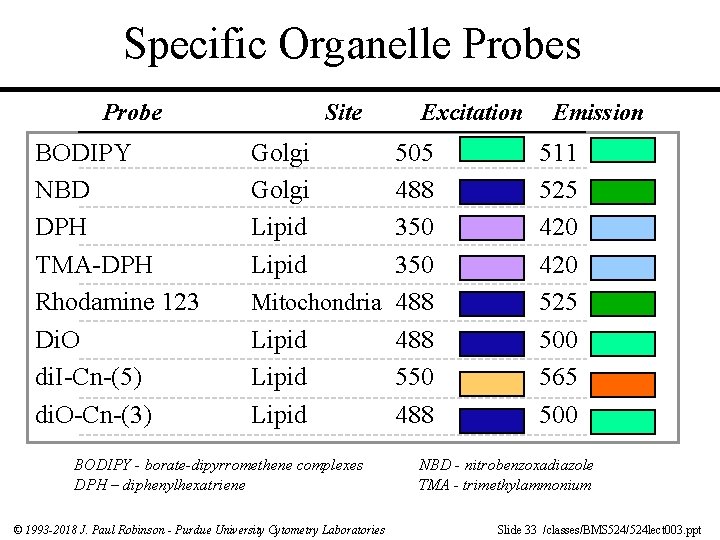
Specific Organelle Probes Probe BODIPY NBD DPH TMA-DPH Rhodamine 123 Di. O di. I-Cn-(5) di. O-Cn-(3) Site Golgi Lipid Excitation 505 488 350 Mitochondria 488 Lipid 550 Lipid 488 BODIPY - borate-dipyrromethene complexes DPH – diphenylhexatriene © 1993 -2018 J. Paul Robinson - Purdue University Cytometry Laboratories Emission 511 525 420 525 500 565 500 NBD - nitrobenzoxadiazole TMA - trimethylammonium Slide 33 /classes/BMS 524/524 lect 003. ppt
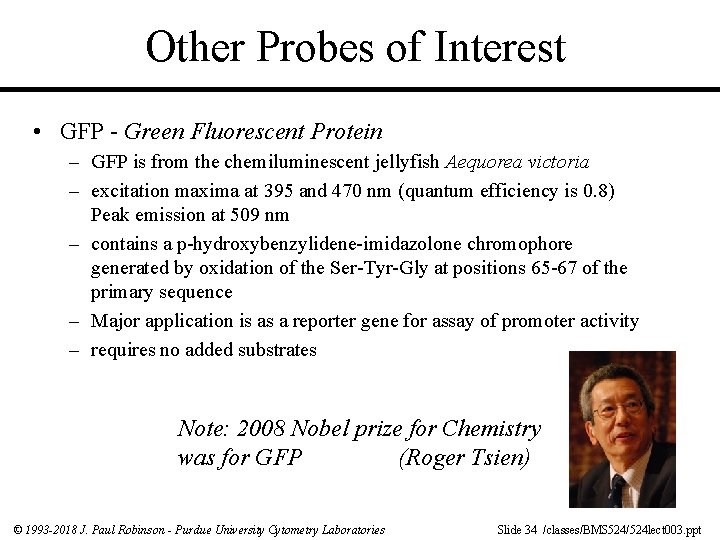
Other Probes of Interest • GFP - Green Fluorescent Protein – GFP is from the chemiluminescent jellyfish Aequorea victoria – excitation maxima at 395 and 470 nm (quantum efficiency is 0. 8) Peak emission at 509 nm – contains a p-hydroxybenzylidene-imidazolone chromophore generated by oxidation of the Ser-Tyr-Gly at positions 65 -67 of the primary sequence – Major application is as a reporter gene for assay of promoter activity – requires no added substrates Note: 2008 Nobel prize for Chemistry was for GFP (Roger Tsien) © 1993 -2018 J. Paul Robinson - Purdue University Cytometry Laboratories Slide 34 /classes/BMS 524/524 lect 003. ppt
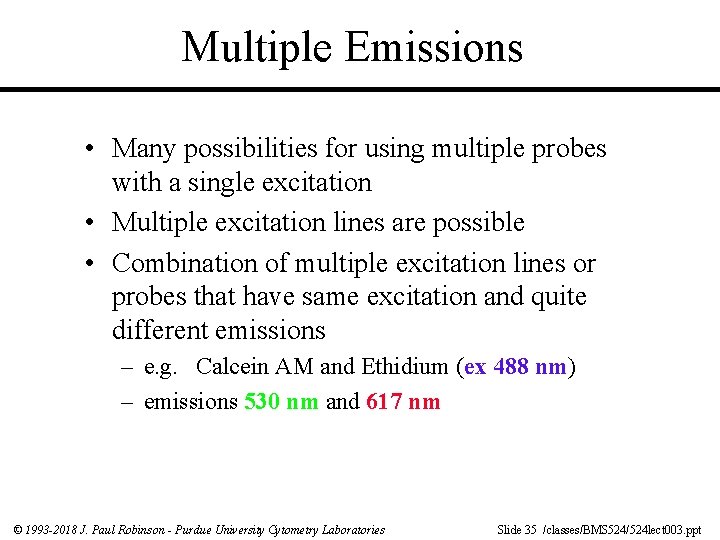
Multiple Emissions • Many possibilities for using multiple probes with a single excitation • Multiple excitation lines are possible • Combination of multiple excitation lines or probes that have same excitation and quite different emissions – e. g. Calcein AM and Ethidium (ex 488 nm) – emissions 530 nm and 617 nm © 1993 -2018 J. Paul Robinson - Purdue University Cytometry Laboratories Slide 35 /classes/BMS 524/524 lect 003. ppt
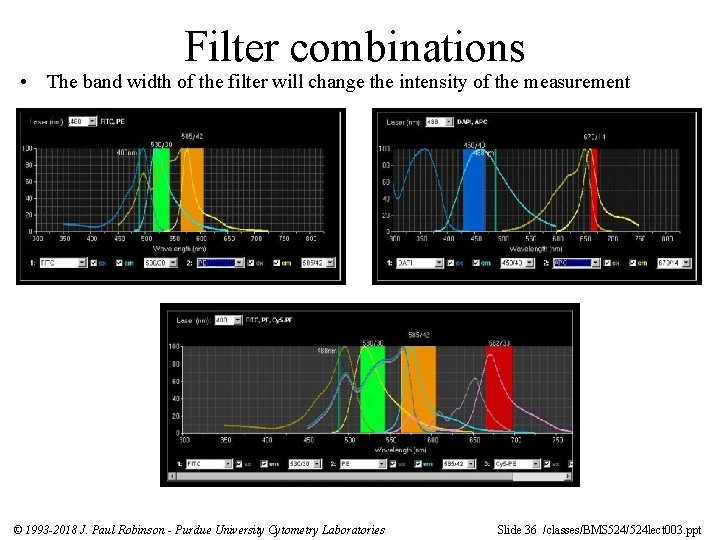
Filter combinations • The band width of the filter will change the intensity of the measurement © 1993 -2018 J. Paul Robinson - Purdue University Cytometry Laboratories Slide 36 /classes/BMS 524/524 lect 003. ppt
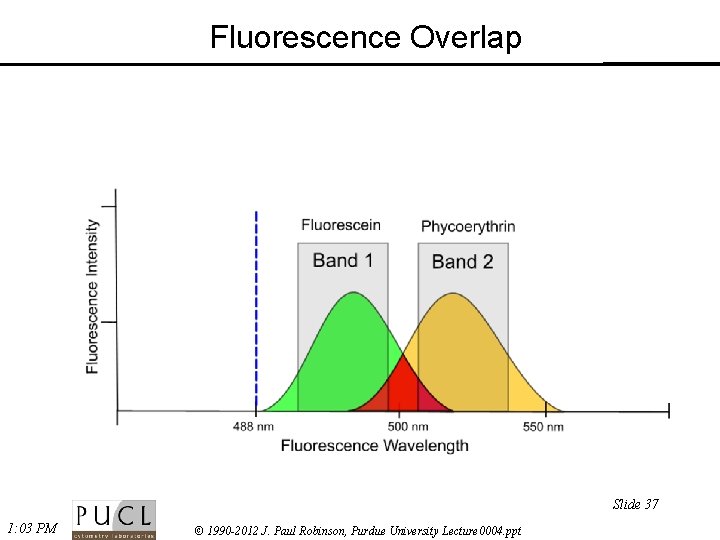
Fluorescence Overlap Slide 37 1: 03 PM © 1990 -2012 J. Paul Robinson, Purdue University Lecture 0004. ppt
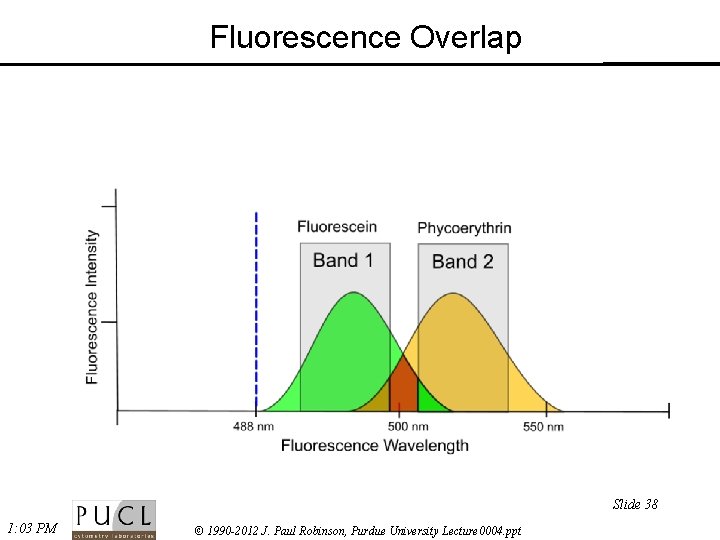
Fluorescence Overlap Slide 38 1: 03 PM © 1990 -2012 J. Paul Robinson, Purdue University Lecture 0004. ppt
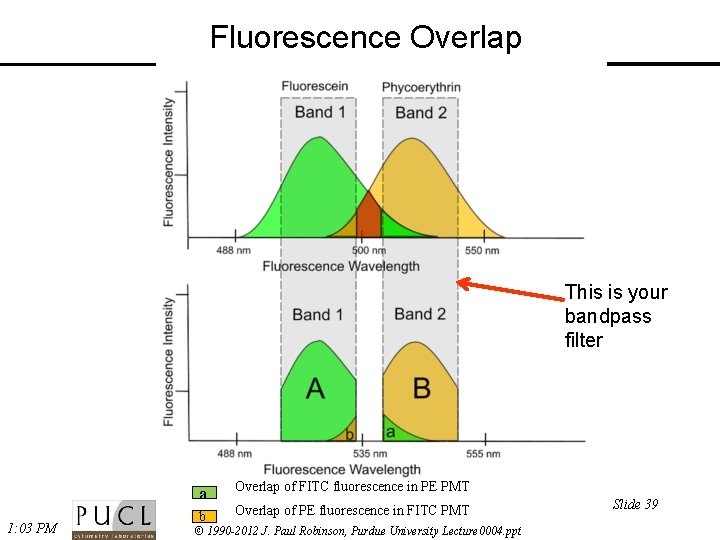
Fluorescence Overlap This is your bandpass filter 1: 03 PM a Overlap of FITC fluorescence in PE PMT b Overlap of PE fluorescence in FITC PMT © 1990 -2012 J. Paul Robinson, Purdue University Lecture 0004. ppt Slide 39
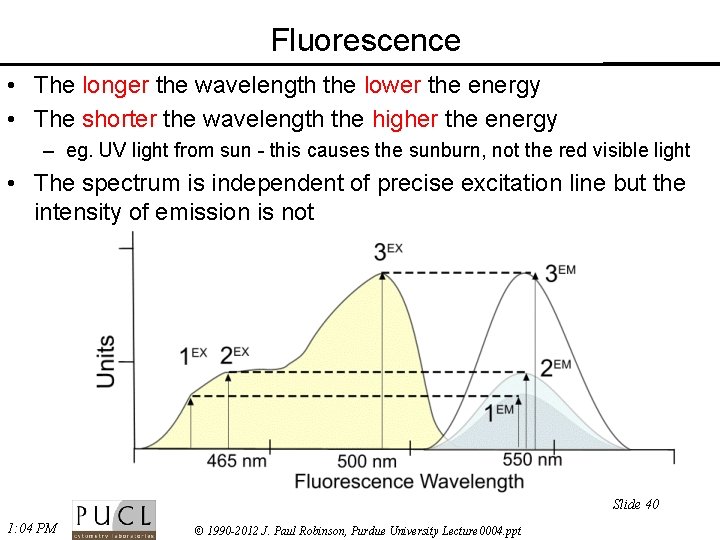
Fluorescence • The longer the wavelength the lower the energy • The shorter the wavelength the higher the energy – eg. UV light from sun - this causes the sunburn, not the red visible light • The spectrum is independent of precise excitation line but the intensity of emission is not Slide 40 1: 04 PM © 1990 -2012 J. Paul Robinson, Purdue University Lecture 0004. ppt
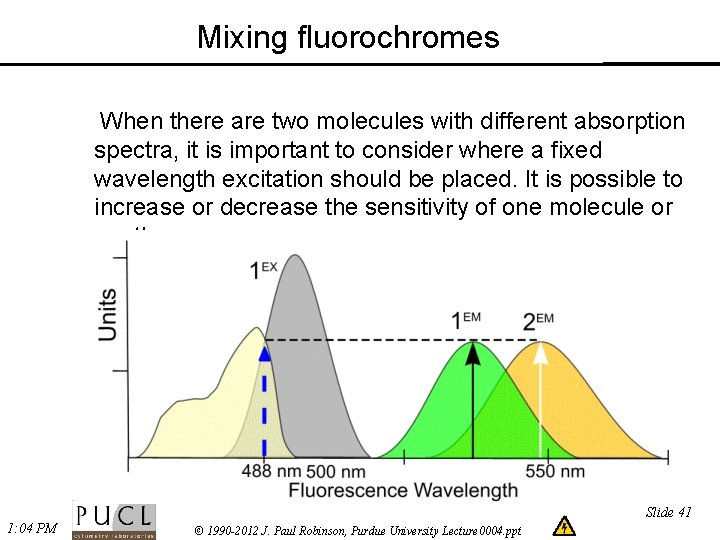
Mixing fluorochromes When there are two molecules with different absorption spectra, it is important to consider where a fixed wavelength excitation should be placed. It is possible to increase or decrease the sensitivity of one molecule or another. Slide 41 1: 04 PM © 1990 -2012 J. Paul Robinson, Purdue University Lecture 0004. ppt
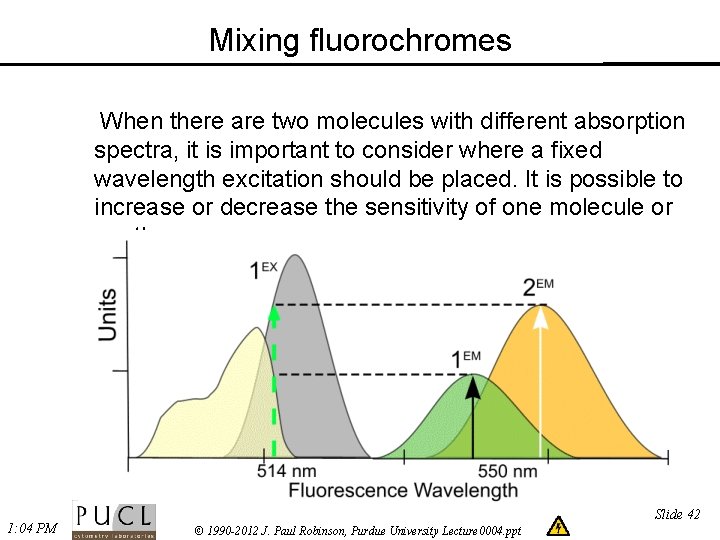
Mixing fluorochromes When there are two molecules with different absorption spectra, it is important to consider where a fixed wavelength excitation should be placed. It is possible to increase or decrease the sensitivity of one molecule or another. 1: 04 PM Slide 42 © 1990 -2012 J. Paul Robinson, Purdue University Lecture 0004. ppt
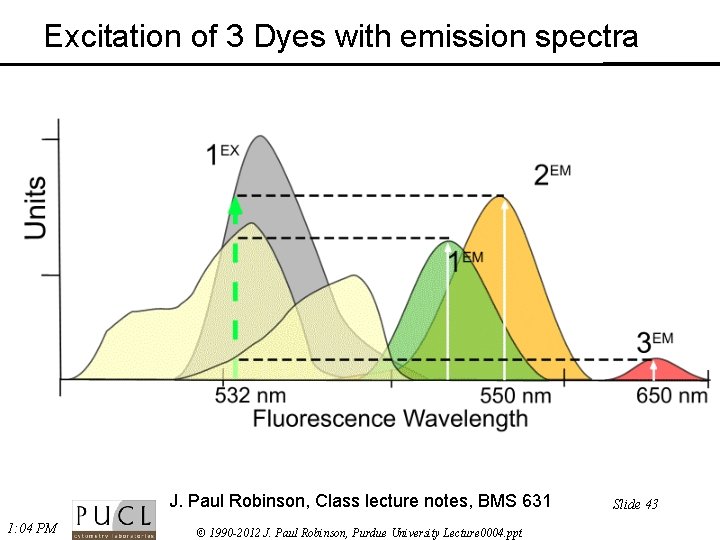
Excitation of 3 Dyes with emission spectra J. Paul Robinson, Class lecture notes, BMS 631 1: 04 PM © 1990 -2012 J. Paul Robinson, Purdue University Lecture 0004. ppt Slide 43
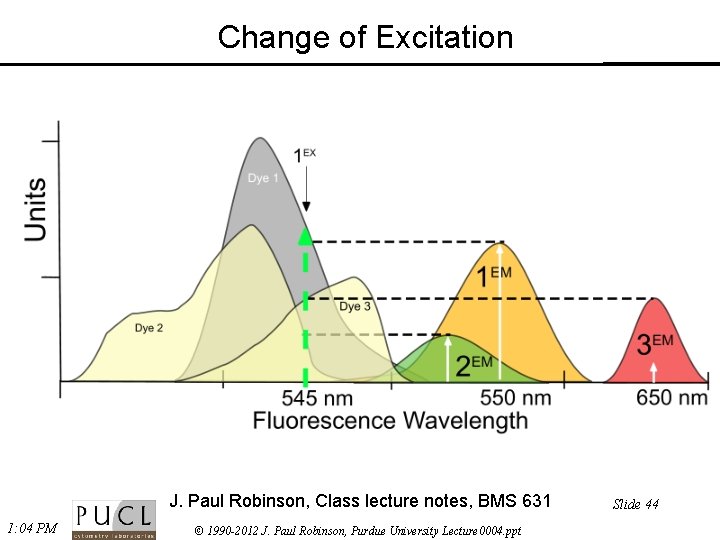
Change of Excitation J. Paul Robinson, Class lecture notes, BMS 631 1: 04 PM © 1990 -2012 J. Paul Robinson, Purdue University Lecture 0004. ppt Slide 44
Conclusions • Fluorescence is the primary energy source for confocal microscopes • Dye molecules must be close to, but below saturation levels for optimum emission • Fluorescence emission is longer than the exciting wavelength • The energy of the light increases with reduction of wavelength • Fluorescence probes must be appropriate for the excitation source and the sample of interest • Correct optical filters must be used for multiple color fluorescence emission Go to the web to download the lecture http: //tinyurl. com/2 dr 5 p © 1993 -2018 J. Paul Robinson - Purdue University Cytometry Laboratories Slide 45 /classes/BMS 524/524 lect 003. ppt
- Slides: 45