
BMFB 3263 Material Characterisation Scanning Electron Microscope SEM
BMFB 3263 Material Characterisation Scanning Electron Microscope (SEM) 1
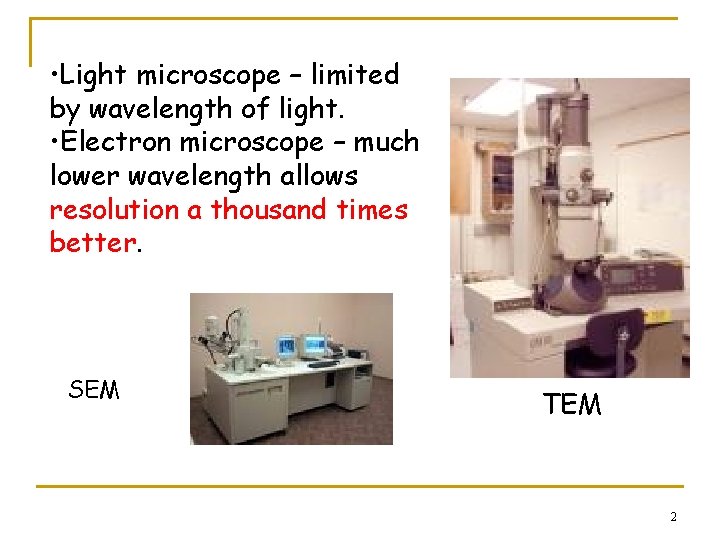
• Light microscope – limited by wavelength of light. • Electron microscope – much lower wavelength allows resolution a thousand times better. SEM TEM 2
Topic outcomes By the end of this topic, students should be able to n List down the differences between optical microscope and electron microscope n Acknowledge the importance of electron microscope for materials engineers and scientists n Describe most important parts of SEM, and their roles in obtaining high quality image n Explain typical sample preparation for metals, ceramic, polymers and films 3
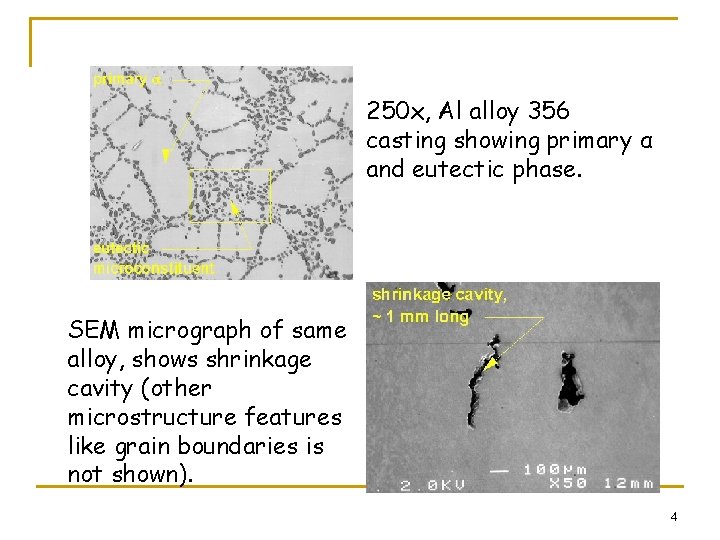
250 x, Al alloy 356 casting showing primary α and eutectic phase. SEM micrograph of same alloy, shows shrinkage cavity (other microstructure features like grain boundaries is not shown). 4
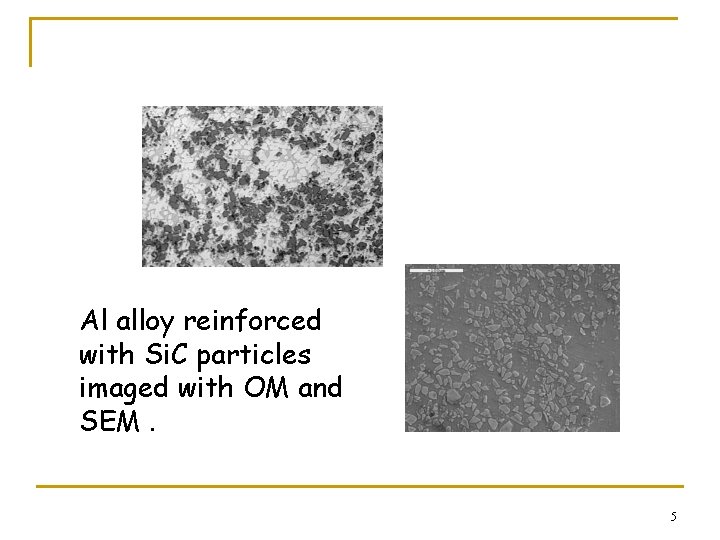
Al alloy reinforced with Si. C particles imaged with OM and SEM. 5
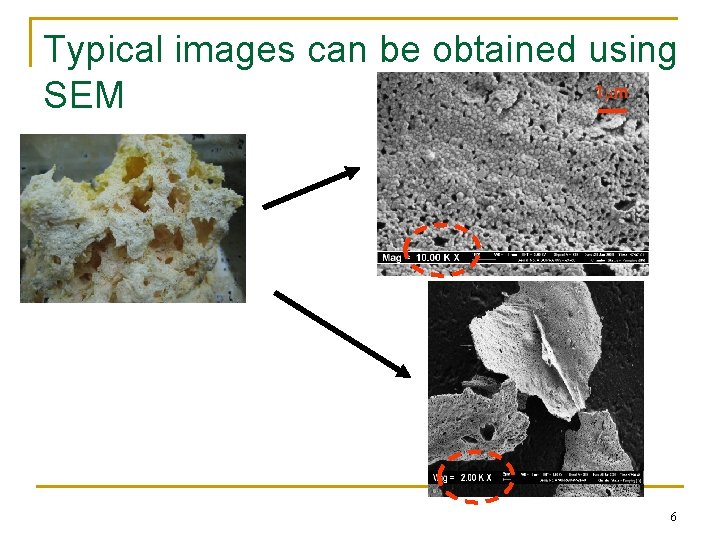
Typical images can be obtained using 1 m SEM 6
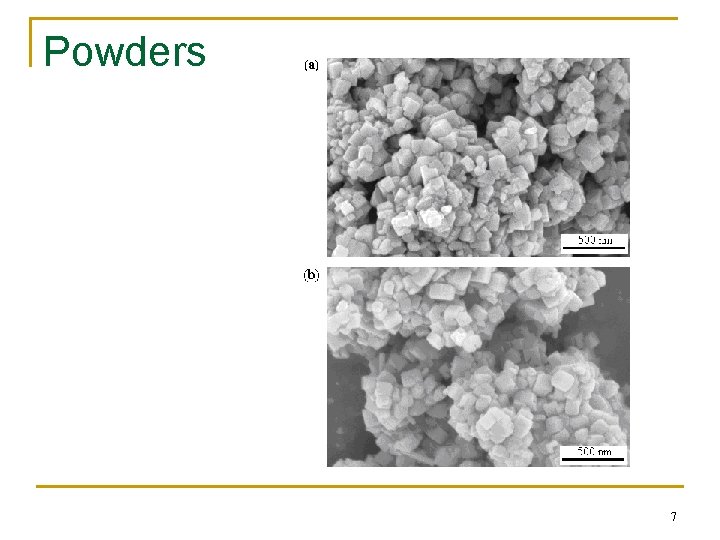
Powders 7
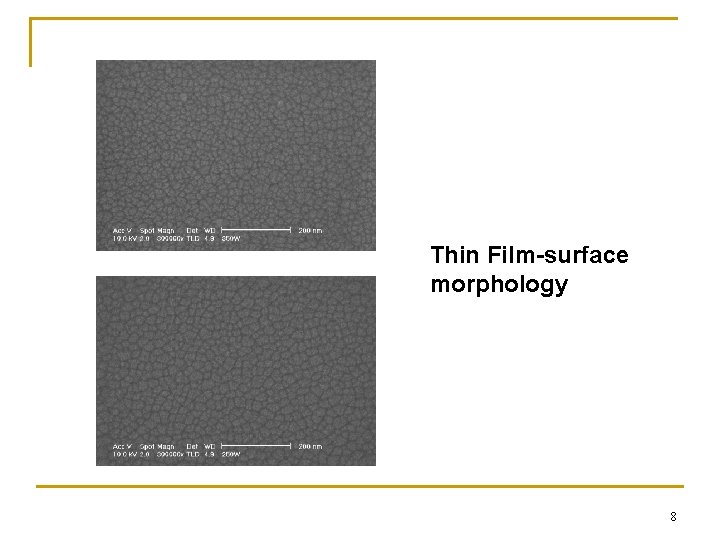
Thin Film-surface morphology 8
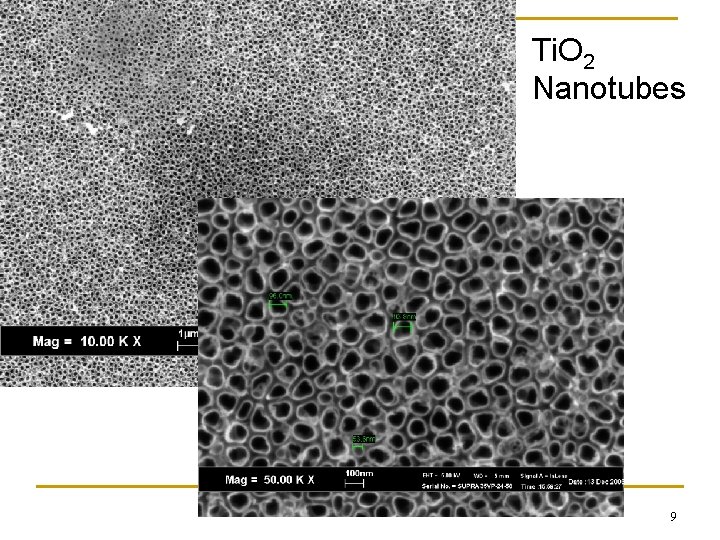
Ti. O 2 Nanotubes 9
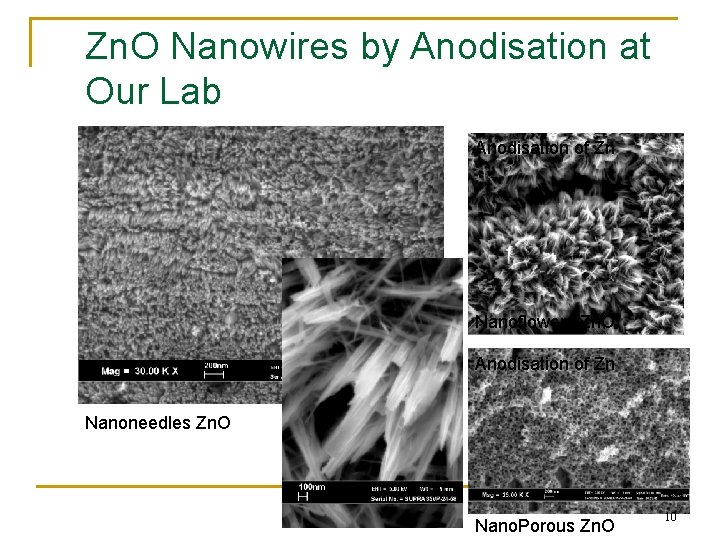
Zn. O Nanowires by Anodisation at Our Lab Anodisation of Zn Nanoflowers Zn. O Anodisation of Zn Nanoneedles Zn. O Nano. Porous Zn. O 10
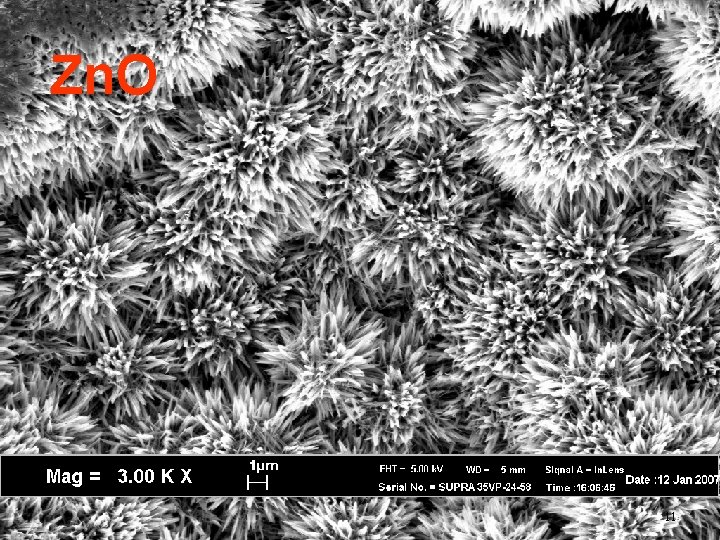
Zn. O 11
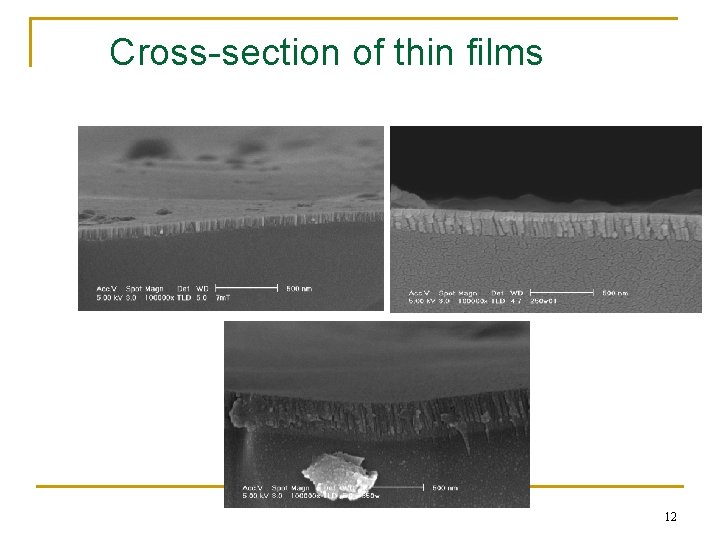
Cross-section of thin films 12

Optical microscope vs SEM n n n Magnification limit is a function of wavelength of visible light, 2000 Å. Wavelength of electrons < 0. 5 Å gives theoretical max magnification of 800, 000 x. Resolving power OM is limited by wavelength of light. In light microscope, quality of objective lens also plays major role in determining resolving power. Resolving power – ability to optically separate 2 objects. Limiting conditions for transmitting info using electromagnetic radiation – key parameter is ratio /d. 13
Electron Microscope n EM is developed because wavelength has an effective role on theoretical resolution. n Green light used for light microscope has wavelength of 0. 5 µm, & thus theoretical resolution of 0. 2 µm. Followed by blue, violet & ultraviolet. But ultraviolet is absorbed by glass. n X-ray ? Cannot be easily refracted to form image. Inability to focus the rays. n Electron – could easily be focused by magnetic field. De Broglie postulate ‘dual nature of electrons – particle & wave’. Also can be accelerated by electrical potential. 14
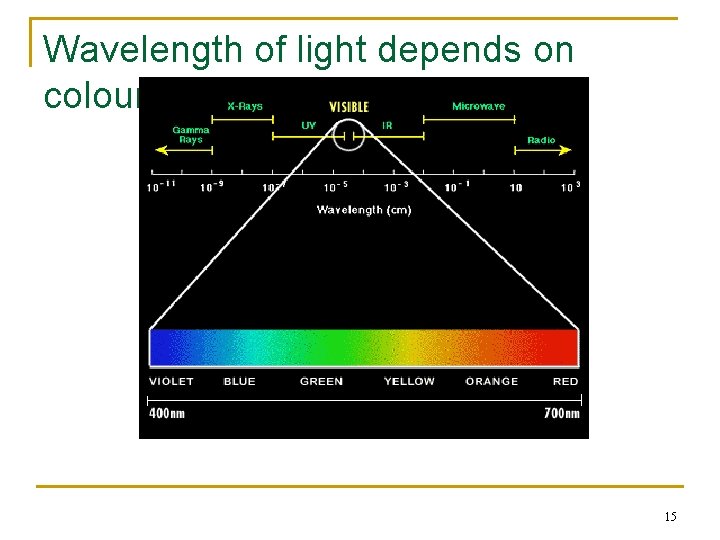
Wavelength of light depends on colours 15
Factors influence key parameters of performance for SEM 1. 2. 3. Depth of field Imaging noise Resolution 16
2 general types of SEM n Typical SEM q q n Samples must be dried before hand Must be coated with conductive coating e. g. gold, Pt Environmental SEM q q For biological samples Do not have to dry the samples 17
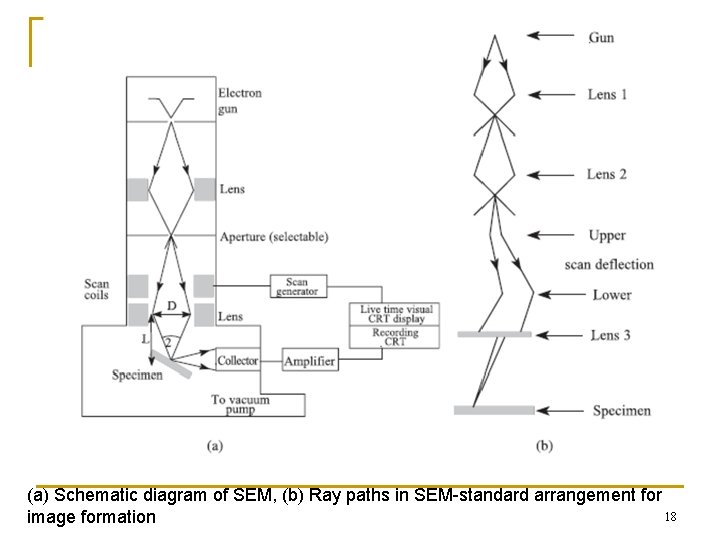
(a) Schematic diagram of SEM, (b) Ray paths in SEM-standard arrangement for 18 image formation
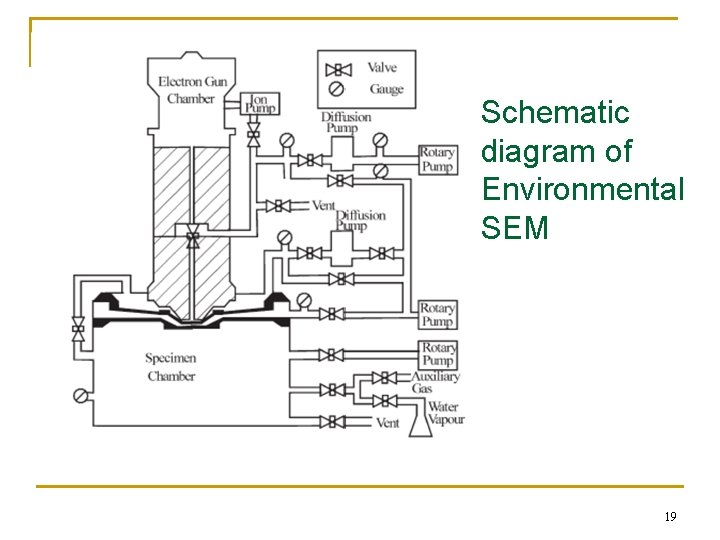
Schematic diagram of Environmental SEM 19
Electron Microscope n n Another limit of light m/scope is depth of field – distance from nearest to farthest part of subject that is in focus when picture is taken. Depth of field – ability to maintain focus across a field of view regardless of surface roughness. SEM can maintain 3 D appearance of textured surface. Advantage of electron m/scope – increase in depth of field and depth of focus. SEM also usually equipped with EDX or X – ray mapping to determine chemical composition at a particular spot. 20
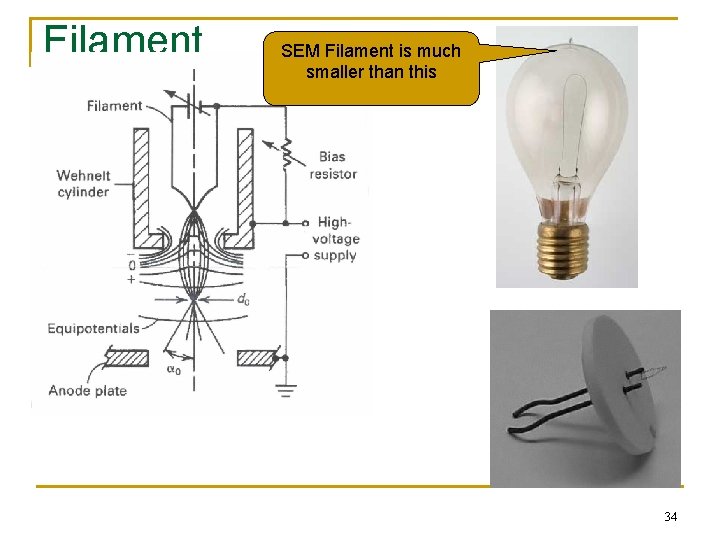
Electron Microscope – basic principle n n n Focusing is possible because of dual-nature of electrons. De-Broglie relationship : = h/mv where m – mass, v is velocity & h is Planck constant. Electrons are deflected by both electrostatic & magnetic fields and can be brought to a focus by engineering the field geometry. EM – virtual source of electrostatic field by anode & subsequent focus by electromagnetic lenses. Cathode filament generates electrons and accelerated by potential difference between anode & filament. Shield serves to collimate electrons & direct them. 21
Scanning Electron Microscope (SEM) n n Study topography of solid samples, resolution around 0. 3 µm to 0. 15 nm. A source of high energy electrons, condenser system and probe lens to focus the electron beam into fine probe that impinges on specimen. Image is obtained by scanning the electron probe over surface and collect image signal – display after suitable amplification and processing. Sample : electrically conductive, nonconductive materials require thin conductive coating to prevent electrical charging of the specimen. 22
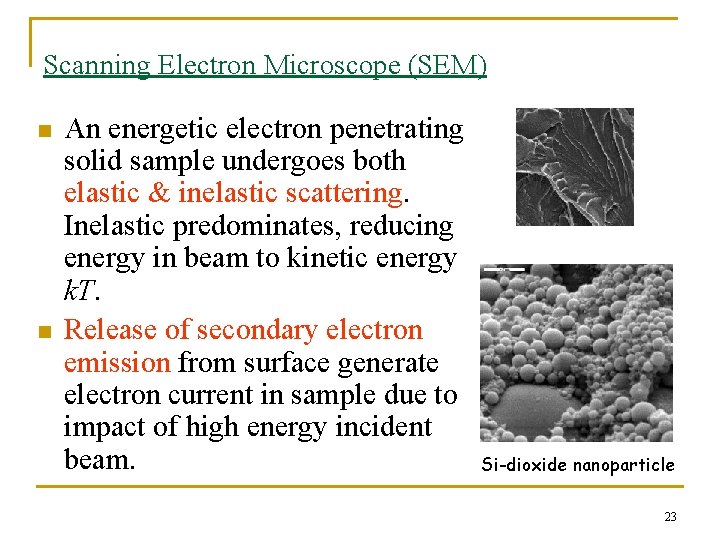
Scanning Electron Microscope (SEM) n n An energetic electron penetrating solid sample undergoes both elastic & inelastic scattering. Inelastic predominates, reducing energy in beam to kinetic energy k. T. Release of secondary electron emission from surface generate electron current in sample due to impact of high energy incident beam. Si-dioxide nanoparticle 23
Scanning Electron Microscope (SEM) n In SEM, q q n n a fine beam of electrons is scanned across surface of sample, a detector counts the number of low energy secondary electrons, or other radiation, emitted from each point of the surface. The brightness of each image pixel is modulated according to the output current of the detector for each point of surface and an image is build up in this way as the beam scans. Because secondary electrons come from near surface region, the brightness of signal depends on surface area that is exposed to the primary beam. 24
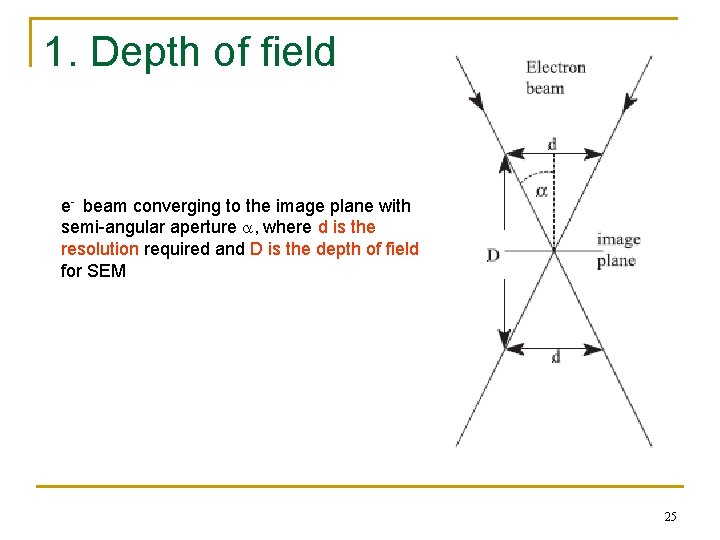
1. Depth of field e- beam converging to the image plane with semi-angular aperture , where d is the resolution required and D is the depth of field for SEM 25
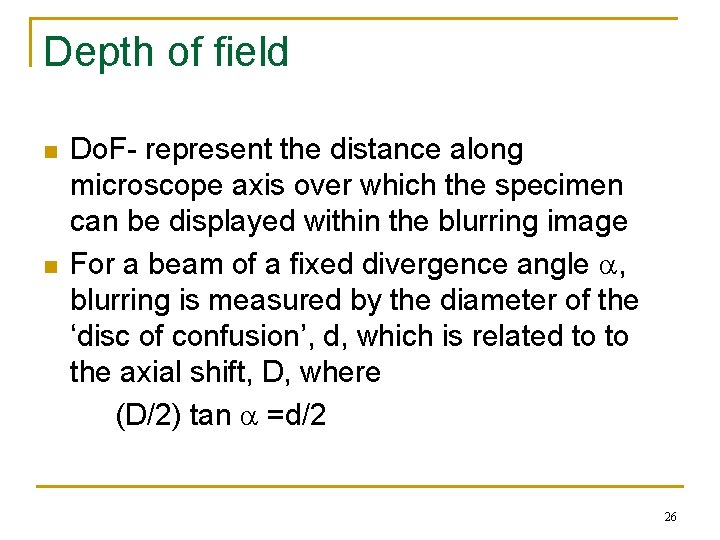
Depth of field n n Do. F- represent the distance along microscope axis over which the specimen can be displayed within the blurring image For a beam of a fixed divergence angle , blurring is measured by the diameter of the ‘disc of confusion’, d, which is related to to the axial shift, D, where (D/2) tan =d/2 26
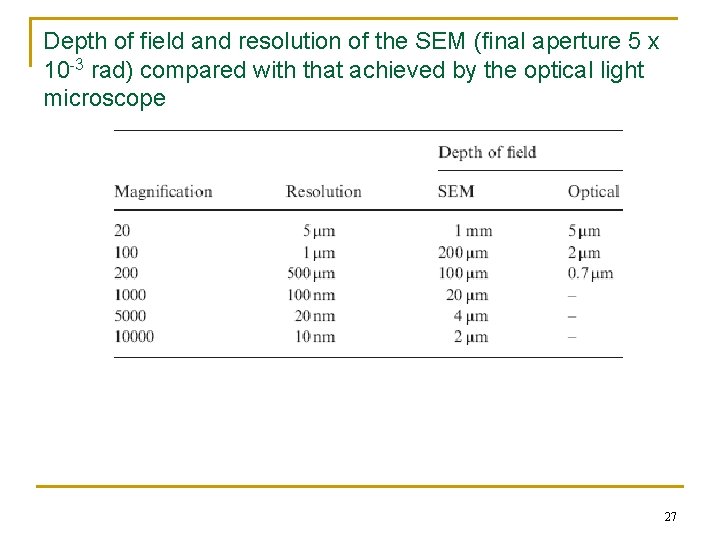
Depth of field and resolution of the SEM (final aperture 5 x 10 -3 rad) compared with that achieved by the optical light microscope 27
Noise n Noise within image present in all forms q n n Related to collecting efficiency of the imaging system Noise influences the resolution In SEM, resolution is improved if q q the signal is collected for longer periods of time Increase the contrast 28
Electron sources n In SEM, incident e- is focused on the specimen, q n n n but sometimes it is also scanned over the specimen Resolution is set by the diameter of incident beam and mode of operation Important thing: minimise energy spread within the electron beam, to minimise chromatic aberration Electron sources influence: q Brightness n Quality of image being obtained 29
Scanning Electron Microscope (SEM) n n n Electron beam source – tungsten or lanthanum hexaboride La. B 6 cathode filament. Alternative – via field emission (FE). Beam is focused by two successive condenser lenses into beam with very fine spot size (~ 5 nm). Condenser aperture – eliminate high angle electrons. Objective aperture – further eliminate high-angle electrons. Beam then passes thru objective lens where pairs of coils scan the beam in grid or raster fashion over rectangular area of surface. 30
Scanning Electron Microscope (SEM) n n n Beam diameter / spot size – one of the most important parameters, and it is controlled directly by operator electromagnetic probe lens or objective lens. Focus achieved by varying current passing thru objective lens. Charging - manifested as bright streaks or flashes across width of photograph, observed when spot size is excessively large. Results when specimen accumulates a net negative charge. Non-conductive samples examined at excessive accelerating voltage, contaminants particles or films. 31
Scanning Electron Microscope (SEM) n n n Reduce charging – coat with gold or carbon, connect to ground with conductive adhesive, clean properly. Inelastic collision (electron – electron) secondary electrons, X-ray, phonon (heat). Elastic collision (electron – nucleus) produce backscattered electrons (BSE). If mean atomic wt (Z) of specimen is low, e. g plastic, probability of backscattering event is lower than if Z is higher. So high-Z metal release greater number of BSE than low Z specimens. BSE imaging distinguish zones of different Z material. 32
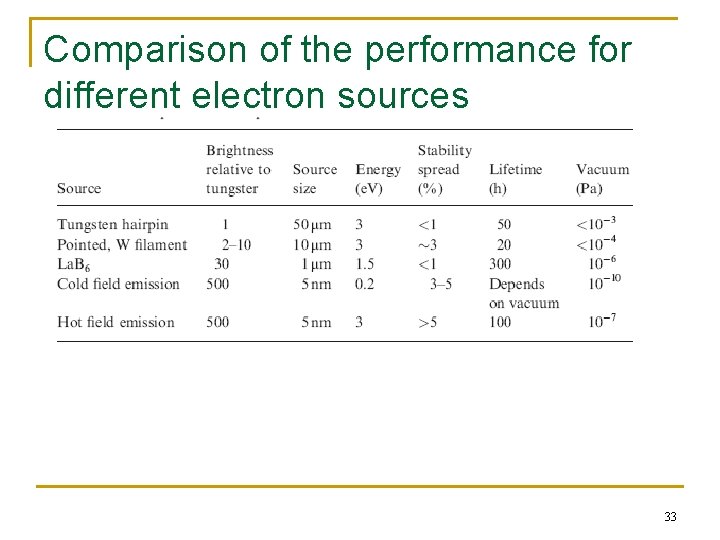
Comparison of the performance for different electron sources 33
Filament SEM Filament is much smaller than this 34
Resolution n n Resolution- critical parameters which governs the performance of a SEM Resolution is a balance between the effects of aberration of the final lenses and diffraction effects Most SEM has at least 5 nm resolution Ultra high resolution SEM: provide smallest diameter and brightest electron source combine with ability to the detect secondary the emitted secondary electrons with the highest efficiency 35
Imaging modes 3 main methods to collect emitted electron signals 1. Secondary electron 2. Backscattered electrons 3. Absorbed specimen current 36
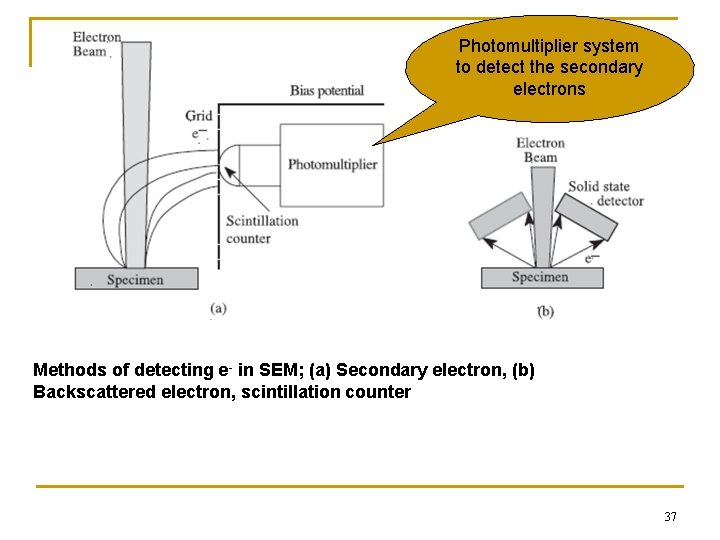
Photomultiplier system to detect the secondary electrons Methods of detecting e- in SEM; (a) Secondary electron, (b) Backscattered electron, scintillation counter 37
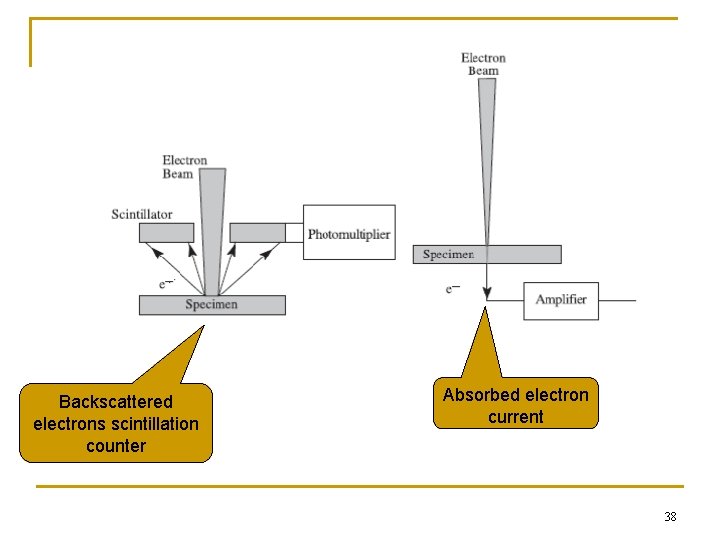
Backscattered electrons scintillation counter Absorbed electron current 38
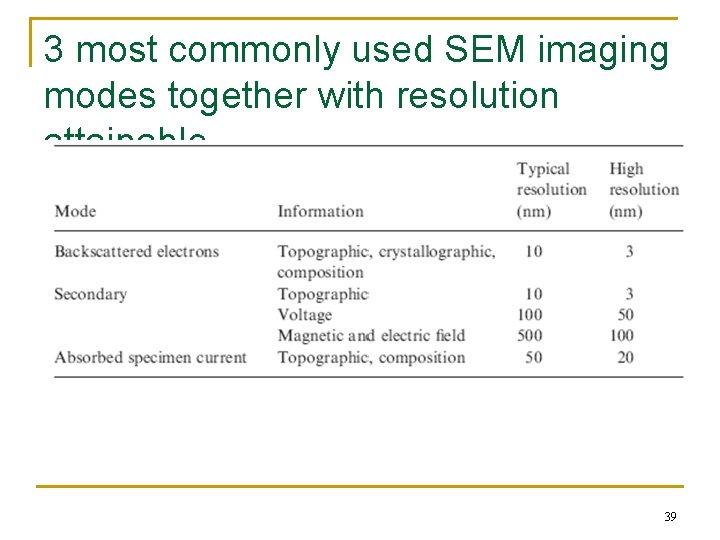
3 most commonly used SEM imaging modes together with resolution attainable 39
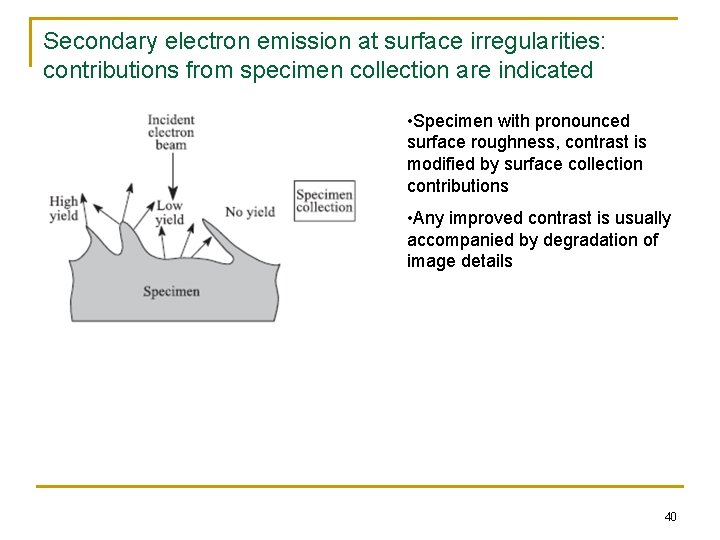
Secondary electron emission at surface irregularities: contributions from specimen collection are indicated • Specimen with pronounced surface roughness, contrast is modified by surface collection contributions • Any improved contrast is usually accompanied by degradation of image details 40
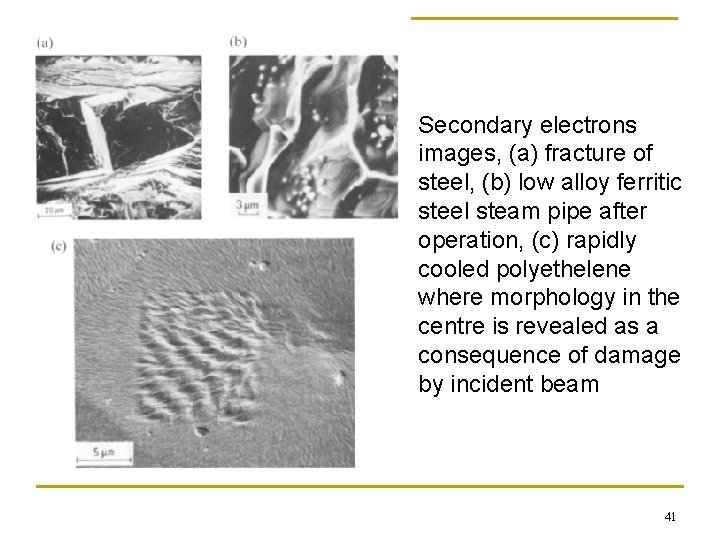
Secondary electrons images, (a) fracture of steel, (b) low alloy ferritic steel steam pipe after operation, (c) rapidly cooled polyethelene where morphology in the centre is revealed as a consequence of damage by incident beam 41
Scanning Electron Microscope (SEM) n n n Back-scattered electron detection gives rise to images presenting a compositional contrast (BSE yield being a function of atomic number). Different atomic number gives different contrast. As primary electron strike the surface they are inelastically scattered by atoms in sample. Interactions lead to emission electrons – detected to produce image. X-rays, which also produced by this interaction may also be detected in SEM equipped for Energy Dispersive X-ray Spectroscopy (EDX). 42
Scanning Electron Microscope (SEM) n Factors directly affect SE emission from surface : q q n n Work function of surface (energy supplied for electron to escape), depends on both composition & atomic packing. Beam energy & intensity. Density of sample (limited influence). Surface topography (most pronounced effect) or local curvature of surface. FE SEM – capable of nm resolutions at beam energies as low as 200 V, and give excellent contrast based on either atomic number or work function. Alternative imaging – cathodoluminescence & electron beam image current. 43
Scanning Electron Microscope (SEM) n n Working distance (WD) – distance separating surface from final pole piece. Short WD – decreases depth of field, raises lower limit of magnification, may reduce image clarity by interfering with SE collection, & may limit sample movement. Long WD – enhances Do. F, permits low mag, but also reduces image clarity coz electron signals have to travel farther for detection. Energy dispersive Spectroscopy (EDS) – detect X-rays emitted by specimen. 44
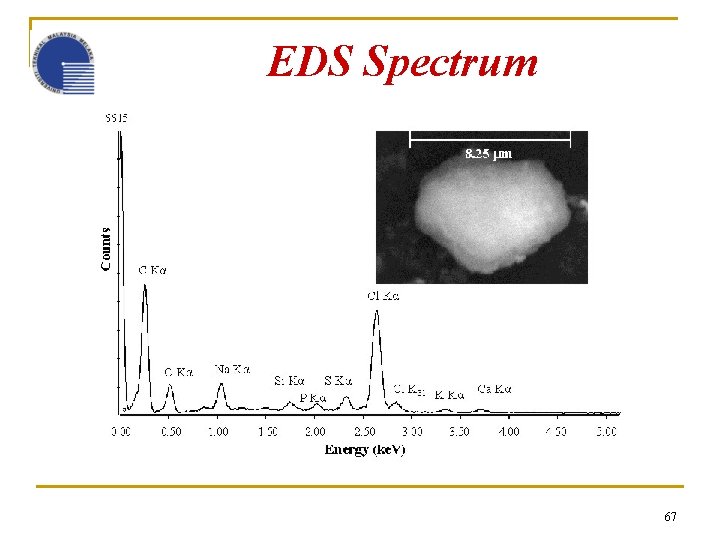
Scanning Electron Microscope (SEM) n n n Every elements has their own characteristic energy and wavelength pattern. Limitation not able to detect - light elements (C, N, O), specifically identify compounds or ionic state of detected element. But new tech able to detect light elements down to boron (Z = 5) for quantitative. X-ray signal mode of display : spectrum, line scan & X-ray dot image or elemental map. X-ray dot – characteristic photon recorded as white dot. 45
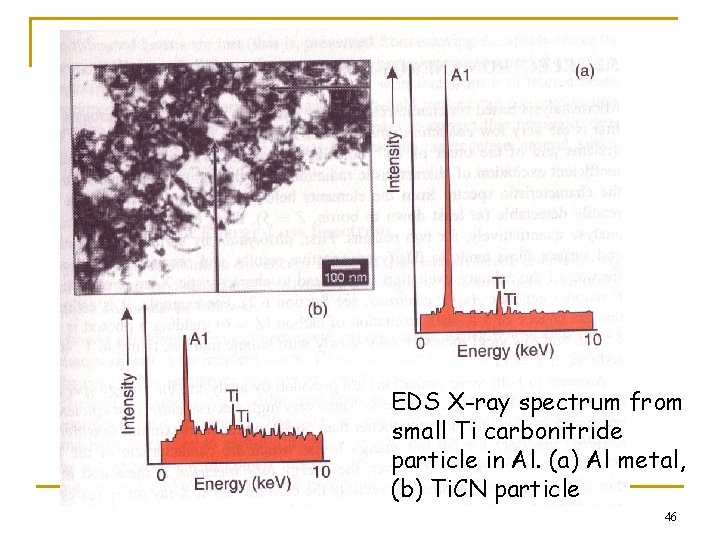
EDS X-ray spectrum from small Ti carbonitride particle in Al. (a) Al metal, (b) Ti. CN particle 46
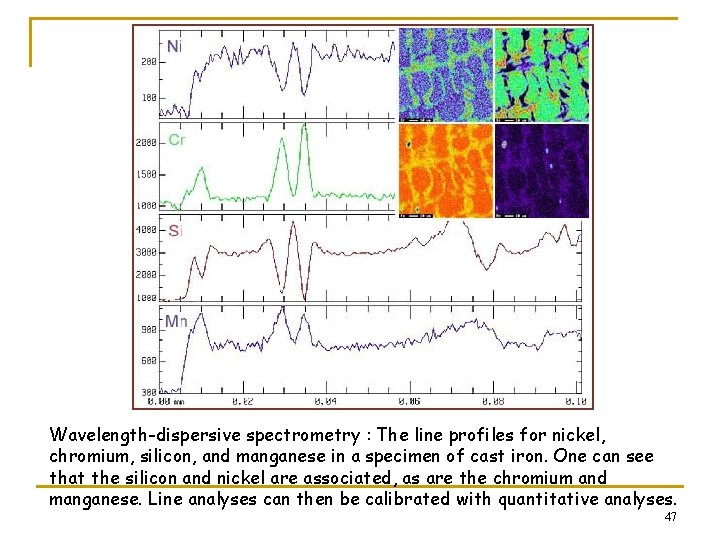
Wavelength-dispersive spectrometry : The line profiles for nickel, chromium, silicon, and manganese in a specimen of cast iron. One can see that the silicon and nickel are associated, as are the chromium and manganese. Line analyses can then be calibrated with quantitative analyses. 47
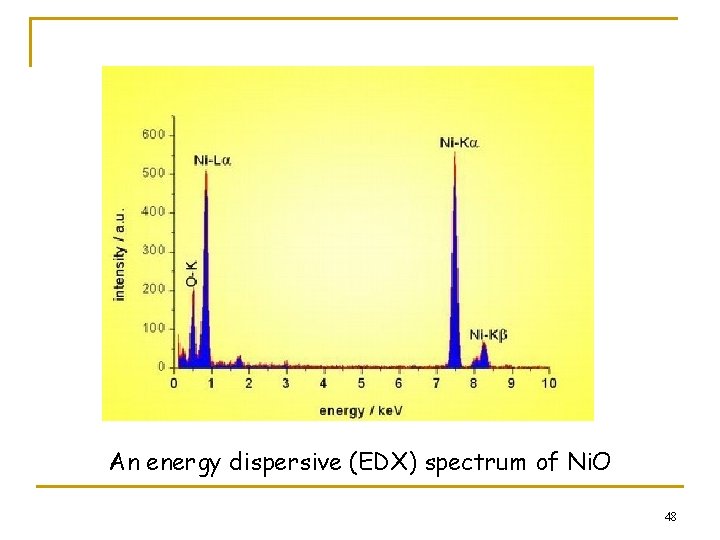
An energy dispersive (EDX) spectrum of Ni. O 48
Sample preparation n Surfaces of the bulks of metals, polymers, ceramics q n Cutting, etching or fracturing- depends on what kind of information we want to observe. Examples: q If we want to observe grains, grains boundaries, open pores structure: n Similar with sample preparation for optical microscope 49
Scanning Electron Microscope (SEM) n n n Sample preparation – electrostatic charging should be avoided. Coating – sputtering of heavy metal such as goldpalladium or carbon. Carbon is usually more desirable when EDS is used so as not to interfere with chemical analysis. Fractography and failure analysis – surface should NOT be damaged or altered in any way by any prior specimen preparation procedure. Spatial & orientational relationship to component must be known, images recorded over full range. 50
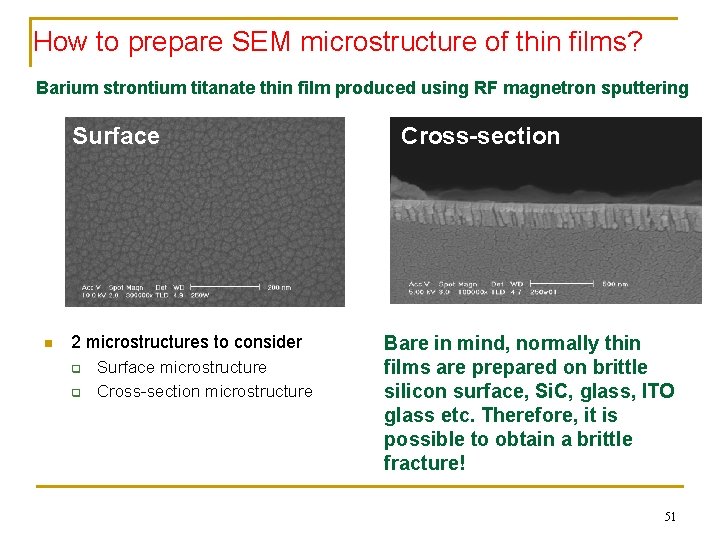
How to prepare SEM microstructure of thin films? Barium strontium titanate thin film produced using RF magnetron sputtering Surface n 2 microstructures to consider q q Surface microstructure Cross-section Bare in mind, normally thin films are prepared on brittle silicon surface, Si. C, glass, ITO glass etc. Therefore, it is possible to obtain a brittle fracture! 51
Surface microstructure of thin film n n Cut to the desired size Place it on sample holder Eliminate any dust or loose impurities e. g. using air gun For non-conductive sample: sputter a thin layer of conductive layer such as gold or platinum 52
Cross-section of thin film n 2 options to consider on how to prepare a brittle fracture q q Make a line of scratch on the sample Break the sample Froze the sample in liquid nitrogen Break the sample 53
What can you do if you have film on non-brittle substrate? ? n n n Cut the sample to the desired size Mount in resin for protection Polish the surface Almost impossible to get fractured information Can also try to peel off the film 54
Polymer samples n n Depends on what we want to know. For composites, worthwhile to soak in liquid nitrogen, and fracture the sample q q Observe distribution of matrix and reinforcement Wettability of the components 55
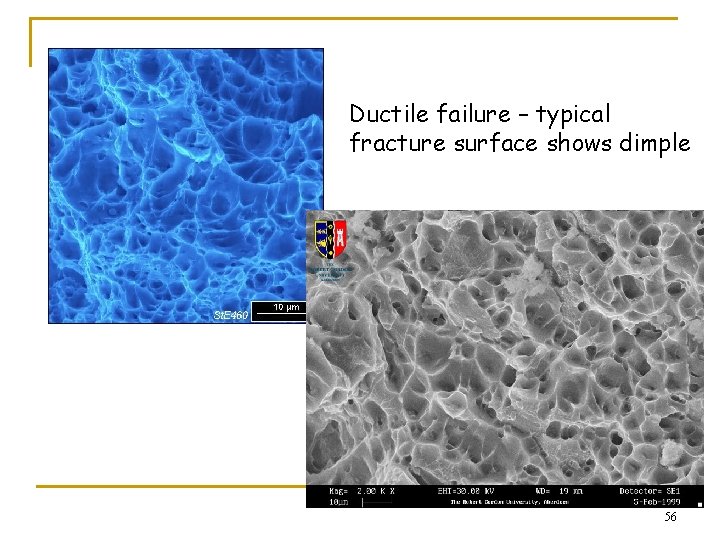
Ductile failure – typical fracture surface shows dimple 56
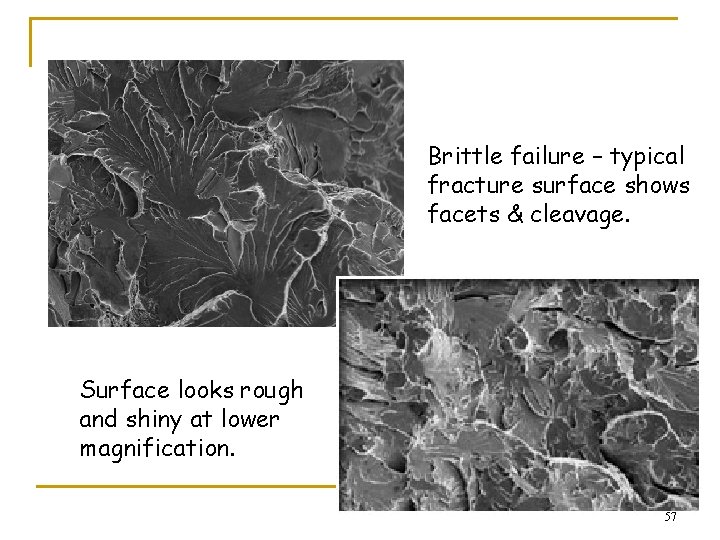
Brittle failure – typical fracture surface shows facets & cleavage. Surface looks rough and shiny at lower magnification. 57
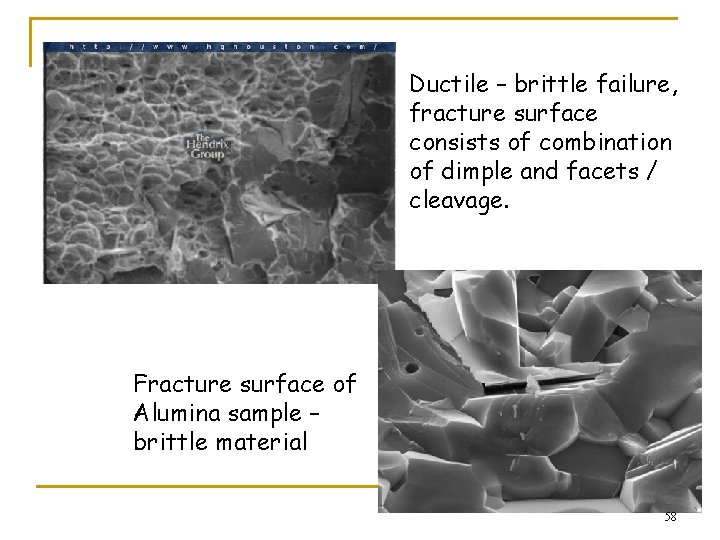
Ductile – brittle failure, fracture surface consists of combination of dimple and facets / cleavage. Fracture surface of Alumina sample – brittle material 58
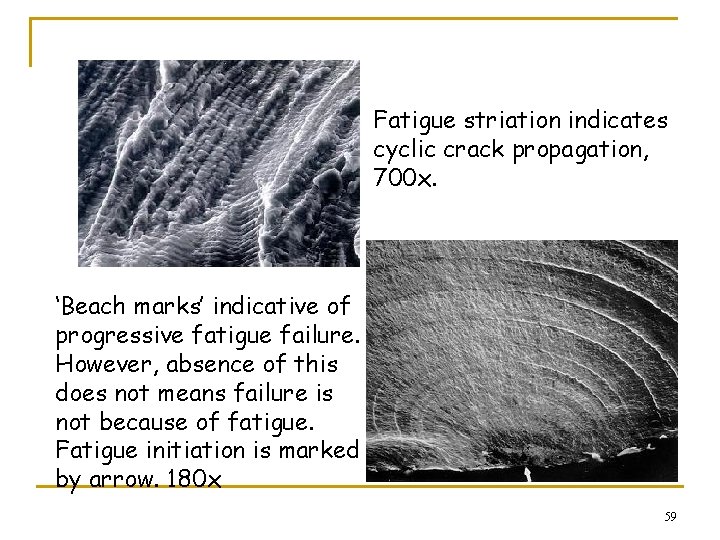
Fatigue striation indicates cyclic crack propagation, 700 x. ‘Beach marks’ indicative of progressive fatigue failure. However, absence of this does not means failure is not because of fatigue. Fatigue initiation is marked by arrow. 180 x 59
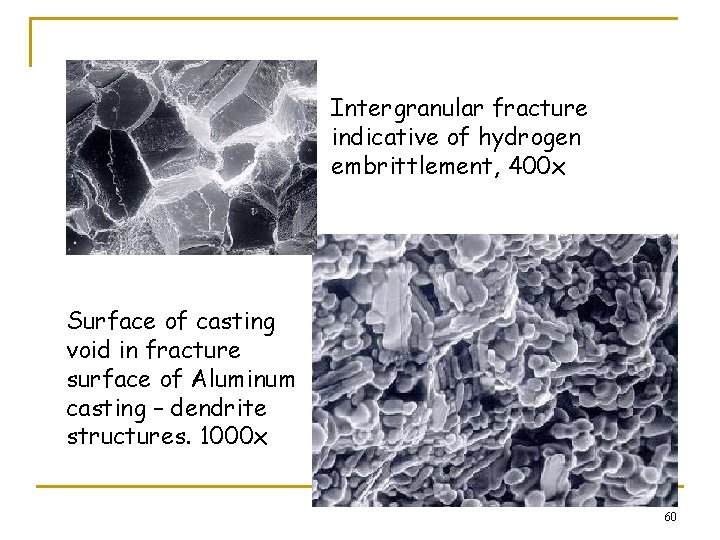
Intergranular fracture indicative of hydrogen embrittlement, 400 x Surface of casting void in fracture surface of Aluminum casting – dendrite structures. 1000 x 60
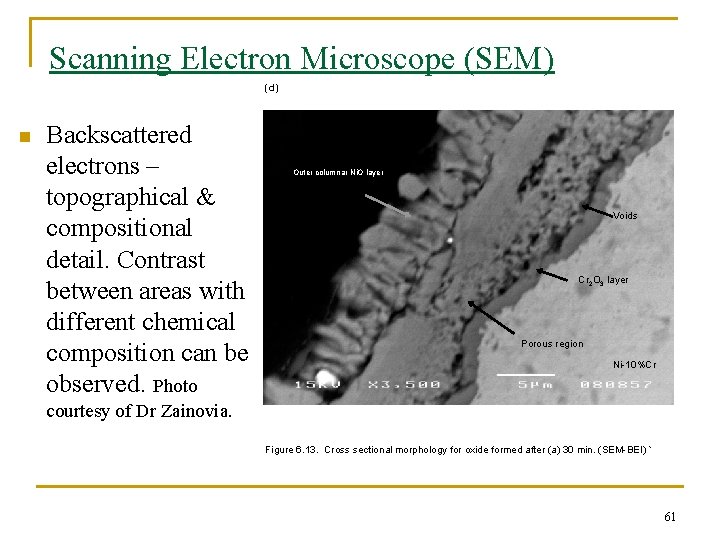
Scanning Electron Microscope (SEM) (d) n Backscattered electrons – topographical & compositional detail. Contrast between areas with different chemical composition can be observed. Photo Outer columnar Ni. O layer Voids Cr 2 O 3 layer Porous region Ni-10%Cr courtesy of Dr Zainovia. Figure 6. 13. Cross sectional morphology for oxide formed after (a) 30 min. (SEM-BEI) ` 61
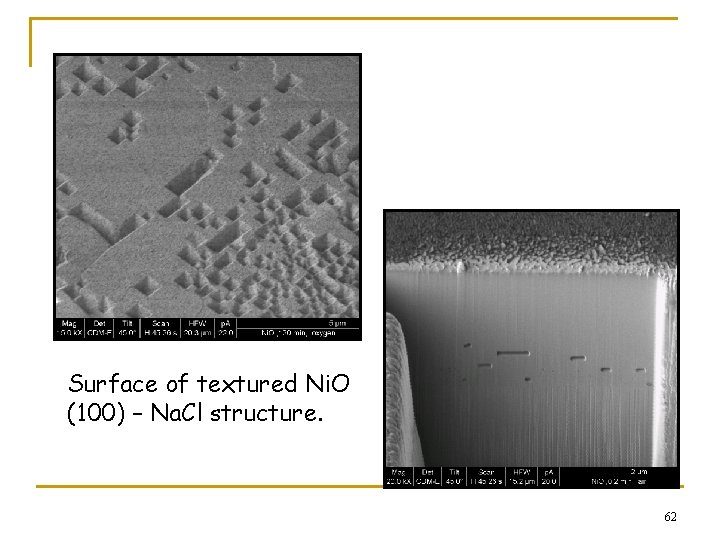
Surface of textured Ni. O (100) – Na. Cl structure. 62
Electron Microscope - limitation n n Electrons are high energy particle which will easily be affected by any matter they encounter. When they do, interaction results in emission of all the lower forms of energy – X-rays, secondary electrons, ultraviolet, heat, etc. Therefore, electrons cannot penetrate very deeply. Cannot even pass thru air. Microscope has to be kept in high vacuum. Specimens always dead. Also require proper preparation to get good image. 63
Energy Dispersive X-Ray Spectroscopy v Energy dispersive X-ray spectroscopy (EDS or EDX) is an analytical technique used for the elemental analysis or chemical characterization of a sample. v As a type of spectroscopy, it relies on the investigation of a sample through interactions between electromagnetic radiation and matter, analyzing x-rays emitted by the matter in response to being hit with the electromagnetic radiation. v EDS systems are most commonly found on scanning electron microscopes (SEM -EDX). 64
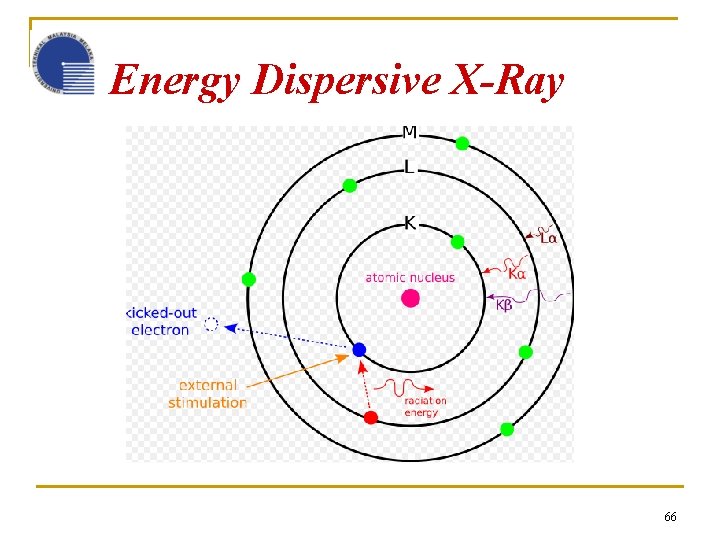
Energy Dispersive X-Ray Spectroscopy Its characterization capabilities are due in large part to the fundamental principle that each element has a unique atomic structure allowing x-rays that are characteristic of an element's atomic structure to be identified uniquely from each other. The incident beam may excite an electron in an inner shell, ejecting it from the shell while creating an electron hole where the electron was. An electron from an outer, higher-energy shell then fills the hole, and the difference in energy between the higher-energy shell and the lower energy shell is released in the form of an x-ray. The x-ray released by the electron is then detected analyzed by the energy dispersive spectrometer. These x-rays are characteristic of the difference in energy between the two shells, and of the atomic structure of the element form which they were emitted. 65
Energy Dispersive X-Ray 66
EDS Spectrum 67
- Slides: 67