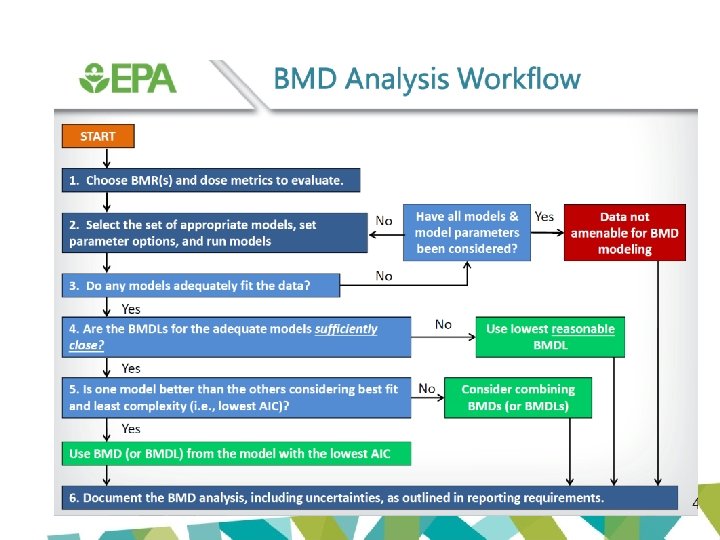
BMD case study 3 MCPD 3 MCPD Esters

BMD case study: 3 MCPD & 3 -MCPD Esters Dr Stuart Creton

Outline • • 3 -MCPD & 3 -MCPD esters JECFA & EFSA BMD comparison US EPA approach New EFSA approach

What’s the issue? • 3 -MCPD and 3 -MCPD Esters • Recent reviews by EFSA (2016) and JECFA (2017) • Performed BMD modelling using exact same models and exact same data BUT… – EFSA TDI: – JECFA PMTDI: 0. 8 µg/kg bw/day 4 µg/kg bw/day
 Below EFSA")
Implications EFSA maximum estimates of chronic exposure Age class Exposure (µg/kg bw/day) Below EFSA TDI (0. 8 µg/kg bw/day)? Below JECFA PMTDI (4 µg/kg bw/day)? Infants 2. 5 Infants receiving formula only 3. 2 Toddlers 2. 4 Other children 2. 6 Adolescents 1. 3 Adults 0. 9 Elderly 0. 8 • Which is right? • Should we be worried – or not?

3 -MCPD AND 3 -MCPD ESTERS

3 -MCPD • 3 -monochloropropane-1, 2 -diol • First identified in hydrolysed vegetable protein • Formed during hydrochloric acid hydrolysis • Also found in soya sauce, cereal products • GMP – significant reduction in contamination

3 -MCPD Esters • Presence overlooked until ~ 2004 • Found in a range of foods • Formed from acylglycerols in presence of chlorinated compounds during high temperature deodorisation of crude oils & fats • Oil concentrations: rapeseed < soya bean < sunflower < safflower < walnut < palm

Foods contributing to exposure • Infants – Infant and follow-on formulae – Vegetable fats & oils – Cookies • Adults – Margarine & similar – Pastries & cakes – Vegetable fats & oils – Bread & bread rolls – Fried or roast meat EFSA 2016

ADME – 3 -MCPD • Rapidly absorbed & widely distributed • Crosses blood-testis and blood-brain barriers • Two major routes of metabolism identified – Conjugation with glutathione – 2, 3 dihydroxypropyl mercapturic acid – Oxidation to β-chlorolactic acid & oxalic acid • Urinary excretion predominates

ADME – 3 -MCPD Esters • Hydrolysed to 3 -MCPD in GI tract • Similar AUCs after oral administration equimolar doses 3 -MCPD & 3 -MCPD dipalmitate • Cmax: 5 X lower for 3 -MCPD dipalmitate • JECFA: complete hydrolysis assumed

3 -MCPD toxicity • • Kidney toxicity Kidney tumours in rats Not genotoxic in vivo Testicular effects & impaired male fertility

3 -MCPD renal toxicity • 2 long-term drinking water studies in rats – Sunahara et al 1993 (Fischer 344 rats) – Cho et al 2008 (Sprague-Dawley rats) • Renal tubular hyperplasia • Chronic progressive nephropathy • Renal tubule adenomas & carcinomas
 Males 0 (0. 15) 1. 1")
Sunahara et al 1993 Lesion Dose (mg/kg bw/day) Males 0 (0. 15) 1. 1 5. 2 28 Nephropathy 36/50 40/50 45/50* 49/50** Tubule hyperplasia 3/50 6/50 15/50** 34/50*** Tubule adenoma 0/50 1/50 5/50 * p < 0. 05; ** p < 0. 01; *** p < 0. 001 JECFA: LOAEL 1. 1 mg/kg bw/day
 Males 0 1. 97 8. 27")
Cho et al 2008 Lesion Dose (mg/kg bw/day) Males 0 1. 97 8. 27 29. 5 Nephropathy 15/50 27/50* 39/50* 36/50* Tubule hyperplasia 1/50 11/50* 21/50* 36/50* Tubule adenoma 0/50 4/50 Tubule carcinoma 0/50 5/50* Tubule adenoma or carcinoma 0/50 1/50 7/50* * p < 0. 05 JECFA: LOAEL 1. 97 mg/kg bw/day

Hazard characterisation • Most sensitive endpoint: renal tubular hyperplasia – Distinct from chronic progressive nephropathy – Precursor to tubule neoplasia • Basis for JECFA and EFSA TDIs

Toxicity of 3 -MCPD esters • Same effects as 3 -MCPD • Similar or lower equimolar doses Effect 3 -MCPD (µmol/kg bw/day) 3 -MCPD dipalmitate (µmol/kg bw/day) BMDL 10 BMD 10 Ratios (moles/kg) BMDL 10 BMD 10 Kidney tubule changes (male) 22. 6 50. 7 29. 4 69. 4 1. 4 Proteinuria (male) 24. 4 57. 9 31. 6 79. 4 1. 4 Testis 54. 3 76. 0 74. 8 108. 7 1. 4 RBC 5% loss (female) 23. 5 40. 7 152. 6 315. 7 7. 8 Mortality (female) 66. 9 < 270 4. 0 EFSA 2016 20. 8

Toxicity of 3 -MCPD Esters • • • Substantial hydrolysis in GI tract Similar oral bioavailability Similar toxicity profile Elicit toxicity as free 3 -MCPD HBGVs apply to 3 -MCPD and 3 -MCPD esters (expressed as MCPD equivalents)

JECFA and EFSA evaluations • Based on same data set • BMD modelling to derive POD – same models • Lowest ‘appropriate’ BMDL 10 for renal tubular hyperplasia – Cho et al 2008 (LOAEL: 1. 97 mg/kg bw/day) – JECFA: 0. 87 mg/kg bw/day – EFSA: 0. 077 mg/kg bw/day

• Exact same data and exact same models BUT… • JECFA BMDL 10: 0. 87 mg/kg bw/day Uncertainty factor: 200 (inadequacies in repro studies) PMTDI: 0. 004 mg/kg bw/day or 4 µg/kg bw/day Uncertainty factor: 100 TDI: 0. 0008 mg/kg bw/day or 0. 8 µg/kg bw/day • EFSA BMDL 10: 0. 077 mg/kg bw/day
 Below EFSA")
Implications EFSA maximum estimates of chronic exposure Age class Exposure (µg/kg bw/day) Below EFSA TDI (0. 8 µg/kg bw/day)? Below JECFA PMTDI (4 µg/kg bw/day)? Infants 2. 5 Infants receiving formula only 3. 2 Toddlers 2. 4 Other children 2. 6 Adolescents 1. 3 Adults 0. 9 Elderly 0. 8

Why the difference? JECFA EFSA US EPA BMDS v 2. 6. 1 US EPA BMDS v 2. 6. 0. 86 Renal tubule hyperplasia Restricted models only (used unrestricted models & model averaging for comparison) Restricted and unrestricted models Acceptable fit criteria: Goodness of fit p-value > 0. 1 Acceptable fit criteria: Goodness of fit p-value > 0. 05 (Sunahara et al & Cho et al) Only one restricted model accepted: Range of models accepted – lowest log-logistic model BMDL 10 selected Lowest BMDLs from Cho et al Model providing critical BMDL 10: Restricted log-logistic model Model providing critical BMDL 10: Unrestricted gamma model

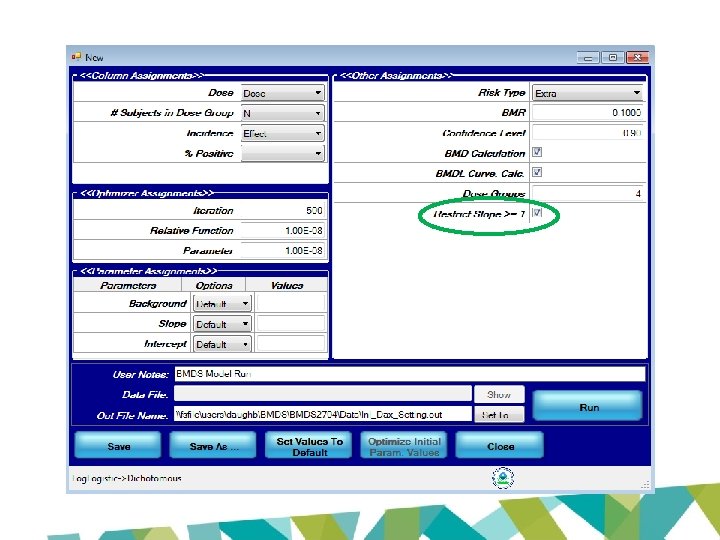
Why the difference? • Key issue: restriction • Option to constrain slope or power parameter to ≥ 1 • Avoids supralinearity – prevents slope of dose-response curve becoming infinite in region close to dose = 0
 10% BMR 5%")
15% BMR 10% BMR 5% BMR JECFA 83 rd report (2017) 10% BMR 5% BMR

JECFA approach • Use restricted models – avoids supralinearity but can result in poorer fit • Unrestricted models – may avoid statistical pitfalls – BUT implausible BMDLs may result • Model averaging – often less sensitive to supralinear effects – more reliable statistically – BUT no current JECFA guidance – use as adjunct

JECFA approach – 3 -MCPD • Restricted models – Log-logistic only model with acceptable fit (p > 0. 1) – BMD 10: 1. 21; BMDL 10: 0. 87 • Unrestricted models – used for comparison – Estimated BMDL 10 at unrealistically low doses

Unrealistic BMDLs with unrestricted models? • Extra risk at lowest dose in Cho study (1. 97 mg/kg bw/day): 20. 4% • BMDLs with unrestricted models for 10% extra risk: 0. 07 – 0. 27 mg/kg bw/day – So ~ 50% of the extra risk seen at 1. 97 mg/kg bw/day would be seen at 0. 07 – 0. 27 mg/kg bw/day • Realistic?

Matthew Wheeler & Angelika Tritscher, WHO

JECFA approach – 3 -MCPD • Restricted models – Log-logistic only model with acceptable fit (p > 0. 1) – BMD 10: 1. 21; BMDL 10: 0. 87 • Model averaging – used for comparison – BMD 10: 1. 29; BMDL 10: 0. 89

EFSA view on restriction • Not discussed in 3 -MCPD opinion • New guidance 2017 – Contradicted by real dose response data

Slope appears infinite Large range of doses with virtually no effect EFSA BMD guidance (2017)
 • Restriction on steepness parameter inappropriate – May lead to artificially")
EFSA approach (2017) • Restriction on steepness parameter inappropriate – May lead to artificially high BMDLs • Practical consequence – may get much lower BMDLs

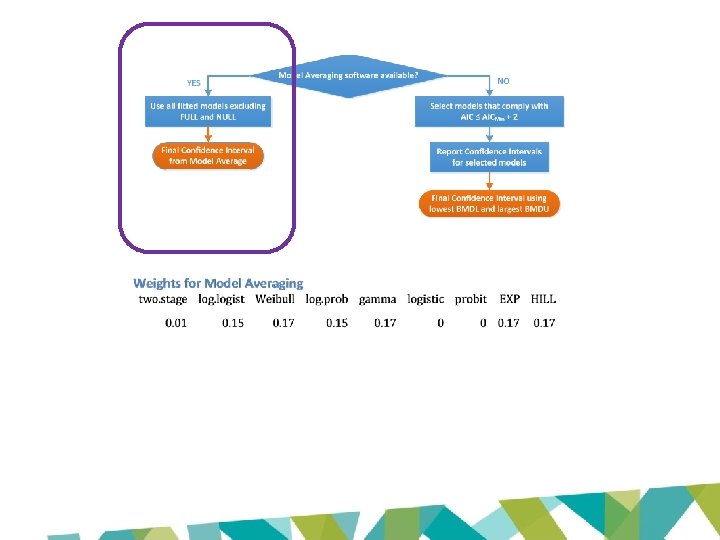
What’s next? • EFSA: divergence a result of differences in application of the BMD approach • New EFSA BMD guidance published January 2017 – New criteria – Model averaging software released • Reassess using revised guidance

COMPARISON – US EPA AND NEW EFSA APPROACH

γ = ‘background’; α = ‘intercept’ or ‘power term; β = ‘slope’

US EPA APPROACH

US EPA BMDS approach • Default: restrict slope/power ≥ 1 for most models – Use of restrictions under ongoing debate by US EPA statistical working group

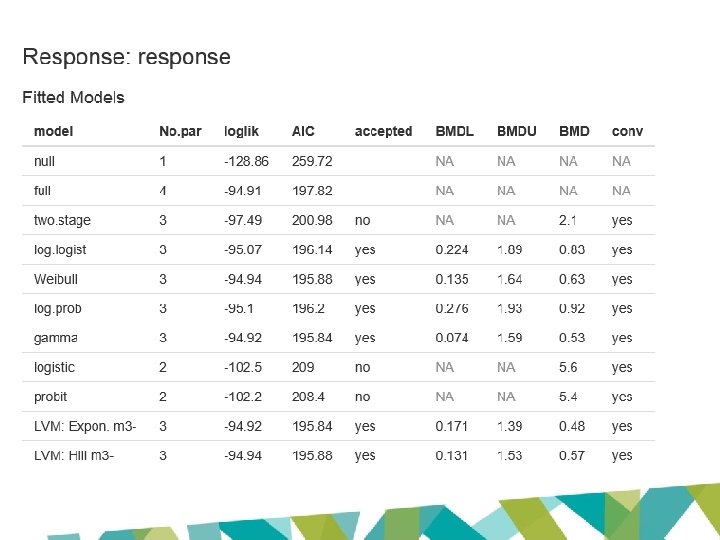
3 -MCPD US EPA BMDS output Model P-value AIC BMD 10 BMDL 10 Two Stage 0. 0733 198. 987 2. 14 1. 66 Log-logistic 0. 6103 194. 764 1. 21 0. 94 Weibull 0. 0733 198. 987 2. 14 1. 75 Log-probit 0. 5357 196. 203 0. 92 0. 39 Gamma 0. 0733 198. 987 2. 14 1. 75 Probit 0. 0028 208. 403 5. 36 4. 65 Logistic 0. 0023 208. 992 5. 62 4. 81

Global goodness of fit: p > 0. 1 Model P-value AIC BMD 10 BMDL 10 Two Stage 0. 0733 198. 987 2. 14 1. 66 Log-logistic 0. 6103 194. 764 1. 21 0. 94 0. 0733 198. 987 2. 14 1. 75 0. 5357 196. 203 0. 92 0. 39 0. 0733 198. 987 2. 14 1. 75 0. 0028 208. 403 5. 36 4. 65 0. 0023 208. 992 5. 62 4. 81 Weibull Local fit: Scaled Log-probit residuals all < Gamma 2 / > -2 Probit Logistic

US EPA: Model generally Two Stage should not be Log-logistic > 3 -fold Weibull 0. 39 x 3 = 1. 17 P-value AIC BMD 10 BMDL 10 0. 0733 198. 987 2. 14 1. 66 0. 6103 194. 764 1. 21 0. 94 0. 0733 198. 987 2. 14 1. 75 Log-probit 0. 5357 196. 203 0. 92 0. 39 Gamma 0. 0733 198. 987 2. 14 1. 75 Probit 0. 0028 208. 403 5. 36 4. 65 Logistic 0. 0023 208. 992 5. 62 4. 81

Model P-value AIC BMD 10 BMDL 10 Two Stage 0. 0733 198. 987 2. 14 1. 66 Log-logistic 0. 6103 194. 764 1. 21 0. 94 Weibull 0. 0733 198. 987 2. 14 1. 75 Log-probit 0. 5357 196. 203 0. 92 0. 39 Gamma 0. 0733 198. 987 2. 14 1. 75 Probit 0. 0028 208. 403 5. 36 4. 65 Logistic 0. 0023 208. 992 5. 62 4. 81 JECFA BMD 10 1. 21 BMDL 10 0. 87 EFSA BMD 10 0. 54 BMDL 10 0. 077
 APPROACH")
EFSA (2017) APPROACH

https: //efsa. openanalytics. eu/app/bmd

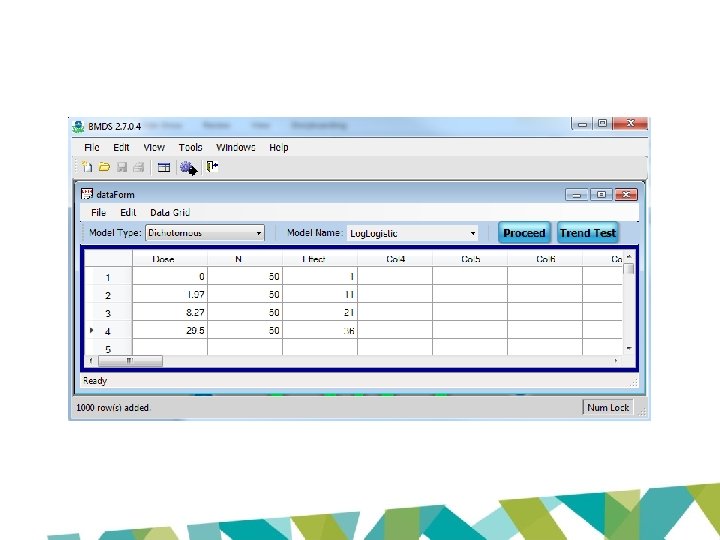
Data format • Option 1: Data with column headers – Line 1: one-word title for each column – Line 2 onwards: the data table • Option 2: Extended Proast data set – Line 1: one-word title, used in plots (no minus signs or spaces allowed) – Line 2: the number of columns of the data matrix – Line 3: a code for the data type in that particular column, choose between • • • 0: Non-response 1: Continuous response 2: Binary response 3: Ordinal response 4: Quantal response And more… – Line 4: one-word title for each column (no minus signs or spaces allowed) – Line 5 onwards: the data table

Data format - Proast 3. MCPD. reduced 4 0 0 4 0 dose sex response group. size 0 1 1 50 1. 97 1 11 50 8. 27 1 21 50 29. 5 1 36 50

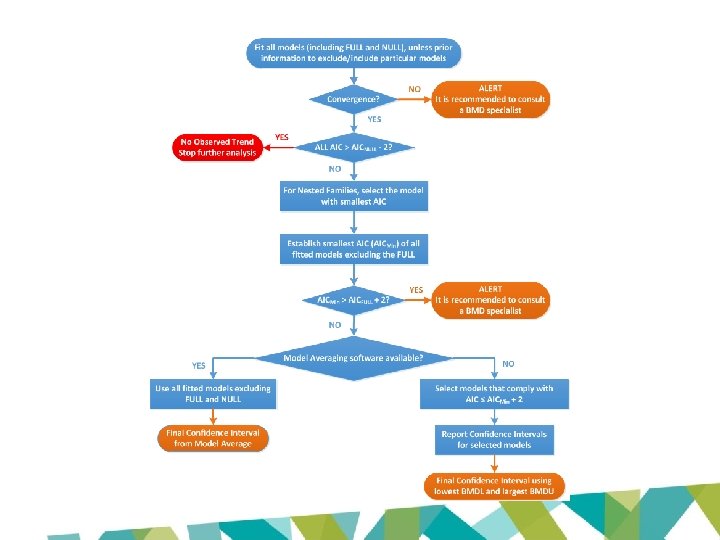
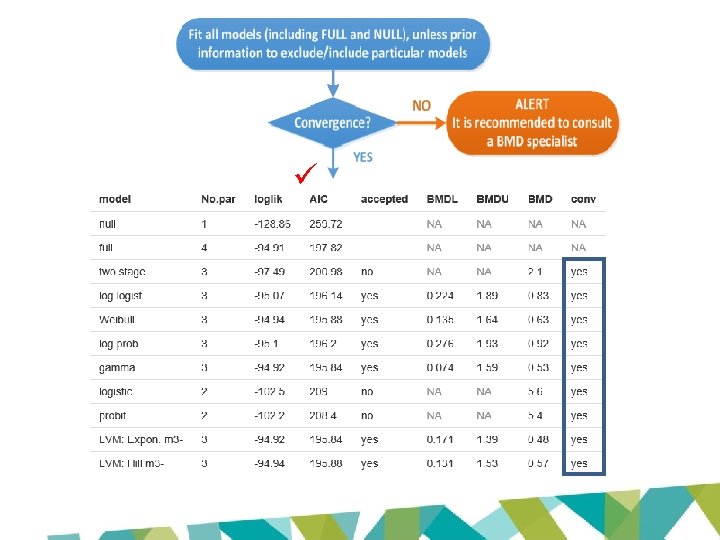

AICNULL – 2 = 257. 72

Not applicable for quantal models in EFSA software AICFULL + 2 = 199. 82

AICMin + 2 = 197. 84

Confidence interval between lowest BMDL and largest BMDU • 0. 074 – 1. 93 mg/kg bw/day
: 0. 077 mg/kg bw/day BMDL 10 (JECFA 2017): 0. 87")
BMDL 10 (EFSA 2016): 0. 077 mg/kg bw/day BMDL 10 (JECFA 2017): 0. 87 mg/kg bw/day

ALTERNATIVE APPROACH: NOAEL/LOAEL

NOAEL/LOAEL approach • NOAEL not available for 3 -MCPD kidney toxicity • LOAELs for renal tubule hyperplasia – Cho et al: 1. 97 mg/kg bw/day – Sunahara et al: 1. 1 mg/kg bw/day • JECFA (2001) – LOAEL: – UF: – PMTDI: 1. 1 mg/kg bw/day 500 2 µg/kg bw/day • Standard approach – UF: – HBGV: 1000 1 µg/kg bw/day

OVERVIEW OF VALUES
 Uncertainty factor HBGV")
Summary of values Approach Basis BMD 10 BMDL 10 (mg/kg bw/day) Uncertainty factor HBGV (µg/kg bw/day) EFSA 2016 Restricted & unrestricted models 0. 54 0. 077 100 0. 8 JECFA 2017 Restricted models 1. 21 0. 87 200 4 JECFA 2001 LOAEL N/A LOAEL: 1. 1 500 2 US EPA approach Mostly restricted 1. 21 models 0. 94 100 9 New EFSA approach Model averaging 0. 66 0. 4 100 4 New EFSA approach Lowest accepted 0. 53 BMDL 0. 074 100 0. 7

A question… • Is modelling the Cho et al data appropriate? – 20. 6% extra risk at lowest dose (1. 97 mg/kg bw/day) – BMR – 10% extra risk – Outside range of observed data

Sunahara et al more appropriate? – 6. 4% extra risk at lowest dose (1. 1 mg/kg bw/day) • JECFA (2017) – Accepted model BMD 10: 1. 64; BMDL 10: 1. 08 – Model average BMD 10: 2. 47; BMDL 10: 1. 74 • Cho values: 1. 21 & 0. 87 (average 1. 29 & 0. 89) • EFSA (2016) – Lowest values BMD 10: 1. 2; BMDL 10: 0. 22 • Cho values: 0. 54 & 0. 077

Summary • Large dependence on model and model restrictions • How far below experimental range is appropriate? • Need for more transparency on model assumptions/parameters • Better visualization (e. g. of upper confidence limits) would be helpful

Summary • Collaboration between statisticians & toxicologists important • Model averaging may be a better option • More work needed to understand what’s what • International harmonization needed

Copyright © Food Standards Australia New Zealand 2017 This work is copyright. You may download, display, print and reproduce this material in unaltered form only (retaining this notice) for your personal, non-commercial use or use within your organisation. Apart from any other use as permitted under the Copyright Act 1968, all other rights are reserved. Requests for further authorisation should be directed to information@foodstandards. gov. au www. foodstandards. gov. au or www. foodstandards. govt. nz /Food. Standards @FSANZnews
")
Supralinearity JECFA 83 rd report (2017)

Global goodness of fit • p-value – Measures how model-predicted dose-group probability of responses differ from the actual responses – Small values indicate poor fit – Recommended value for acceptance: p > 0. 1

Local fit • Global goodness of fit p-values don’t address local fit – Models may consistently miss the data • E. g. always on one side of the dose group means – Models may fit the wrong part of the doseresponse curve (i. e. high dose region) • Scaled residuals measure fit of the data at each dose – 0 = exact fit – Question values > 2 or < -2 – Pay attention to scaled residuals near BMR

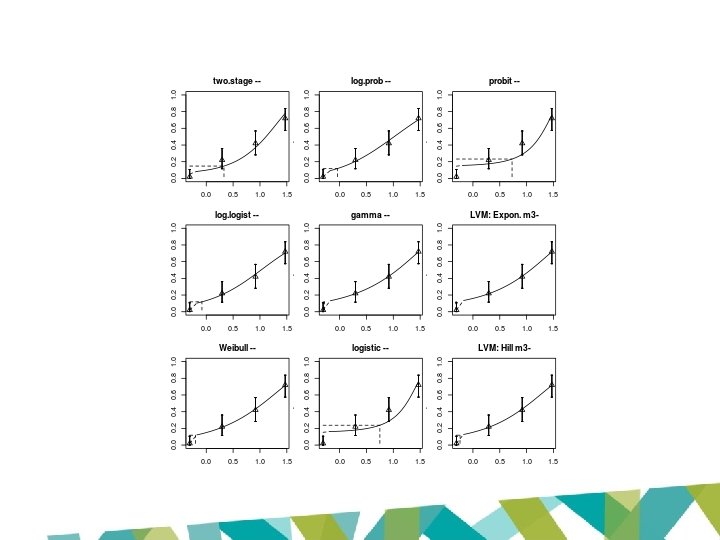
Visual inspection US EPA 2017
 Input Data File: //fsfile/users/daughb/BMDS 2704/Data/lnl_Dax_Setting. (d)")
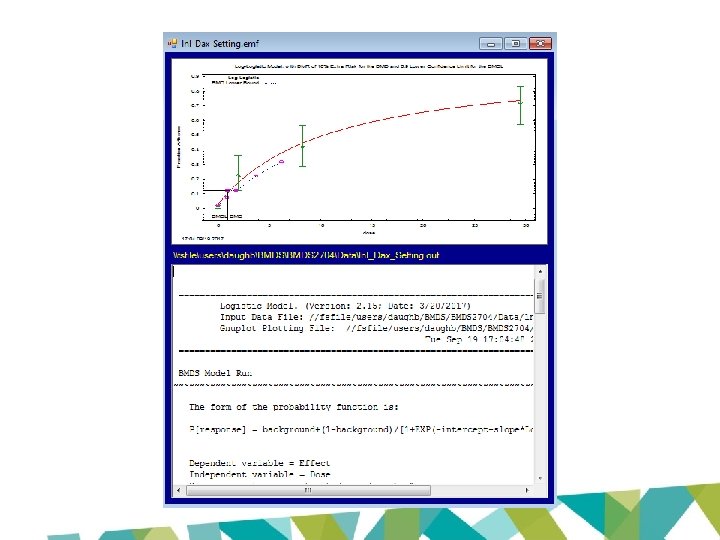
================================== Logistic Model. (Version: 2. 15; Date: 3/20/2017) Input Data File: //fsfile/users/daughb/BMDS 2704/Data/lnl_Dax_Setting. (d) Gnuplot Plotting File: //fsfile/users/daughb/BMDS 2704/Data/lnl_Dax_Setting. plt Tue Sep 19 17: 04: 48 2017 ================================== BMDS_Model_Run ~~~~~~~~~~~~~~~~~~~~~~~~~~~~~~~~~~~ The form of the probability function is: P[response] = background+(1 -background)/[1+EXP(-intercept-slope*Log(dose))] Dependent variable = Effect Independent variable = Dose Slope parameter is restricted as slope >= 1 Total number of observations = 4 Total number of records with missing values = 0 Maximum number of iterations = 500 Relative Function Convergence has been set to: 1 e-008 Parameter Convergence has been set to: 1 e-008
 -94.")
Analysis of Deviance Table Model Full model Fitted model Reduced model AIC: Log(likelihood) -94. 9096 -95. 3818 -128. 859 # Param's 4 2 1 Deviance 0. 944378 67. 8993 Test d. f. 2 3 P-value 0. 6236 <. 0001 194. 764 Goodness of Fit Scaled Dose Est. _Prob. Expected Observed Size Residual ------------------------------------0. 0000 0. 0246 1. 231 1. 000 50. 000 -0. 211 1. 9700 0. 1737 8. 687 11. 000 50. 000 0. 863 8. 2700 0. 4451 22. 254 21. 000 50. 000 -0. 357 29. 5000 0. 7366 36. 829 36. 000 50. 000 -0. 266 Chi^2 = 0. 99 d. f. = 2 P-value = 0. 6103

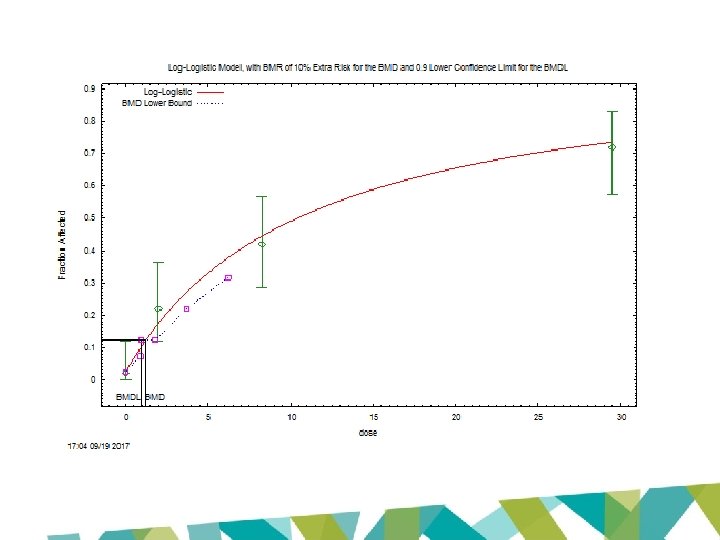
Benchmark Dose Computation Specified effect = Risk Type = 0. 1 Extra risk Confidence level = 0. 9 BMD = 1. 21277 BMDL = 0. 935022 BMDU = 1. 76763
- Slides: 79