Bladder Cancer Immunotherapy Progress and Current Limitations Donald

Bladder Cancer Immunotherapy: Progress and Current Limitations Donald L. Lamm, MD, FACS Bladder Cancer, Genitourinary Oncology Phoenix, AZ Hebrew University of Jerusalem Yissum Technology Transfer Tel Aviv, September 27, 2005 www. BCGOncology. com

Bladder Cancer Statistics, 2005 • New Cases: 63, 210 s Men: 47, 010; #4 Women: 16, 200 #8 • Estimated Deaths: 13, 180 s Men: 8, 970; #9 Women: 4, 210 • Incidence/Mortality: 20. 8% s Men: 19% Women: 26% • Prevalence: More than 600, 000 in US

Bladder Cancer, 2005 • Peak Onset: 6 th to 8 th decades • Men/women: 3 to 1 • Twice as common in white men compared with • • African American men Genetic mutations: genes on chromosome 9 including p 16. Invasion p 53, Rb, p 21. H 19: 84% Screening: hematuria detection reduces mortality

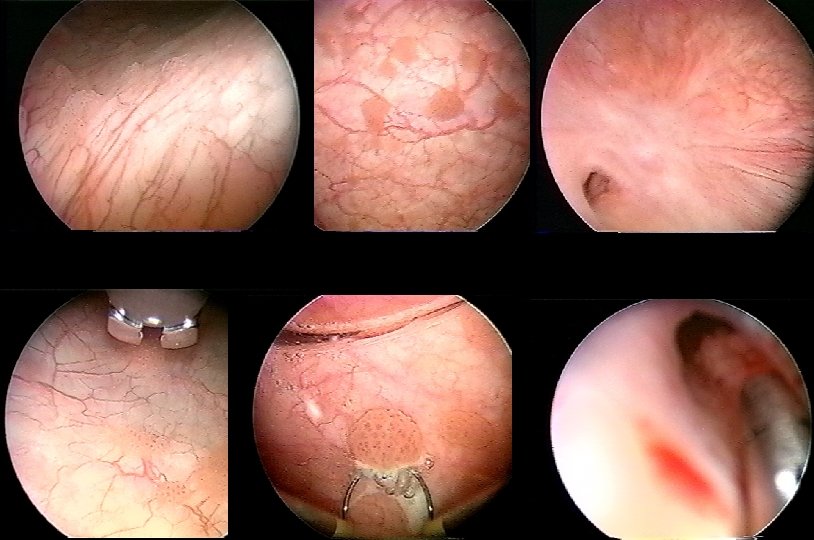
Diagnosis • 85% present with gross of microscopic hematuria • Cystoscopy is key: papillary tumors are easily • • seen. High grade, solid, flat or in situ tumors may not be seen Urinary Cytology: 80% + sensitivity in high grade tumors with 95% specificity. Insensitive with low grade. Sensitivity improved with FISH IVP, CT scan for upper tract evaluation

Cystoscopy showing bladder tumor

TURBT

Bladder Cancer Immunotherapy is Primarily BCG Immunotherapy Goals • • • Brief History of BCG Controlled Trials: vs TUR alone, vs Chemo Improving BCG Therapy: Maintenance, BCG + Ifn Limitations of BCG Prospects for New Agents

BCG History • 1921 - Calmette & Guerin successfully tame M. bovis • 1929 - Pearl reports TB reduces incidence of CA • 1930 - Lubeck incident brings erroneous scandal • 1935 - Holmgren reports BCG success in 28 cancer pts • 1936 - Rosenthal reports BCG’s profound RE stimulation • 1950’s- Animal studies confirm efficacy • 1972 - Rosenthal reports leukemia with vaccination • 1970’s- Multiple uncontrolled reports of clinical efficacy

BCG History- Bladder Cancer • 1976 - Morales reports 12 fold reduction in recurrence in • • 9 patients treated with BCG 1973 - Lamm begins controlled animal studies in TCC 1978 -NCI controlled trials begin based on Morales’ work 1980 - Lamm reports first successful controlled trial 1982 - Current: Brosman, Netto, Martinez-Pineiro and many others report BCG to be superior to Chemotherapy

Lamm, DL: Invest Urology 14: 369, 1977
: 38 -40, 1980")
Lamm, DL: J Urol 124(1): 38 -40, 1980
: 40 -47, 1985.")
Lamm, DL: J Urol 134(1): 40 -47, 1985.
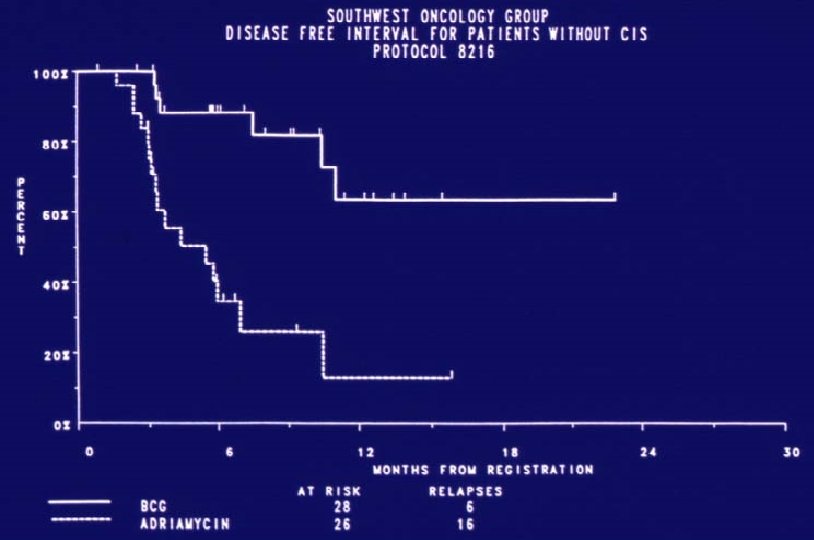
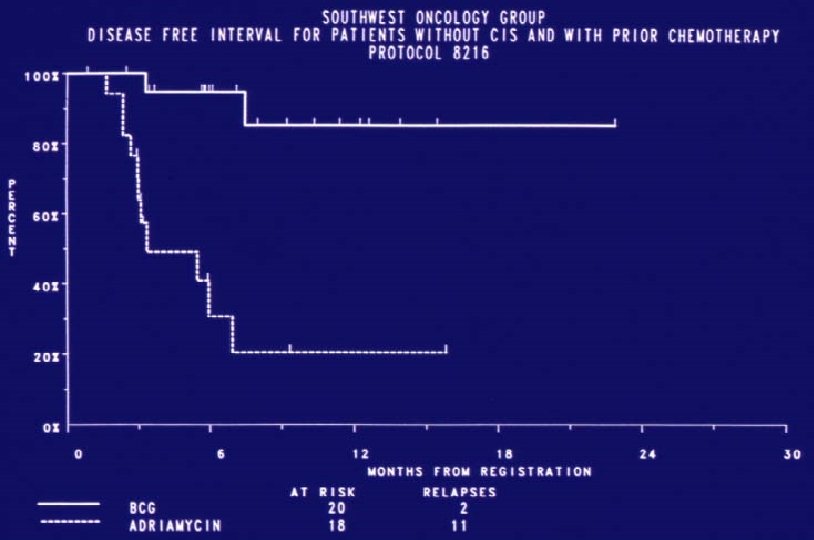

BCG Versus Doxorubicin: Time to Treatment Failure Percentage of patients 100 BCG CIS BCG Ta, T 1 Doxorubicin CIS 80 n 5 -year RFS 64 63 67 68 45% 37% 18% 17% 60 40 20 0 0 12 24 36 48 Time after registration, months 60 Lamm DL: N Engl J Med. 1991; 325: 1205 72

Diet, Lifestyle and Environmental Factors • Diet: low vitamin A, low serum carotene increase risk; increased fat increases risk; soy, garlic, selenium, NSAIDS, and green tea may reduce risk • Vitamins may be protective: A (differentiating agent); B 6; C (antioxidant); E (antioxidant), and possibly folic acid and D

Kaplan Meier Estimate of 5 Year Tumor Free Rate In 65 Patients Receiving Vitamin Supplement and BCG Therapy For Bladder Carcinoma 100 Lamm D. J Urol 151(1): 21 -26, 1994 Percent Tumor Free 90 80 40, 000 u Vitamin A, 100 mg B 6, 2 gm C, 400 mg E: "Oncovite" 70 60 p=0. 0014 50 40 30 RDAVitamins Oncovite 20 10 0 0 5 10 15 (N=30) (N=35) 20 25 RDA Vitamins 30 35 40 Months After Registration 45 50 55 60
 in Bladder Cancer • Overall recurrence reduced")
Oncovite (Vitamins A, B 6, C &E) in Bladder Cancer • Overall recurrence reduced from 80% to 40% • • • (P=0. 0011) 42% reduction in recurrence in Ta, T 1 TCC 53% reduction in low grade (G 1, G 2) TCC Associated with statistically significant increase in long-term NK cell activity in BCG treated patients
 '86 Yamamoto'90 Pagano '91 Mekelos '93")
Controlled BCG Trials Author Lamm '85 Herr (CIS) '86 Yamamoto'90 Pagano '91 Mekelos '93 Krege'96 Kolodziej ‘ 02 Total: no. 57 86 49 44 133 94 224 155 842 No. Rx 52% 95% 100% 67% 83% 59% 48% 55% 70% BCG 20% 42% 35% 17% 26% 32% 29% 19% 27% Ben. 32% 53% 65% 50% 57% 24% 36% 43% P <. 001 <0. 05 <. 001 <0. 02 <0. 05 <. 001

Meta-Analysis of BCG vs. TUR Alone Shelly et al. Cochrane Group BJU Int 2001, 88: 209 • 26 publications reviewed • 6 acceptable trials with 585 patients • Mean log hazard ratio for recurrence -. 83, P<0. 001 • 56% reduction in hazard attributable to BCG • Manageable toxicity: cystitis 67%, hematuria 23%, • fever 25%, frequency 71% Conclusion: BCG provides significantly better prophylaxis of tumor recurrence in Ta, T 1 TCC

Randomized BCG vs. Chemotherapy Studies BCG 0 7% 13% 53% 13% 24% 33% Rec vs vs Thiotepa Adv. P value +47 <. 01 +35 <. 01 +26 <0. 05 Author Brosman '82 Netto '83 Martinez '90 78% 43% 42% Doxorubicin +21 <. 02 +30 <. 01 +18 <. 05 Lamm '91 Martinez '90 Tanaka '94 47% Epirubicin +14 <. 0001 vd Meijden '01 Chemo 47% 43% 36%

Randomized BCG vs. MMC Studies BCG 4% 28 % 61 % 47 % 64 % 46 % 43 % 51 % 24 % 38 % 32 % 13 % Rec. vs vs vs MMC 34 % 62 % 80 % 42 % 43 % 56 % 66 % 29 % 62 % 54 % 26 % BCG +30 +34 +19 -5 -21 -3 +9 +15 +5 +24 +22 +13 P value <. 01 <. 001 NS NS NS <. 01 NS <. 001 <. 01 Author/year Pagano '87 Finnblad '89 Lee '92 Witjes '94 Vegt '95 SWOG '96 Malmstr. '96 Krege '96 Ayed '98 Milan '00 Nogueira '01 36. 7% of 781 vs 53. 8% of 771 (+17%) in maintenance BCG studies. 6/6 maintenance BCG studies significant vs 1/5 non-maint.
 Lamm DL: Urol Oncol 1: 119 -126, 1995 100")
BCG Versus Mitomycin-C (SWOG 8795) Lamm DL: Urol Oncol 1: 119 -126, 1995 100 90 Percent Recurrence 80 70 60 50 40 30 At. Risk BCG 190 MMC 187 20 10 0 0 6 Fail 44 64 Median in Months Not Reached 20 12 18 24 Time To Recurrence 30 36 60055 -23 -N

Intravesical BCG is superior to mitomycin C in reducing tumour recurrence in high-risk superficial bladder cancer: a meta-analysis of randomized trials. Shelley et al. (2004) BJU Int. 93: 485 -90 “This is the highest level of evidence-based medicine and the results presented here suggest that intravesical BCG is superior to mitomcycin C. ” “A subgroup analysis of 3 trials that included only high-risk Ta and T 1 patients indicated no heterogeneity (P-0. 25) and a LHR for recurrence of -0. 371 (0. 012). With MMC used as the control in the meta-analysis, a negative ratio is in favour of BCG and, in this case, was highly significant (P<0. 001). ”

Complete Response in CIS Intravesical Chemotherapy Agent Thiotepa Adriamycin Mitomycin C Epirubicin Epi + MMC N 89 212 196 84 21 CR% 38% 48% 53% 56% 81% Range (20 -50%) (0 -88%) (0 -100%)

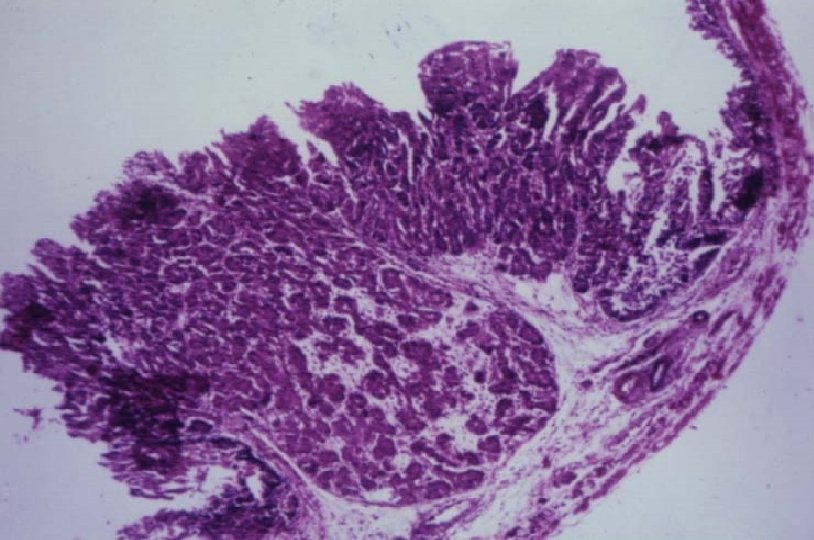
Progression in CIS Prior to BCG Immunotherapy

Comparison of BCG Preparations in the Treatment of CIS BCG Prep N Connaught Tokyo Pasteur Tice Evans A Frappier S African Danish Romanian RIVM 450 111 230 277 180 145 13 42 42 15 CR % 79% 77% 74% 71% 65% 60% 69% 67% 64% 60% Range CR 70% - 92% 63% - 84% 40% - 80% 56% - 88% 53% - 88% 39% - 100% Total: 1496 (72%) 39% - 100%

BCG vs Chemo For CIS: Meta-Analysis Sylvester: J Urol. 174: 86, 2005 • 9 randomized trials including 700 pts. With CIS • Chemo: MMC, Epi, Adria, or sequential MMC/Adria • BCG: 68% CR vs Chemo CR: 52%; P=0. 0002 • 3. 6 year follow: 47% BCG vs 26% Chemo NED • 26% reduction in disease progression with BCG • “BCG reduces the risk of short and long-term treatment failure compared with chemotherapy… agent of choice in the treatment of CIS. ”
:")
Meta-analysis of BCG versus Chemotherapy in CIS Sylvester RJ: J Urol. 2005 Jul; 174(1): 86 -91

Carcinoma in situ: SWOG 8507 CIS: 269 Randomized 114 Induction - 230 Evaluable - 116 Maintenance 6 week BCG 3 mo: 58% CR 6 week BCG P=0. 7 Observation 6 mo: 69% CR 55% CR 3 week BCG P=0. 01 84% CR 26% of CIS failures at 3 mo NED at 6 without further treatment; 64% with 3 wk BCG

3 Week Maintenance BCG in 550 Randomized, 385 Evaluable Patients Recurrence -free Survival p < 0. 0001 Worsening -free Survival p = 0. 04 Lamm DL et al, J Urol 163, 1124, 2000 Survival p = 0. 08

BCG Maintenance: Not Created Equal N=42 pts. 1 q 3 mo. % Disease Free 0 3 100 90 80 70 60 50 40 30 20 10 0 6 90 80 9 12 15 18 21 24 27 30 33 Months M BCG I BCG N=93 pts. 1 q 1 mo. 0 9 18 27 36 Months Global recurrence 100 M BCG I BCG 50 1. 0. 9. 8. 7. 6. 5. 4. 3. 2. 1 0. 0 Percent Tumor Recurrence % Tumor Free 100 M. Ta, T 1 M. CIS 70 60 I. CIS 50 I. Ta, T 1 40 N=385, 3 q 3 -6 mo. 30 M, Ta. T 1, 3 wk maintenance BCG M, CIS, 3 wk maintenance BCG I, CIS, 6 wk induction BCG I, Ta. T 1, 6 wk induction BCG 20 10 0 N=126, 6 q 6 mo. Maintenance Control 0 12 24 36 48 Time in months 60 72 0 1 2 3* 4** Years * Completion of Therapy ** Apparent Increase in Rate of Recurrence One Year After Completion of Maintenance 5 6 7 8 9

3 Weekly Maintenance BCG Schedule: Lamm 2005 Induction Mo: 3 6 12 18 24 36 Yr: 4 5 6 8 10 12 Full x 6 1/3 x 3: * * * **** * * Full strength BCG is given weekly for 6 weeks during induction (reduced if needed for increased side effects) 1/3 BCG, reduced to 1/10, 1/30, 1/100 th if needed due to increased side effects, given at 3, 6, 12, 18, 24, and 36 months, then years 4, 5, 6, 8, 10 and 12 years in G 3/CIS
 Increased survival vs control % Individual responses and")
Dose-Response Curve to BCG (in mice) Increased survival vs control % Individual responses and preparations vary, but too little or too much BCG reduces effect 60 40 Pasteur Tice Glaxo Over all 20 0 -20 105 106 107 BCG ·colony forming units Lamm DL, et al. J Urol. 1982; 128: 1104 -1108. 108

Progression: Maintenance BCG No Maintenance Patients 1049 3814 No BCG 10. 3% 14. 7% BCG 10. 8% 9. 5% OR 1. 28 0. 63 Test for heterogeneity: P = 0. 008 BCG was only effective in trials with maintenance, where it reduced the risk of progression by 37% p = 0. 00004. Sylvester RJ: J Urol. 2002 Nov; 168(5): 1964 -70. Meta Analysis of 24 Randomized Trials

Progression All Studies With Maintenance All With Maintenance Study Publ Year Author and Group Events / Patients No BCG 1991 Pagano (Padova) 11 / 63 1987 Badalament (MSKCC) 6 / 46 2000 Lamm (SW 8507) 2001 1996 1995 1999 2001 1991 2001 1982 1990 1999 1997 1994 1991 1993 1988 Palou Rintala (Finnbl 2) Lamm (SW 8795) Malmstrom (Sw-N) Nogueira (CUETO) Rintala (Finnbl 1) de Reijke (EORTC) vd Meijden (EORTC) Brosman (UCLA) Martinez-Pineiro Witjes (Eur Bropir) Jimenez-Cruz Kalbe Melekos (Patras) Ibrahiem (Egypt) Total 102 / 192 2 3 4 24 22 8 2 18 19 0 4 2 7 2 2 7 12 / / / / / 61 90 40 186 125 127 58 84 279 22 109 25 61 35 17 99 30 Statistics (O-E) Var. 3 / 70 6 / 47 -4. 4 -0. 1 3. 1 2. 6 87 / 192 -7. 5 24. 1 3 3 2 15 15 10 3 10 24 0 1 1 6 0 0 2 5 0. 4 0 -0. 5 -4. 8 -3. 5 -1. 9 0. 7 -4 -4. 7 0 -0. 9 -0. 6 -0. 5 -1 -1. 5 -1. 1 1. 2 1. 5 1. 3 8. 8 7. 9 3. 9 1. 2 5. 9 9. 1 0 1. 2 0. 7 2. 9 0. 5 2 2. 6 -36. 8 80. 9 / / / / / 65 92 28 191 125 247 51 84 558 27 67 28 61 32 21 62 17 257 / 1749 196 / 2065 (14. 7 %) (9. 5 %) (BCG |1 -OR| % ± SD No BCG) 37% ± 9 reduction 0. 0 Test for heterogeneity c 2 =9. 73, df=18: p=0. 9 OR & CI : 0. 5 1. 0 1. 5 BCG No BCG better Treatment effect: p=0. 00004 2. 0

Survival Death All Bladder Patients 2930 2370 No BCG 26. 7% 7. 7% BCG 23. 2% 5. 6% Total OR 24. 8% 0. 89 6. 5% 0. 81 The reductions in the odds of death, 11% overall and 19% bladder cancer, are not statistically significant, as might be expected with 2. 5 year mean follow up Sylvester RJ: J Urol. 2002 Nov; 168(5): 1964 -70. Meta Analysis of 24 Randomized Trials

Limitations of BCG Immunotherapy: 50 to 80% Eventually Fail • Early failure to respond s s Excess or remote tumors Rapidly dividing/growing tumor Low grade, “non-antigenic” tumors Unresponsive host • Late recurrence: immunosuppression, resistance • Toxicity

Treatment of BCG Failure • Chemotherapy for BCG failures provides poor response rates Ø 19% for MMC post BCG ØMalmstrom, J Urol, 2001 • Low Dose BCG after one cycle BCG failure provides 60% durable CR (same as BCG naive)

Maymi et al, AUA Abstract 918

Esuvaranathan: Singapore Randomized Trial. Full Dose BCG v 1/3 BCG+Ifn alpha 65 patients randomized to full dose Evan’s BCG vs. 1/3 dose BCG plus 10 MU Intron A 9 mo. Rec 20 mo. Rec Full Dose BCG: 32% 48% 1/3 Dose BCG: 12% 24% *P=0. 035 vs 1/3 BCG+ Ifn: 12%* Full dose BCG Subsequent randomization to full dose BCG vs. BCG+Ifn, 130 pts: Mean TTR 5 yr KM% Rec. Free Full Dose BCG (N=60): 58. 5 mo. 51% (49% rec) 1/3 Dose BCG (N=29): 61. 8 mo. 66% (34%) 1/3 BCG+ Ifn (N=41): 71. 8 mo. 79% (21%)

Complications of BCG Therapy in 2, 569 Patients Fever G. Prost Pneum/hep. Arthralgia Hematuria Rash Uret. Obstr. Epididymitis Contr. blad. Renal abscess Sepsis Total 75(2. 9%) 23(0. 9%) 18(0. 7%) 12(0. 6%) 24(1. 0%) 8(0. 3%) 10(0. 4%) 6(0. 2%) 2(0. 1%) 10(0. 4%) Tice 4. 7% 1. 8%. 4%. 7%. 3%. 4%. 6%. 4% 0 0. 1% Connaught 4. 7% 1. 0%. 8%. 1%. 6% 0. 4% 0. 3% 0. 4% Lamm DL. Urol Clin North Am. 1992; 19: 565 -7

Early Comparison KLH Trials Treatment R/100 pt mo N MMC KLH 10 mg 23 21 9. 3 3. 3 Rec % 39% 14% Epodyl 4. 8 46 35% KLH 20 mg 6. 5 38 21% Jurincic, 1988; Flamm, 1990

Purified vs Crude KLH vs BCG Treatment Incidence Pure KLH 4/10 Crude KLH 0/10** BCG 2/10* Saline 8/10 Volume Survival 1900 mm 5 230 ** 10 ** 71 ** 9* 3400 3 * P<0. 012; ** P<0. 002
 CIS 9 Ta, T")
Complete Response to KLH by Disease Category Stage CR (N) CIS 9 Ta, T 1, CIS 4 Ta, T 1 3 Total 16 CR (%) 50% 33% 20% 36%

Conclusions • Bladder Cancer is immunoresponsive and an • • • excellent model for drug development. BCG immunotherapy is superior to chemotherapy and reduces progression, but 50 -80% fail. Maintenance schedules, vitamins, and interferon may improve response. New agents such as KLH and others hold promise for reduced toxicity, and new approaches such as DNA-based therapy are greatly needed!


H 19 Expression in Bladder Cancer • 84% of TCC express H 19 • Levels are nearly undetectable in surrounding normal urothelium G 2 TCC with H 19 Stain CIS H 19 ISH Color Intensity

What is the Best Induction Schedule ? Six weekly instillations: excellent but clearly suboptimal Immune stimulation peaks at 6 weeks Continued treatment beyond 6 weeks can suppress the immune response With retreatment, stimulation peaks at 3 wks Controlled trial of "6" vs "6+3" in CIS shows < CR from 69% to 84% (P<0. 01)

Why Not Give Monthly BCG Maintenance ? Historical and controlled studies show no advantage over 6 week induction Toxicity is increased over induction There is no biological or immunological rationale for the monthly schedule Immune suppression may occur

Percutaneous BCG ? Two studies failed to demonstrate benefit 40 -60% of patients convert PPD skin test after intravesical BCG More than 90% convert with I. D. BCG Lamm '85 and Torrence '88: 17/55 (31%) recurrence with PPD conversion, 51/82 (62%) recurrence with no conversion P=0. 0225 CR in CIS increased from 49% to 77% with PPD conversion (SWOG, P<0. 001)

Optimal BCG Retreatment "6+6" should be avoided, unless the interval since last treatment has been long (many years) and little or no side effects occurred If a second six week course is given one cannot distinguish decreased sensitivity to BCG from iatrogenic immunosuppression For repeat BCG, think "3 plus 3"
 or stopping")
Toxicity of Maintenance BCG Log dose reductions (1/3, 1/10, 1/30, 1/100 th) or stopping maintenance BCG appears to prevent toxicity Side effects are not required to receive the benefit of maintenance BCG

Treatment of BCG Sepsis · Isoniazid 300 mg, rifampin 600 mg, and ethambutol 1200 mg daily plus a fluoroquinolone or an aminoglycoside · Prednisone 40 mg daily (higher doses sometimes are required) · Taper steroid slowly when patient improves · Resume steroids if symptoms recur after taper · Continue triple antibiotics for 3 -6 months · No more BCG
- Slides: 58