
BLACKJACK STRATEGY OPTIMIZATION Rene Plowden Joseph Libby Formal

BLACKJACK STRATEGY OPTIMIZATION Rene Plowden Joseph Libby
Formal Statement of Problem Improving the profit margin by optimizing the win ratio through the use of various strategies and algorithmic computations.
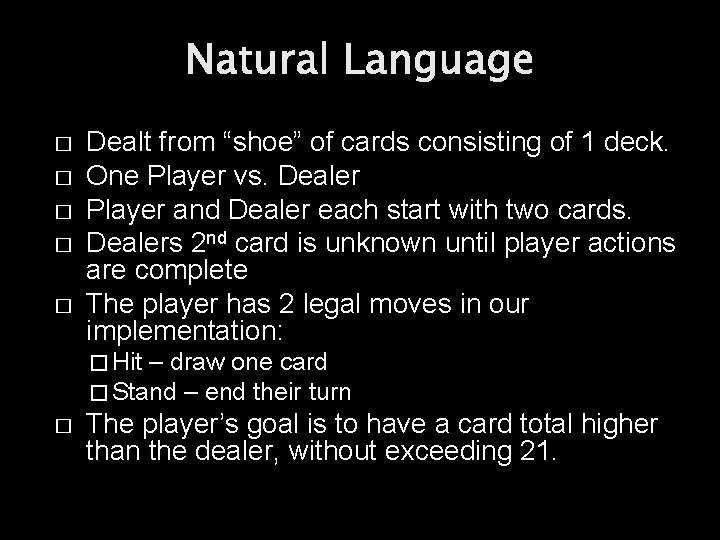
Natural Language � � � Dealt from “shoe” of cards consisting of 1 deck. One Player vs. Dealer Player and Dealer each start with two cards. Dealers 2 nd card is unknown until player actions are complete The player has 2 legal moves in our implementation: � Hit – draw one card � Stand – end their turn � The player’s goal is to have a card total higher than the dealer, without exceeding 21.
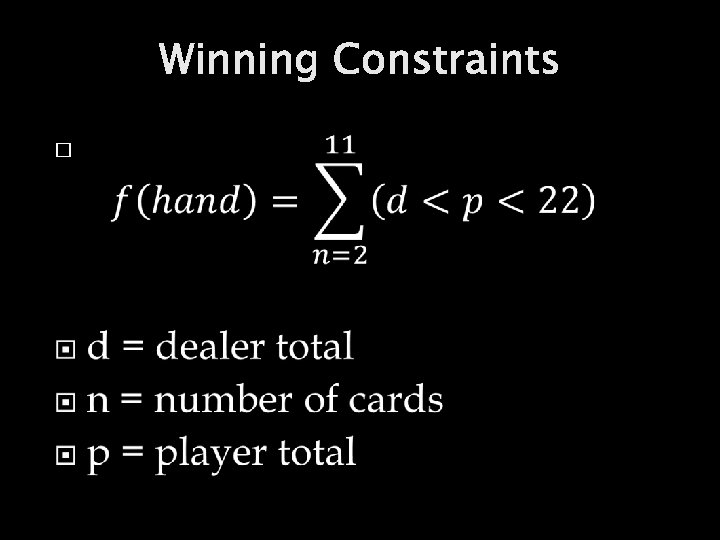
Winning Constraints �
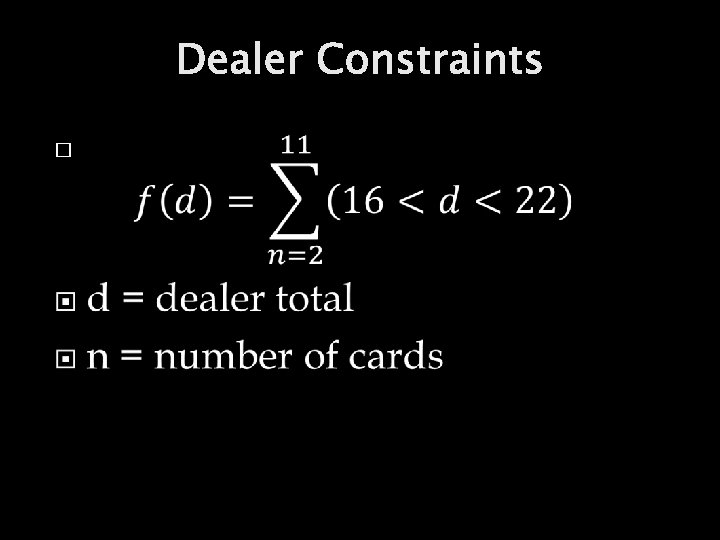
Dealer Constraints �
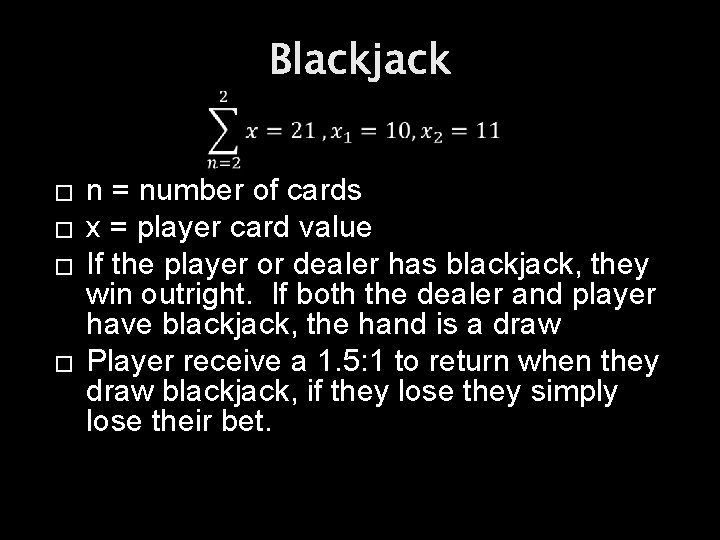
Blackjack � � n = number of cards x = player card value If the player or dealer has blackjack, they win outright. If both the dealer and player have blackjack, the hand is a draw Player receive a 1. 5: 1 to return when they draw blackjack, if they lose they simply lose their bet.
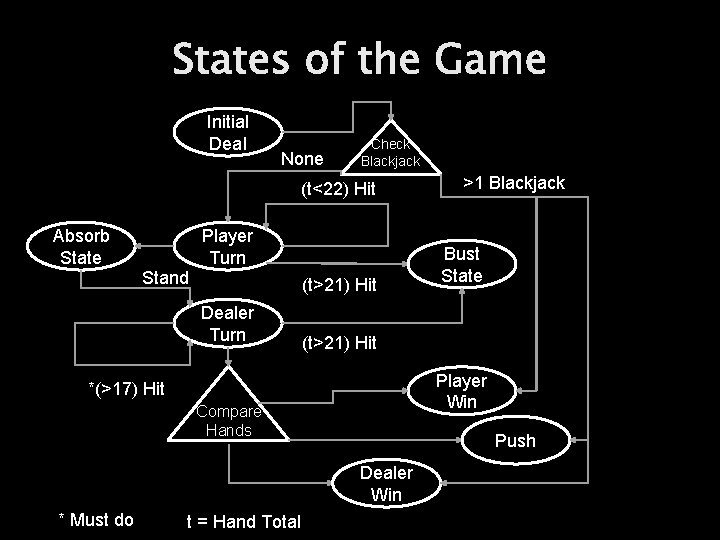
States of the Game Initial Deal None Check Blackjack (t<22) Hit Absorb State Stand Player Turn (t>21) Hit Dealer Turn Player Win Compare Hands Push Dealer Win t = Hand Total Bust State (t>21) Hit *(>17) Hit * Must do >1 Blackjack
Benchmark Perfect Game � � � 250, 000 “shuffled” decks that each class will use as well Each deck is used for 4 games only The player has the highest valued hand by knowing the card before it is dealt. Never takes into account the dealer’s cards. Will be the highest winning ratio for each of the tested algorithms.
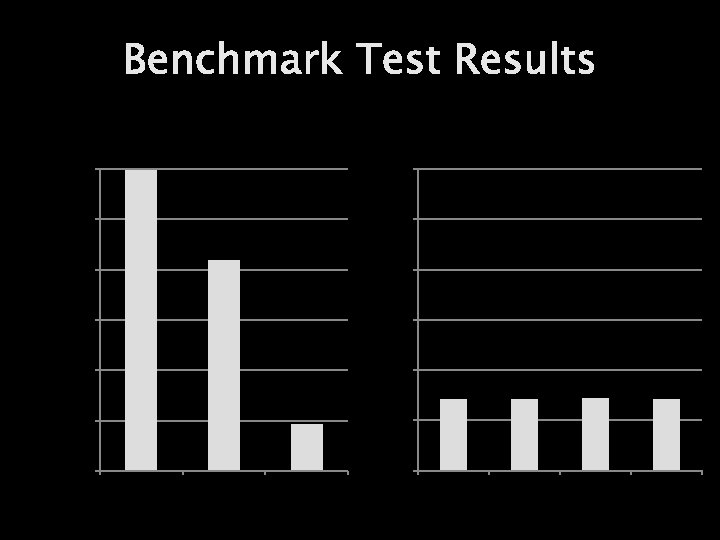
Benchmark Test Results Perfect Game 600000 500000 400000 300000 200000 100000 0 0 Win Lost Push Hand 1 Hand 2 Hand 3 Hand 4
Algorithms � Naïve Approach � Uses card counting to calculate chance of busting when taking a hit. � Monte Carlo � Simulates 1000 variations of hand outcomes for each possible decision (hit or stand), chooses the most successful decision. � Combinatorial Analysis � Observes the probability of the state of the dealer’s hand the chance of the player busting when taking a hit (using card counting as well).
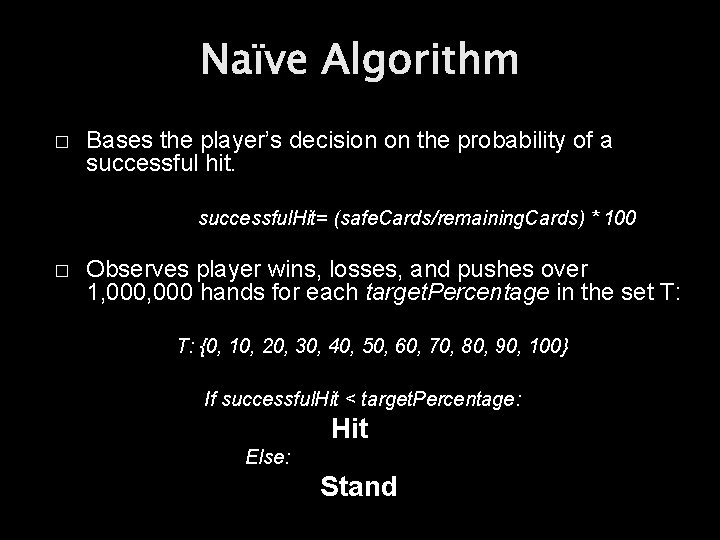
Naïve Algorithm � Bases the player’s decision on the probability of a successful hit. successful. Hit= (safe. Cards/remaining. Cards) * 100 � Observes player wins, losses, and pushes over 1, 000 hands for each target. Percentage in the set T: T: {0, 10, 20, 30, 40, 50, 60, 70, 80, 90, 100} If successful. Hit < target. Percentage: Hit Else: Stand
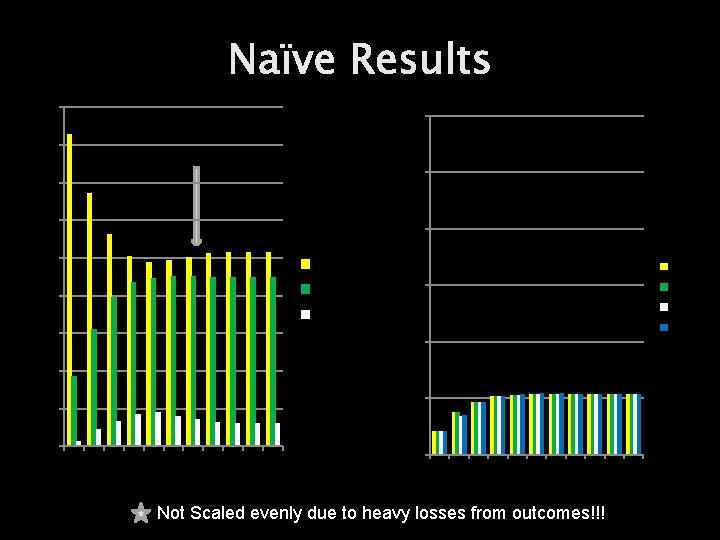
Naïve Results 900000 600000 800000 500000 700000 600000 400000 500000 loss 400000 win hand 1 300000 hand 2 hand 3 push 300000 hand 4 200000 0 10 20 30 40 50 60 70 80 90 100000 100000 Not Scaled evenly due to heavy losses from outcomes!!!
Monte Carlo � � � Making certain the uncertain. Convert models of an outcome into varied lengths used to simulate possible results. The closer the lengths are to the true conclusion probability the more viable the prediction. More weighted heuristics will give the problem more conclusive data. Randomly choose a number along the number line and record how many times it occurs. Some answers will surface to the top.
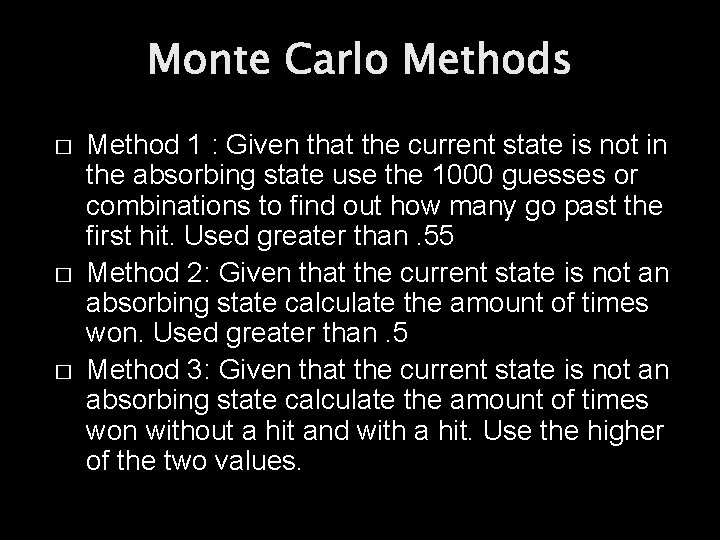
Monte Carlo Methods � � � Method 1 : Given that the current state is not in the absorbing state use the 1000 guesses or combinations to find out how many go past the first hit. Used greater than. 55 Method 2: Given that the current state is not an absorbing state calculate the amount of times won. Used greater than. 5 Method 3: Given that the current state is not an absorbing state calculate the amount of times won without a hit and with a hit. Use the higher of the two values.
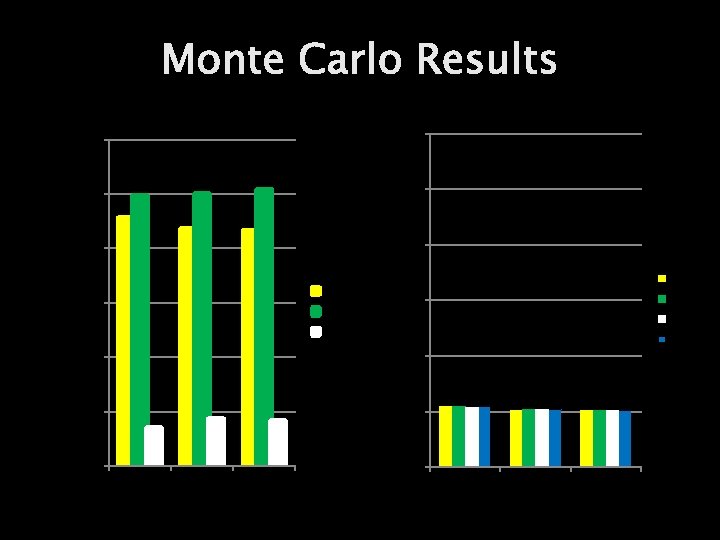
Monte Carlo Results 600000 500000 400000 Win 300000 Lost Hand 1 300000 Hand 2 Hand 3 Push Hand 4 200000 100000 0 Method 1 Method 2 Method 3
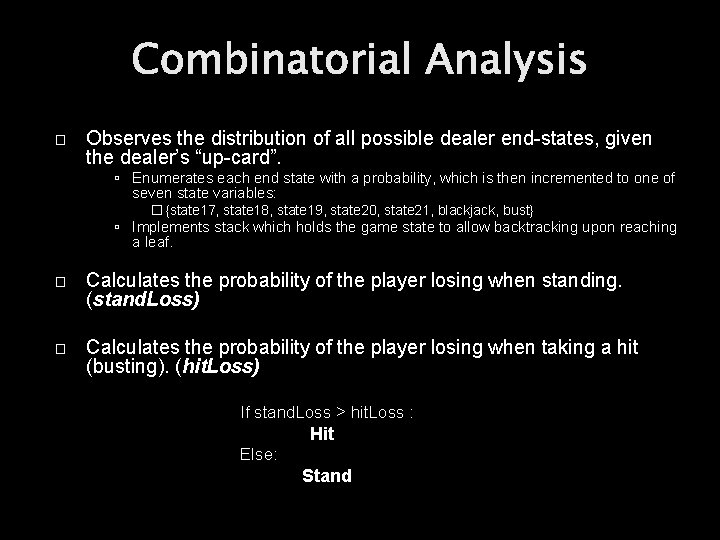
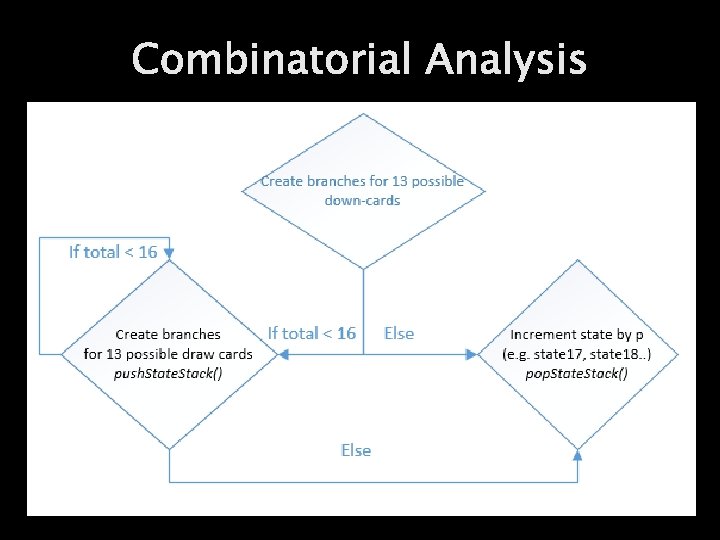
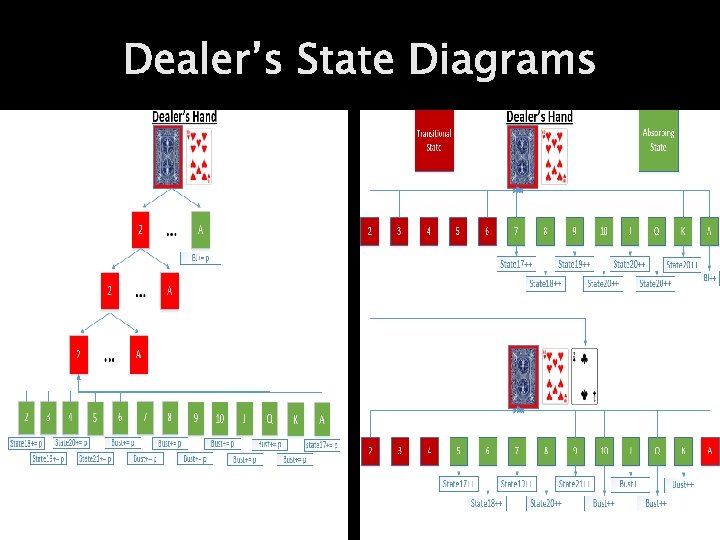
Combinatorial Analysis � Observes the distribution of all possible dealer end-states, given the dealer’s “up-card”. Enumerates each end state with a probability, which is then incremented to one of seven state variables: �{state 17, state 18, state 19, state 20, state 21, blackjack, bust} Implements stack which holds the game state to allow backtracking upon reaching a leaf. � Calculates the probability of the player losing when standing. (stand. Loss) � Calculates the probability of the player losing when taking a hit (busting). (hit. Loss) If stand. Loss > hit. Loss : Hit Else: Stand
Combinatorial Analysis
Dealer’s State Diagrams
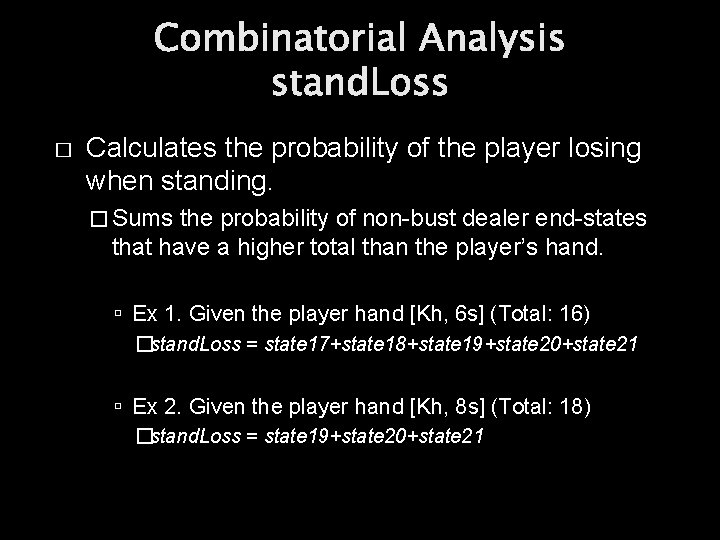
Combinatorial Analysis stand. Loss � Calculates the probability of the player losing when standing. � Sums the probability of non-bust dealer end-states that have a higher total than the player’s hand. Ex 1. Given the player hand [Kh, 6 s] (Total: 16) �stand. Loss = state 17+state 18+state 19+state 20+state 21 Ex 2. Given the player hand [Kh, 8 s] (Total: 18) �stand. Loss = state 19+state 20+state 21
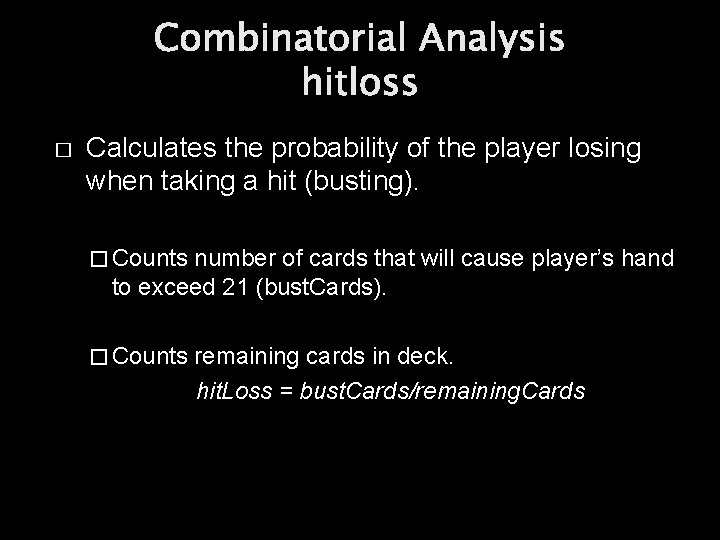
Combinatorial Analysis hitloss � Calculates the probability of the player losing when taking a hit (busting). � Counts number of cards that will cause player’s hand to exceed 21 (bust. Cards). � Counts remaining cards in deck. hit. Loss = bust. Cards/remaining. Cards
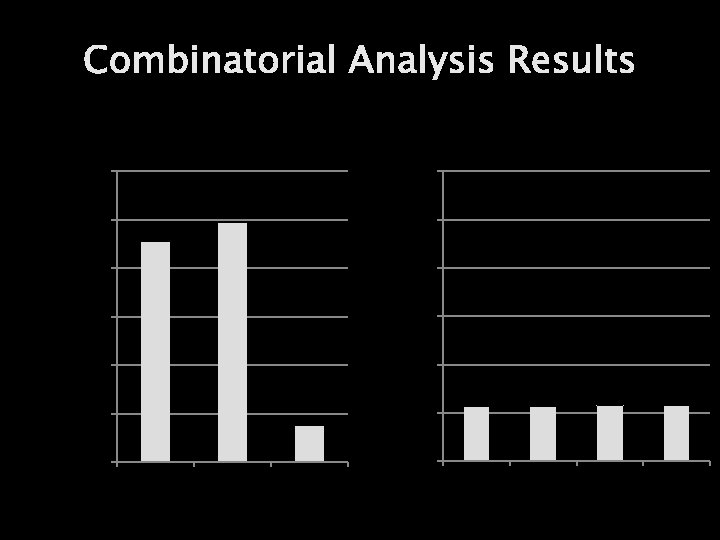
Combinatorial Analysis Results 1 Mil 600000 500000 400000 300000 200000 100000 0 0 Win Lost Push Hand 1 Hand 2 Hand 3 Hand 4
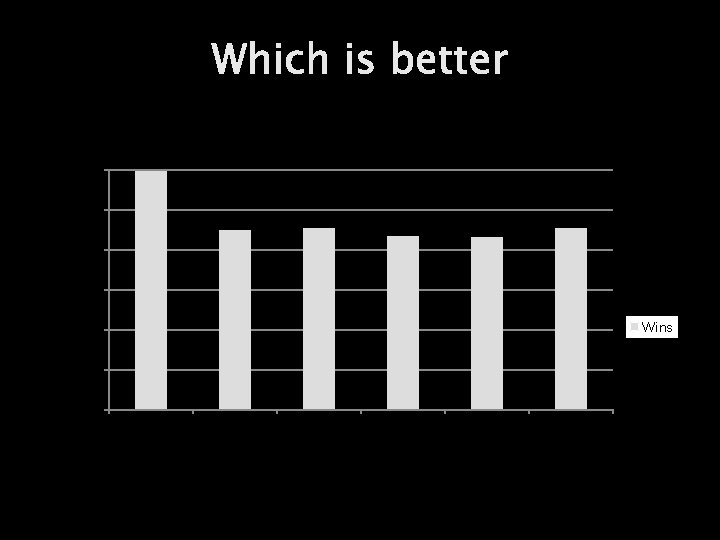
Which is better Wins 600000 500000 400000 300000 Wins 200000 100000 l om C M bi n et h at o od ria 3 2 C M M et h od od 1 e aï v N M Pe rfe ct G am e 0
Future Ideas � � Integrate more heuristics and weights to increase win ratio. Incorporate more than one algorithm in the decision making process. Understand Monte Carlo better and how to program implementation into a “chaotic” environment. Add splits and double down to the calculations to see if it gets better results for the player.
Why Does this Qualify for CSC 380? � � We learned a lot about the algorithms we did implement. Including a few we didn’t. Found it more difficult to explain easy terms rather than harder ones. Complex problems and even more complex solutions. I learned again why I never bet.
Questions
Questions for You � Why is Monte Carlo methods used primarily in ‘predicting’ the Stock Market? � Although unpredictable, the Stock Market has a lot of historical data and regular data that can be measured to offer a solution to an unsolvable prediction. � 2. What data structure would best suit a back tracking algorithm? � Stack
Questions for You �What is an absorbing state? �A final state, defined by constraints, which cannot transition to another state
Sources � https: //math. dartmouth. edu/theses/undergrad/2 014/Vaidyanathan-Thesis. pdf � The Evolution of Blackjack Strategies by Graham Kendall and Craig Smith � Evolving Strategies in Blackjack by David Fogel
- Slides: 28