Black Swan Ohiwa Tauranga Harbours Three main complaints

Black Swan Ohiwa &Tauranga Harbours
; 2.")
Three main complaints 1. They are eating all the seagrass (Zostera sp. ); 2. They poop everywhere and are contaminating the harbour; 3. They are responsible for the eutrophication of the lakes and rivers • Sometimes people complain that there are just too many swan • Interestingly we probably receive more complaints from the public when we try and reduce swan numbers.

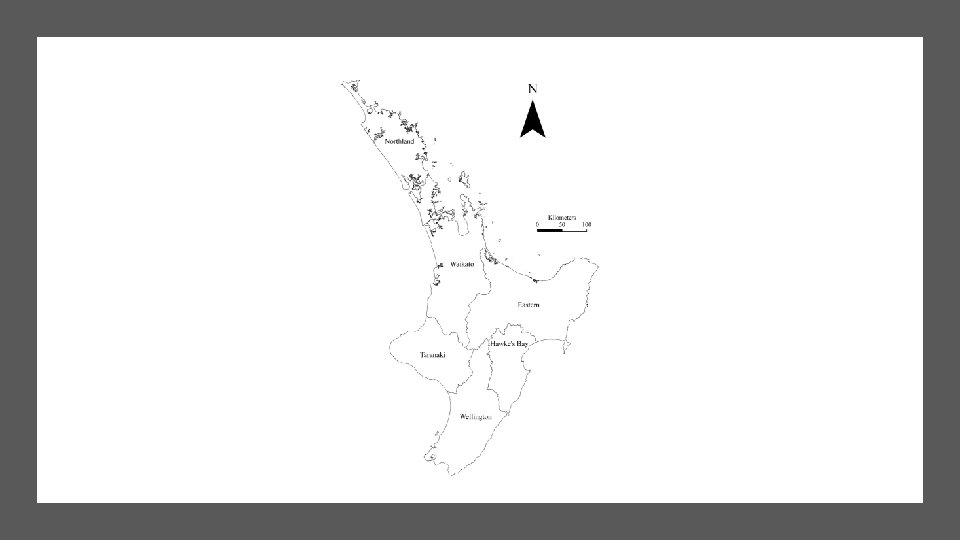
Today • Discuss the relative impact of swan on the Zostera cf. anthropogenic contaminants and sediment inputs. • Show that relative to other nutrient and fecal coliform inputs swan don’t even hit the radar • But first off, I wish to give you a quick introduction to the black swan, and specifically discuss the Tauranga and to a lesser degree, Ohiwa Harbour populations.
")
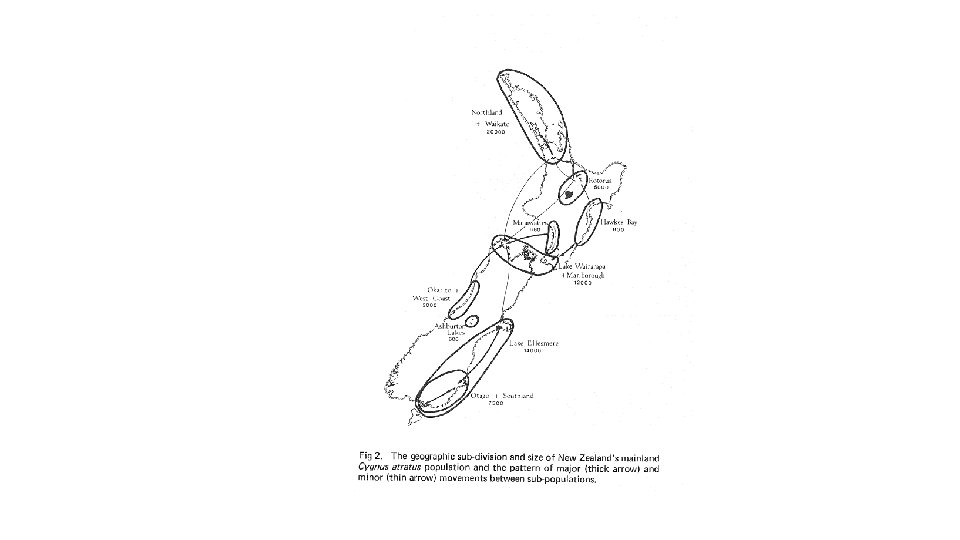
Status • NZ had at least two swan an endemic swan, Cygnus sumnerensis (Pouwa) and a native, C. atratus (the black swan). • Found in pre-European middens • By time Europeans arrived both were extinct in NZ • About 100 reintroduced by the Acclimatisation Societies in 1860 s • This population increased faster than can be explained by breeding of the introduced birds. Consensus is that they reintroduced themselves about the same time
, but most of Waikato birds don’t live")
Population dynamics • Long lived (>25 years), but most of Waikato birds don’t live longer than 8 years • Some colony nest some solitary. • 2/3 of eggs of colony nesting swan hatch and up to ¼ of nests fail to produce anything. • Up to 40% of cygnets die in their first year. • Only eat plant material, prefer aquatic plants cf. terrestrial. • Susceptible to large weather events (Wahine storm killed thousands of swan). Took over 10 years for the population to recover. (loss of Ruppia Beds).

Neck collars and leg banding

Legal Status • Listed as a game bird under the Wildlife Act (Schedule 1 Wildlife Act 1953). • May be hunted with Minister of Conservation’s Authorisation

Fish and Game • Set up under the Conservation Act • Report to Parliament • Manage sports fish and game birds • Make game bird harvest recommendations to the Minister of Conservation • Funded solely from licence sales
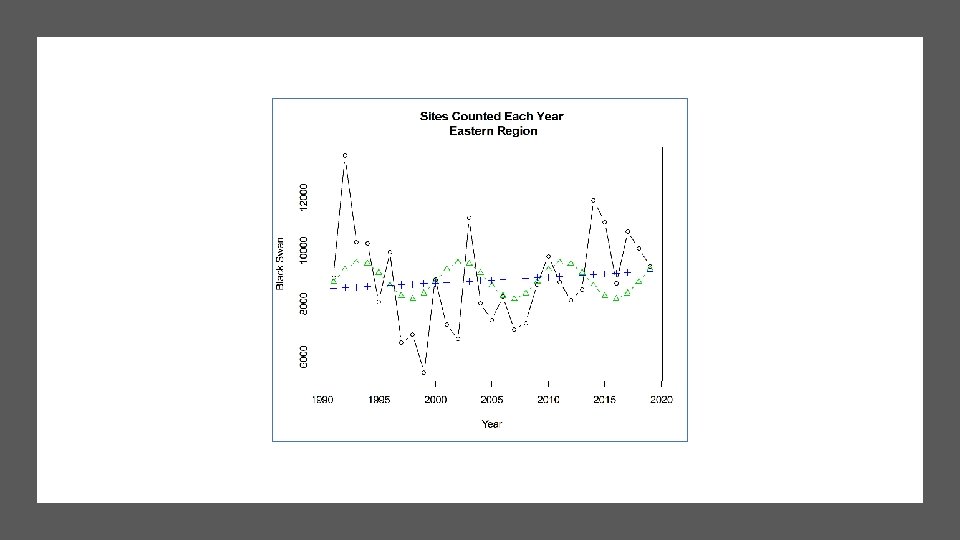
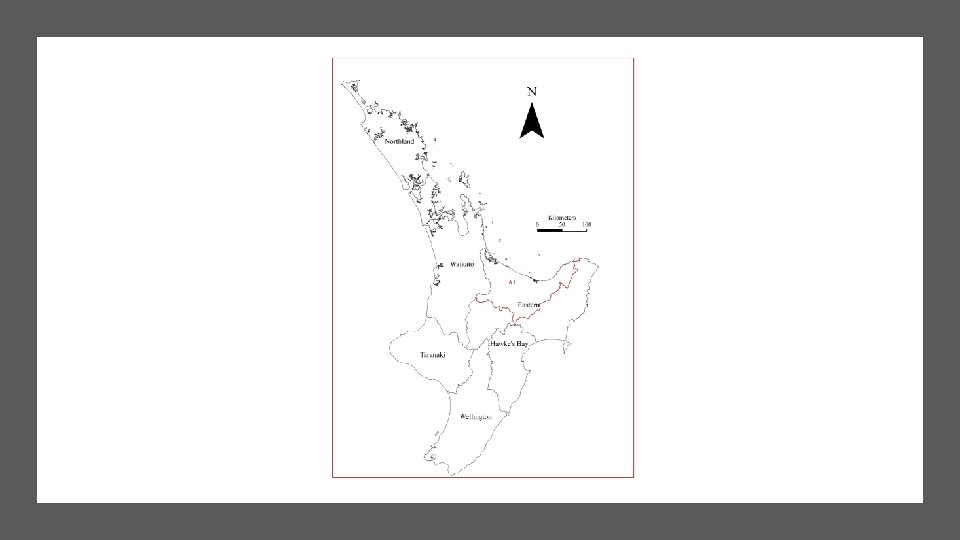

Management Area A 1 12000 10000 8000 6000 4000 2000 0 1991 1992 1993 1994 1995 1996 1997 1998 1999 2000 2001 2002 2003 2004 2005 2006 2007 2008 2009 2010 2011 2012 2013 2014 2015 2016 2017 2018 2019 Management Area A 1 Linear(Management Area A 1)

8000 6000 Total Count Waikato Swan Black Swan Trend Count, Lower Waikato lakes and Western harbours 1984 -2018 18000 16000 14000 12000 10000 4000 2000 0 2018 2017 2016 2015 2014 2013 2012 2011 2010 2009 2008 2007 2006 2005 2004 2003 2002 2001 2000 1999 1998 1997 1996 1995 1994 1993 1992 1991 1990 1989 1988 1987 1986 1985 1984

Ohiwa swan population • Stopped counting in 2000 as population so low. • 39 were counted in 2018 (about 1 per every 40 ha of harbour) • From a F&G management perspective the population is too low to warrant annual monitoring • If swan on Ohiwa were the same density as Tauranga harbour we would expect the Ohiwa population to be about 950

• World wide seagrass is vanishing 10 times faster than tropical rainforest • Zostera is an important habitat for juvenile marine species including snapper • Zostera is consumed by swan • Dos Santos estimated a swan on Tauranga Harbour will eat 394 g DW day-1 • She considered that if the swan consumed 19 -30% of the harbours Zostera it becomes unsustainable. Impact of swan on Zostera • This she estimated is equivalent to 4630 -7400 swan

• The problem with these estimates is that Zostera growth fluctuates with the seasons and; • So do swan numbers Tauranga Harbour is not suitable habitat for breeding

Tauranga Aerial Swan Counts 8000 7000 6000 5000 4000 3000 2000 1000 0 1991 1992 1993 1994 1995 1996 1997 1998 1999 2000 2001 2002 2003 2004 2005 2006 2007 2008 2009 2010 2011 2012 2013 2014 2015 2016 2017 2018 2019 Jan April August

• Swan were most numerous in Autumn which coincides with maximum Zostera growth
 (SG Park EBOP Report 99/30) • Rates of seagrass loss")
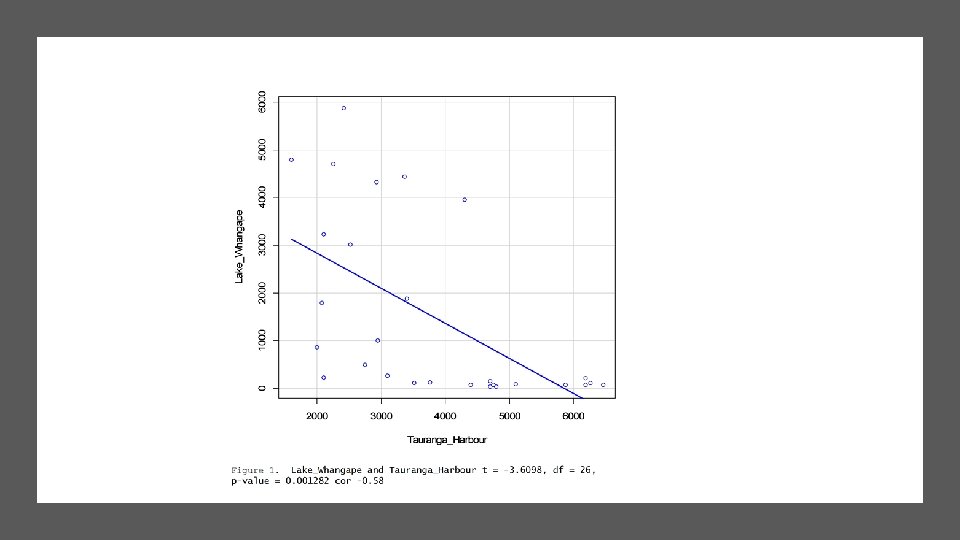
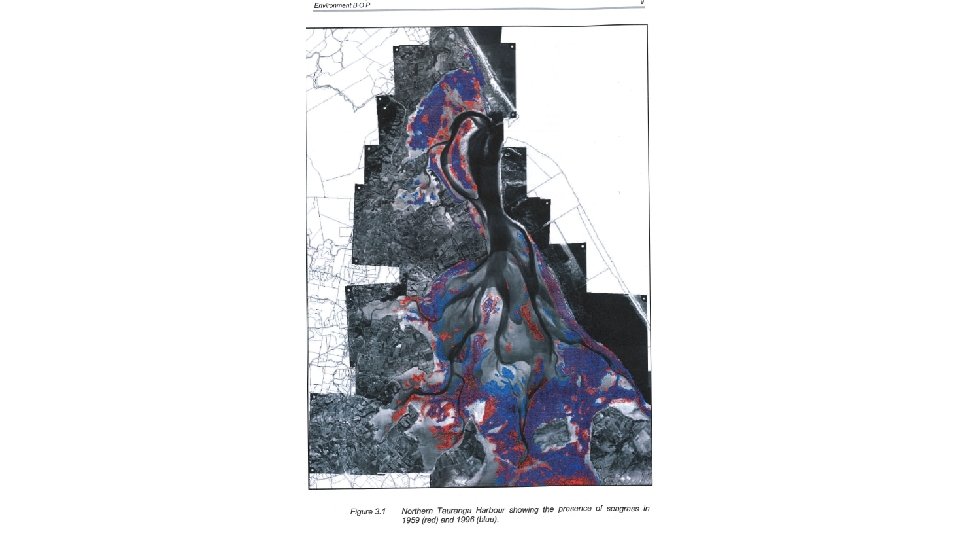
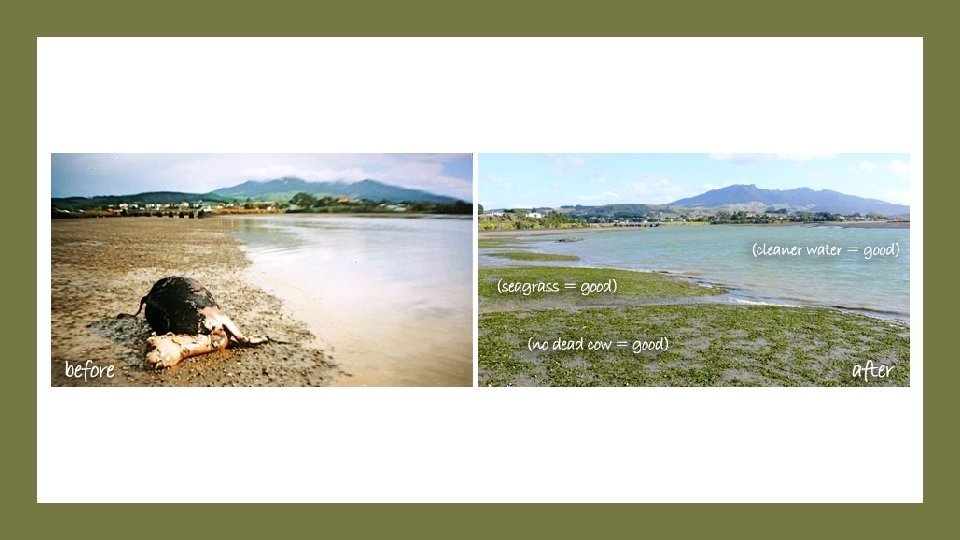
Seagrass (Zostera sp. ) (SG Park EBOP Report 99/30) • Rates of seagrass loss in the Tauranga correlate well with the suspended sediment loading. • Evidence strongly points to sediment and nutrient runoff as the main factor involved in seagrass loss from the harbour. • The southern harbour has relatively 3 times the catchment of the northern harbour and has experienced a far higher rate of seagrass loss confirming this impact at a larger scale
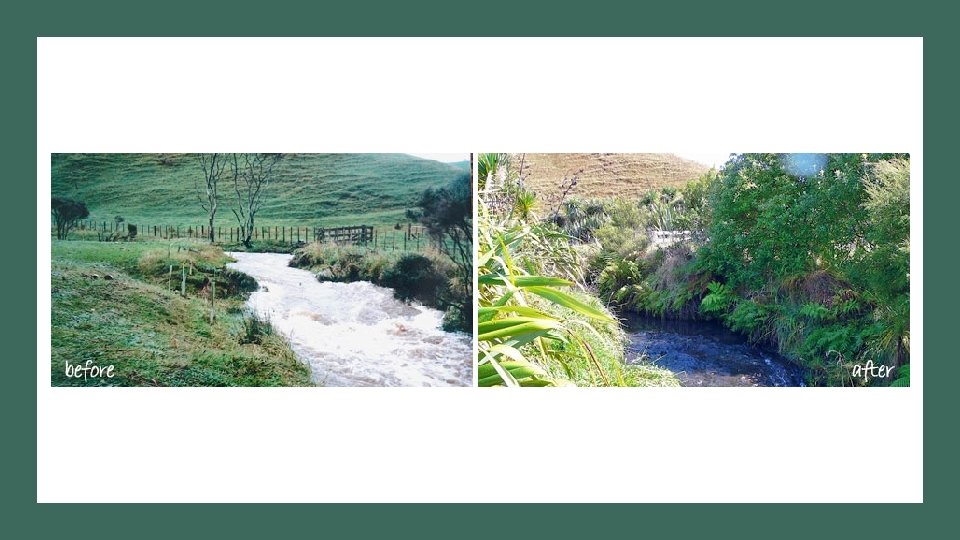
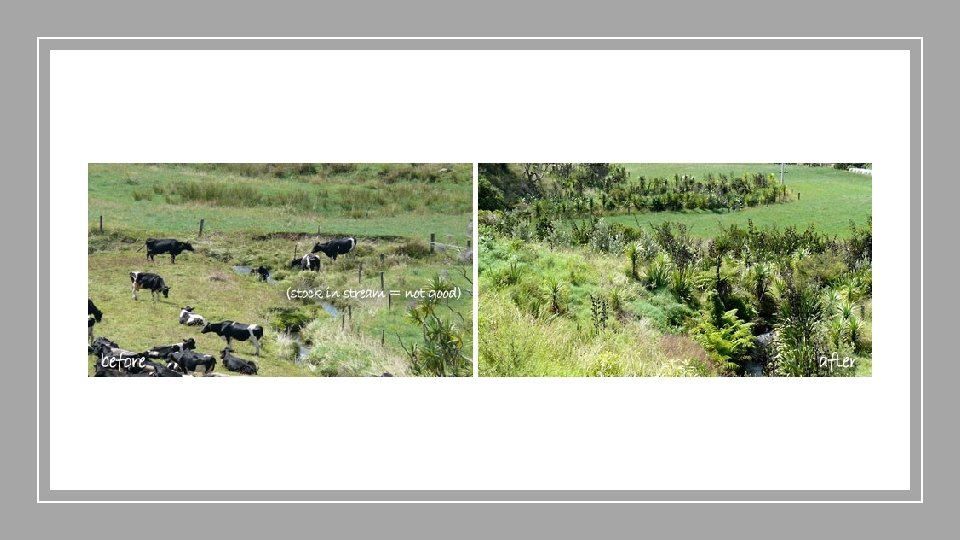
 Harbour Care (Fred Lichtwark)")
Whaingaroa (Raglan) Harbour Care (Fred Lichtwark)

Eutrophication and Swan • If we get a complaint from the public, it is usually to do with the amount of poop on the mud flats. • In the political arena, concerns relate to swan eutrophication and fecal coliforms. • NIWA (Paul Sagar et. Al 1995) looked at contribution of swan to nutrient loadings. They commented that the inputs from swan need to be compared with the other [nutrient] inputs and consideration should be given to whether the birds are importing nutrients to the water body or merely recycling them.
 is that the contribution by")
• The evidence for large lakes (Taupo, Ellesmere) is that the contribution by swans is very small. • For example based on the number of swan on Lake Rotorua in 2003 a total of 21 kg of N (NH 4 -N; ammonium) or P (Dissolved Reactive Phospherus) per annum was produced. • The Waiohewa, a geothermal stream, that flows into Lake Rotorua, discharges 40 – 50 kg NH 4 -N per day. • Fish (1975) estimates almost 41 kg of PO 4 -P enters Lake Rotorua each day from Hamurana Spring alone.

Fecal coliforms • The amount of poop clearly upsets some Tauranga residents however it is what happens in nature. Bears do it in the woods swan do it in the estuaries. • Again using Lake Rotorua as an example: • At a flow of 2 m 3/sec the Ngongotaha stream (measured at the SH 5 bridge) contributes almost 70, 000% more fecal coliforms than the swan.

So what is the answer • Humans have already driven NZ swan to extinction once before, we have to be careful that we don’t do it again. • Need to be cautious how they are managed don’t want a similar Canada goose debacle which has seen the population explode since it has been taken off the game bird schedule (Schedule 1 Wildlife Act 1953) in 2012.

Council’s responsibilities • The amount of sediment entering the harbour is in the Council’s hands (through catchment management). • If the Council is serious about wanting to clean up the harbour check out what Fred Lichtwark and friends have done over in Raglan (Fred Lichtwark - Plenty More Fish in the Sea: The Whaingaroa Harbour Journey).

F&G Position • Given the amount of sediment input and continuing loss of the Zostera beds, in some months of the year swan numbers are possibly in the zone defined by Dos Santos as unsustainable. • It is not clear if these high seasonal populations of swan are having a long-term impact on Zostera bearing in mind that population fluctuates over the year as does Zostera growth (i. e. we need more info. )

F&G’s response • F&G are trying to reduce the swan population through very relaxed hunting regulations (no limit and 4 month season) and; • A special swan season in February • During this special season we have assisted the Western Bay of Plenty F&G club to have an organized shoot.

Collaborative answer • Need to make informed decisions based on sound science. • F&G have had discussions with Waikato University (Professors Chris Battershill and Ian Hawes) and EBOP staff Environmental Scientist Josie Crawshaw and Biosecurity Manager Greg Corbett • Prepared to work collaboratively to ID solutions where genuine issues are identified.
- Slides: 35