
Bivariate EDA Describe the relationship between pairs of

Bivariate EDA • Describe the relationship between pairs of variables • Four characteristics to describe • • Association (Direction) Form Outliers Strength Quantitative Bivariate EDA Slide #1
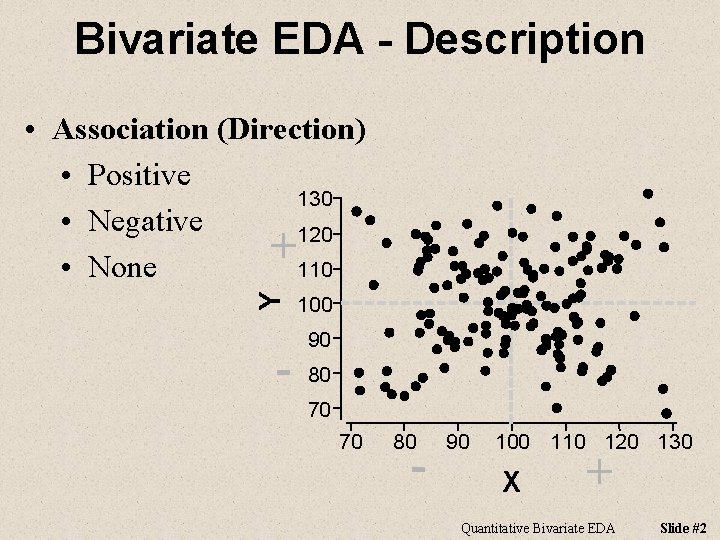
Bivariate EDA - Description Y • Association (Direction) • Positive 130 • Negative 120 + • None 110 - 100 90 80 70 70 80 - 90 100 110 120 130 X + Quantitative Bivariate EDA Slide #2
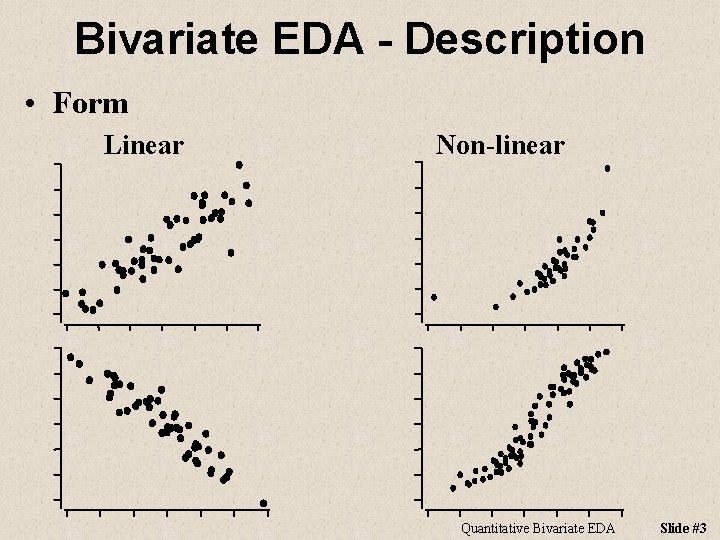
Bivariate EDA - Description • Form Linear Non-linear Quantitative Bivariate EDA Slide #3
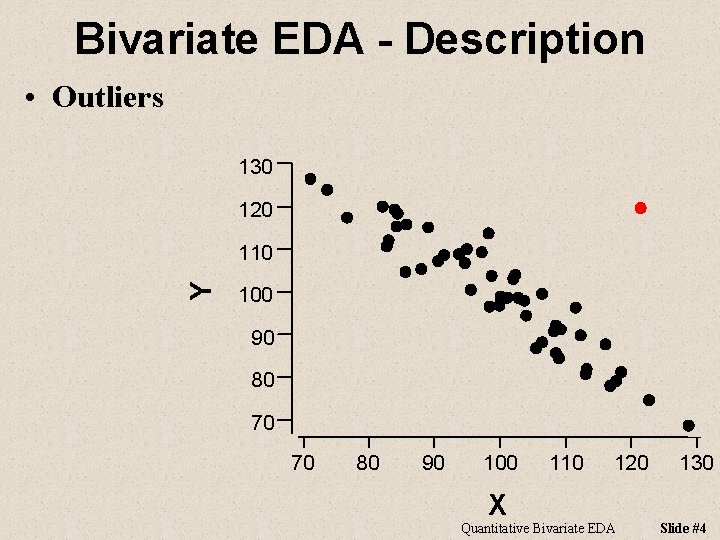
Bivariate EDA - Description • Outliers 130 120 Y 110 100 90 80 70 70 80 90 100 X 110 120 Quantitative Bivariate EDA 130 Slide #4
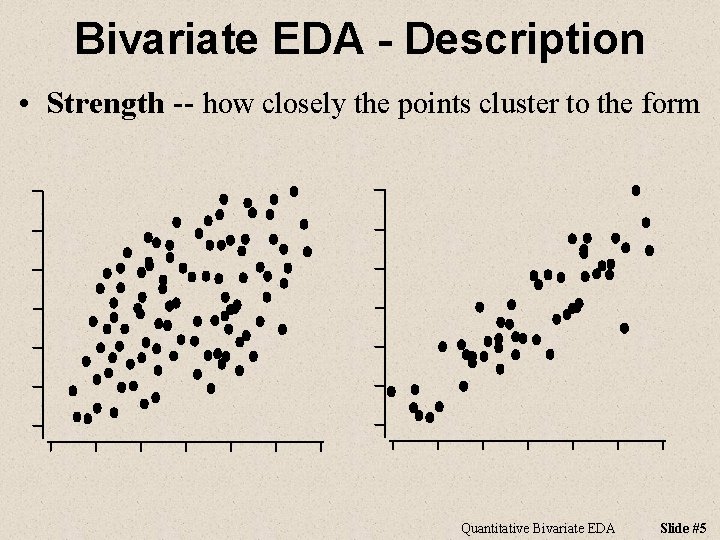
Bivariate EDA - Description • Strength -- how closely the points cluster to the form Quantitative Bivariate EDA Slide #5
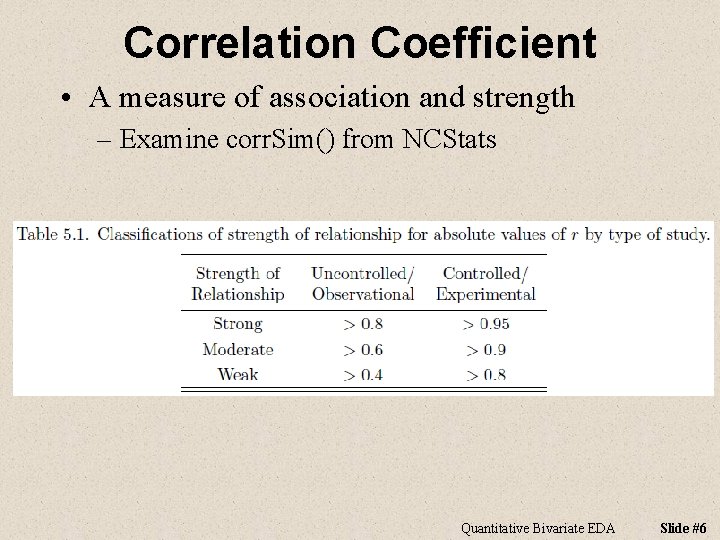
Correlation Coefficient • A measure of association and strength – Examine corr. Sim() from NCStats Quantitative Bivariate EDA Slide #6
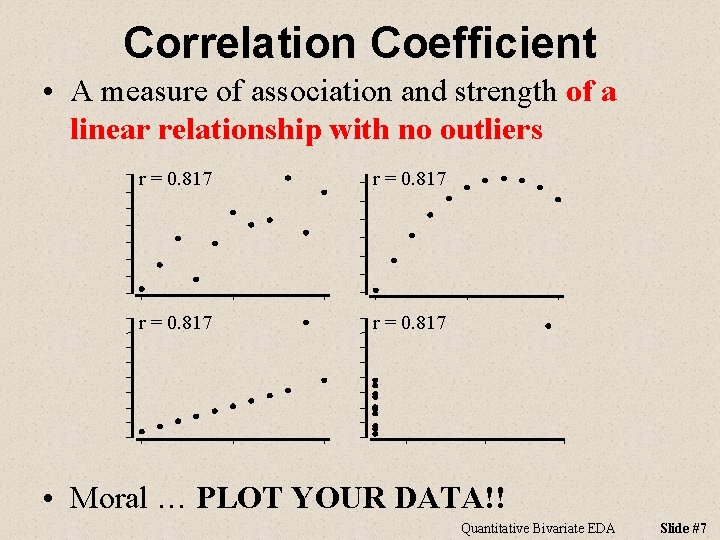
Correlation Coefficient • A measure of association and strength of a linear relationship with no outliers r = 0. 817 • Moral … PLOT YOUR DATA!! Quantitative Bivariate EDA Slide #7

• Perform a bivariate EDA from Figure 1. The relationship between the quarterly growth of GDP and the change in unemployment rate is negative, linear, and strong with no apparent outliers. I assessed strength with the correlation coefficient because of the lack of outliers and the linear form. Figure 1. Plot of the quarterly growth of GDP and change in unemployment rate for the U. S. from 1997 -2009. Quantitative Bivariate EDA Slide #8
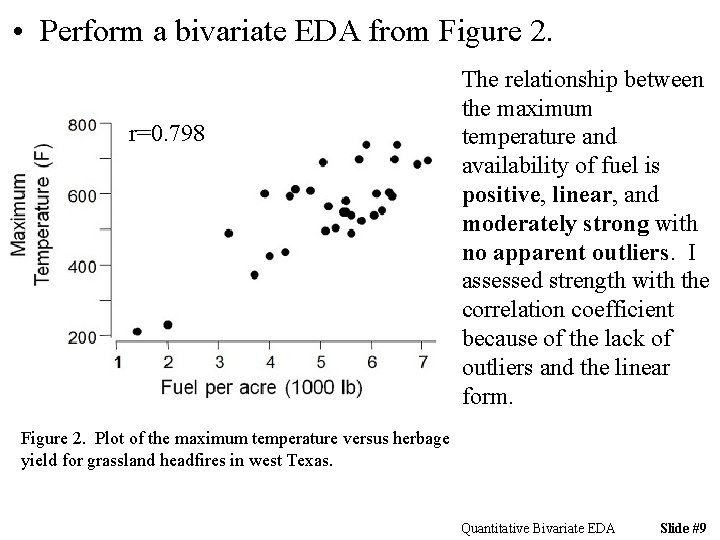
• Perform a bivariate EDA from Figure 2. r=0. 798 The relationship between the maximum temperature and availability of fuel is positive, linear, and moderately strong with no apparent outliers. I assessed strength with the correlation coefficient because of the lack of outliers and the linear form. Figure 2. Plot of the maximum temperature versus herbage yield for grassland headfires in west Texas. Quantitative Bivariate EDA Slide #9
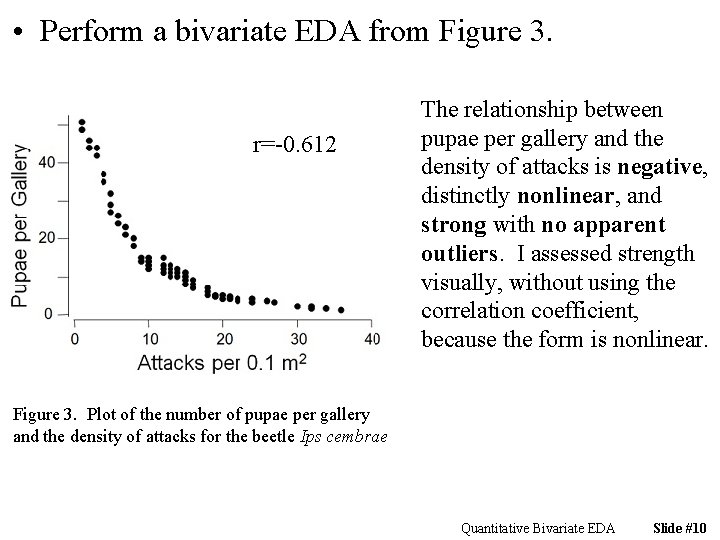
• Perform a bivariate EDA from Figure 3. r=-0. 612 The relationship between pupae per gallery and the density of attacks is negative, distinctly nonlinear, and strong with no apparent outliers. I assessed strength visually, without using the correlation coefficient, because the form is nonlinear. Figure 3. Plot of the number of pupae per gallery and the density of attacks for the beetle Ips cembrae Quantitative Bivariate EDA Slide #10
- Slides: 10