Biotechnology involves the use of living organisms in

Biotechnology involves the use of living organisms in industrial processes-particularly in agriculture, food processing and medicine. Biotechnology is a broad discipline in which biological processes, organisms, cells or cellular components are exploited to develop new technologies. New tools and products developed by biotechnologists are useful in research, agriculture, industry and the clinic. <Nature> Traditional Biotechnology Modern Biotechnology (Molecular Biotechnology-after 1970)

Selected developments in the history of molecular biotechnology • • • 1917 Karl Ereky coins the term biotechnology 1943 Penicillin is produced on an industrial scale 1953 Watson and Crick determines the structure of DNA 1961 The journal: Biotechnology & Bioengineering published 1961 -1966 Entire genetic code is deciphered 1970 First restriction endonuclease is isolated 1973 Boyer & Cohen establish recombinant DNA technology 1988 PCR method is published 1990 Human genome project is officially initiated 1996 First recombinant protein, erythropoietin, exceeds $ 1 billion in annual sales • 2001 Human genome is sequenced, 2002 human gene microarrays become commercially available
 • 台大生物技術研究中心 • 財團法人生技醫藥產業策進會(生策會)")
代表性生技相關機構 • 經濟部生技醫藥產業發展推動小組 • 財團法人生物技術開發中心 (Development Center for Biotechnology, DCB) • 台大生物技術研究中心 • 財團法人生技醫藥產業策進會(生策會) • 標竿生技出版品(生策會 www. ibmi. org. tw) • National Center for Biotechnology Information (NCBI) www. ncbi. nlm. nih. Gov Nature 期刊 →Latest research and news (www. nature. com/subjects/biotechnology)

FIGURE 1. 1 Traditional Biotechnology Products Bread, cheese, wine, and beer have been made worldwide for many centuries using microorganisms, such as yeast
")
Fundamentals of Molecular Biotechnology • • Recombinant DNA technology Chemical synthesis & amplification (PCR) Genomics & gene expression (proteins) Proteomics: mass spectral analysis Bioinformatics: computer technology Nanotechnology Unicellular & multicellular organisms as research models Nucleic-acid therapeutics
 Protein therapeuticals (monoclonal Ab) Production of")
Application of Molecular Biotechnology Molecular diagnostics (mutation, disease) Protein therapeuticals (monoclonal Ab) Production of transgenic organisms Environmental biotechnology (biomonitoring and bioremediation • Nanobiotechnology • Synthesis of commercial compounds by recombinant microorganisms (antibiotics, enzymes) • Forensic molecular biology • •

Chapter 1 Basics of biotechnology

Mendel’s Laws of Inheritance • A segment of a DNA molecule that contains the information required for the synthesis of a functional product, whether protein or RNA, is referred to as a gene. A gene can exist in different forms called alleles • One allele can be dominant over the other, recessive, allele • The first filial generation (F 1) contains offspring of the original parents • If each parent carries two copies of a gene, the parents are diploid for that gene

Mendel’s Gene Transmission • Heterozygotes have one copy of each allele • Parents in 1 st mating are homozygotes, having 2 copies of one allele • Sex cells, or gametes, are haploid, containing only 1 copy of each gene • Heterozygotes produce gametes having either allele • Homozygotes produce gametes having only one allele

The Chromosome Theory of Inheritance • Chromosomes are discrete physical entities that carry the genes • Thomas Hunt Morgan used the fruit fly, Drosophila melanogaster, to study genetics • Autosomes occur in pairs in a given individual • Sex chromosomes are identified as X and Y – Female has two X chromosomes – Male has one X and one Y chromosome
 Each parent has two alleles,")
UNN 1. 1 Relationship of Genotype and Phenotype (A) Each parent has two alleles, either two yellow or two green. Any offspring will be heterozygous, each having a yellow and a green allele. Since the yellow allele is dominant, the peas look yellow. (B) When the heterozygous F 1 offspring self-fertilize, the green phenotype re-emerges in one-fourth of the F 2 generation. Companion site for Biotechnology. by Clark Copyright © 2009 by Academic Press. All rights reserved. 12

Outline of Griffith’s Transformation Experiments 2 -13

Procedure for the Hershey-Chase Transformation Experiments 2 -14
 DNA has two strands antiparallel to each")
FIGURE 1. 3 Nucleic Acid Structure (A) DNA has two strands antiparallel to each other. The structure of the subcomponents is shown to the sides. (B) RNA is usually single-stranded and has two chemical differences from DNA. First, an extra hydroxyl group (-OH) is found at the 2’ position of ribose, and second, thymine is replaced by uracil. Companion site for Biotechnology. by Clark Copyright © 2009 by Academic Press. All rights reserved. 15

A Variety of DNA Structures • High humidity DNA is called the B-form • Lower humidity from cellular conditions to about 75% and DNA takes on the A-form – Plane of base pairs in A-form is no longer perpendicular to • When wound in a leftthe helical axis handed helix, DNA is – A-form seen when hybridize termed Z-DNA one DNA with one RNA strand in solution • One gene requires ZDNA for activation 2 -16

Purines and Pyrimidines • Adenine and guanine are related structurally to the parent molecule purine • Cytosine, thymine and uracil resemble pyrimidine 2 -17

A Trinucleotide The example trinucleotide has polarity – Top of molecule has a free 5’-phosphate group = 5’ end – Bottom has a free 3’hydroxyl group = 3’ end 2 -18

Analytical Tools Physical-chemical analysis has often used: 1. Ultracentrifugation Used to estimate size of material 2. Electrophoresis Indicated high charge-to-mass ratio 3. Ultraviolet Absorption Spectrophotometry Absorbance of UV light matched that of DNA 4. Elementary Chemical Analysis Nitrogen-to-phosphorus ratio of 1. 67, not found in protein
 Bacterial DNA is")
FIGURE 1. 4 Packaging of DNA in Bacteria and Eukaryotes (A) Bacterial DNA is supercoiled and attached to a scaffold to condense its size to fit inside the cell. (B) Eukaryotic DNA is wrapped around histones to form a nucleosome. Nucleosomes are further condensed into a 30 -nm fiber attached to proteins at MAR sites. Companion site for Biotechnology. by Clark Copyright © 2009 by Academic Press. All rights reserved. 20

13. 1 Histones • Eukaryotic cells contain 5 kinds of histones – – – H 1 H 2 A H 2 B H 3 H 4 • Each histone type isn’t homogenous – Gene reiteration – Posttranslational modification Source: Panyim and Chalkley, Arch. Biochem. & Biophys. 130, 1969, f. 6 A, p. 343.

Histones in the Nucleosome • Chemical cross-linking in solution: – H 3 to H 4 – H 2 A to H 2 B • H 3 and H 4 exist as a tetramer (H 3 -H 4)2 • Chromatin is composed of roughly equal masses of DNA and histones – Corresponds to 1 histone octamer per 200 bp of DNA – Octamer composed of: • 2 each H 2 A, H 2 B, H 3, H 4 • 1 each H 1

1. 3 The Three Domains of Life Current research theories support the division of living organisms into three domains 1. Bacteria 2. Eukaryota 3. Archaea living in the most inhospitable regions of the earth • Thermophiles tolerate extremely high temperatures • Halophiles tolerate very high salt concentrations • Methanogens produce methane as a by-product of metabolism 1 -23

FIGURE 1. 5 Hydrothermal Vent Tubeworms These hydrothermal vent tubeworms from the Pacific Ocean get energy from symbiotic bacteria that live inside them. Courtesy of National Oceanic & Atmospheric Administration/National Undersea Research Program (NURP). Companion site for Biotechnology. by Clark Copyright © 2009 by Academic Press. All rights reserved. 24
 Scanning electron micrograph of E.")
FIGURE 1. 6 Subcellular Structure of Escherichia coli (A) Scanning electron micrograph of E. coli. The rod-shaped bacteria are approximately 0. 6 microns by 1– 2 microns. Courtesy of Rocky Mountain Laboratories, NIAID, NIH. (B) Gram-negative bacteria have three structural layers surrounding the cytoplasm. The outer membrane and cytoplasmic membrane are lipid bilayers, and the cell wall is made of peptidoglycan. Unlike eukaryotes, no membrane surrounds the chromosome, leaving the DNA readily accessible to the cytoplasm. Companion site for Biotechnology. by Clark Copyright © 2009 by Academic Press. All rights reserved. 25
 Bacteria growing in liquid culture.")
FIGURE 1. 7 Bacteria are Easy to Grow (A) Bacteria growing in liquid culture. (B) Bacteria growing on agar. This photo shows a mixture of bacterial colonies from the blue/white method for screening plasmid insertions—see Chapter 3 and Fig. 3. 15 for a full explanation. (C) Fast-growing bacteria can double in numbers in short periods. Here, the number of bacteria double after approximately 45 minutes and reach a density of 5 × 10⁹ cells/m. L in about 5 hours. Companion site for Biotechnology. by Clark Copyright © 2009 by Academic Press. All rights reserved. 26

FIGURE 1. 8 The E. coli chromosome is divided into 100 map units, arbitrarily starting at the thr. ABC operon. Various genes and their locations are shown. The replication origin (ori. C) and termination zone (ter. B and ter. C) are indicated. Companion site for Biotechnology. by Clark Copyright © 2009 by Academic Press. All rights reserved. 27

FIGURE 1. 9 Plasmids Encode the Genes for Colicin Col. E 1 plasmids are extrachromosomal DNA elements that are maintained by bacteria for producing a toxin (cea gene). They also carry genes for toxin release and immunity. These plasmids have been modified to carry genes useful in genetic engineering. Companion site for Biotechnology. by Clark Copyright © 2009 by Academic Press. All rights reserved. 28

FIGURE 1. 10 Somatic versus Germline Cells During development, cells either become somatic cells, which form the body, or germline cells, which form either eggs or sperm. The germline cells are the only cells whose genes are passed on to future generations. Companion site for Biotechnology. by Clark Copyright © 2009 by Academic Press. All rights reserved. 29

FIGURE 1. 10 Somatic versus Germline Cells During development, cells either become somatic cells, which form the body, or germline cells, which form either eggs or sperm. The germline cells are the only cells whose genes are passed on to future generations. Companion site for Biotechnology. by Clark Copyright © 2009 by Academic Press. All rights reserved. 30

FIGURE 1. 11 Somatic Mutations The early embryo has the same genetic information in every cell. During division of a somatic cell, a mutation may occur that affects the organ or tissue it gives rise to. Because the mutation was isolated in a single precursor cell, other parts of the body and the germline cells will not contain the mutation. Consequently, the mutation will not be passed on to any offspring. Companion site for Biotechnology. by Clark Copyright © 2009 by Academic Press. All rights reserved. 31

FIGURE 1. 12 Structure of Yeast Cell This yeast cell, undergoing division, is starting to partition components into the bud. Eventually, the bud will grow in size and be released from the mother (lower oval), leaving a scar on the surface of the cell wall. Companion site for Biotechnology. by Clark Copyright © 2009 by Academic Press. All rights reserved. 32

FIGURE 1. 13 The 2 -Micron Plasmid of Yeast Two different forms of the 2 -micron plasmid are shown. The enzyme Flp recombinase recognizes the FRT sites and recombines them, thus flipping one half of the plasmid relative to the other half. Companion site for Biotechnology. by Clark Copyright © 2009 by Academic Press. All rights reserved. 33

FIGURE 1. 14 Alternating Haploid and Diploid Phases of Yeast Haploid cells come in two different forms, a and a. These express mating pheromones, a factor and alpha (a) factor, which attract the two forms to each other. When the pheromones bind to receptors on the opposite cell type, the two haploid cells become competent to fuse into a diploid cell. Diploid cells sporulate under growth limiting conditions. Otherwise, the diploid cells form genetic clones by budding. Companion site for Biotechnology. by Clark Copyright © 2009 by Academic Press. All rights reserved. 34

FIGURE 1. 15 Caenorhabditis elegans Courtesy of Jill Bettinger, Virginia Commonwealth University, Richmond, VA. Companion site for Biotechnology. by Clark Copyright © 2009 by Academic Press. All rights reserved. 35

FIGURE 1. 16 Life Cycle of Caenorhabditis elegans When the C. elegans sperm fuses with an egg, a small worm develops (L 1). The larva goes through multiple stages until it reaches the sexually mature adult phase. C. elegans has six different chromosomes: five autosomes and one X chromosome. The worms are diploid, with two sets of chromosomes. When the embryo has two X chromosomes, it becomes a hermaphrodite. If the embryo has only one X, it becomes a male, but males make up only 0. 05% of a normal population. The genome is 97 Mb and was completely sequenced in 1998. Approximately 27% of the genome is coding sequence with about 19, 000 genes, more than 900 of which are RNA coding genes. The average gene contains five introns and is about 3000 base pairs long. Intronic DNA accounts for 26% of the total genome. The remaining 47% of the genome is intergenic and noncoding. Companion site for Biotechnology. by Clark Copyright © 2009 by Academic Press. All rights reserved. 36

FIGURE 1. 17 Life Cycle of Drosophila melanogaster Drosophila fruit flies start as a tiny egg that develops into a worm (maggot). After a series of larval stages, the worm forms a pupa where the adult form develops. Companion site for Biotechnology. by Clark Copyright © 2009 by Academic Press. All rights reserved. 37

FIGURE 1. 22 Arabidopsis thaliana The plant most used as a model for molecular biology research is A. thaliana, a member of the mustard family (Brassicaceae). Courtesy of Dr. Jeremy Burgess, Science Photo Library. Companion site for Biotechnology. by Clark Copyright © 2009 by Academic Press. All rights reserved. 38

FIGURE 1. 18 Polytene Chromosome Fluorescent staining of polytene chromosome from Drosophila. Companion site for Biotechnology. by Clark Copyright © 2009 by Academic Press. All rights reserved. 39

FIGURE 1. 19 The Zebrafish, Danio rerio This fish is used as a model vertebrate to study genetics, cell biology, and developmental biology. Companion site for Biotechnology. by Clark Copyright © 2009 by Academic Press. All rights reserved. 40

FIGURE 1. 20 Human He. La Cells Grown in Vitro He. La cells were taken from the tumor of Henrietta Lacks, a woman suffering from cervical cancer, in the 1950 s and have been cultured continuously ever since. (A) Viewed under phase contrast. (B) Viewed under differential interference contrast. Courtesy of Michael W. Davidson, Optical Microscopy Group, National High Magnetic Field Laboratory, Florida State University, Tallahassee, Florida. Companion site for Biotechnology. by Clark Copyright © 2009 by Academic Press. All rights reserved. 41
 Hv. T 1 cells from tobacco")
FIGURE 1. 21 Insect Cells in Culture (A) Hv. T 1 cells from tobacco budworm testes are strongly attached to the surface of the dish. (B) TN 368 cells from cabbage looper ovary are only loosely attached. Courtesy of Dwight E. Lynn, Insect Biocontrol Lab, USDA, Beltsville, MD. Companion site for Biotechnology. by Clark Copyright © 2009 by Academic Press. All rights reserved. 42

FIGURE 1. 23 Virus Life Cycle The life cycle of a virus starts when the viral DNA or RNA enters the host cell. Once inside, the virus uses the host cell to manufacture more copies of the virus genome and to make the protein coats for assembly of virus particles. Once multiple copies of the virus have been assembled, the host cell bursts open, allowing the progeny to escape and find other hosts to invade Companion site for Biotechnology. by Clark Copyright © 2009 by Academic Press. All rights reserved. 43

FIGURE 2. 6 Components of the lac Operon The lac operon consists of three structural genes, lac. ZYA, which are all transcribed from a single promoter, designated lac. P. The promoter is regulated by binding of the repressor at the operator, lac. O, and of Crp protein at the Crp site. Note that in reality, the operator partly overlaps both the promoter and the lac. Z structural gene. The single lac m. RNA is translated to produce the Lac. Z, Lac. Y, and Lac. A proteins. The lac. I gene that encodes the Lac. I repressor has its own promoter and is transcribed in the opposite direction from the lac. ZYA operon. Companion site for Biotechnology. by Clark Copyright © 2009 by Academic Press. All rights reserved. 44

FIGURE 1. 24 Examples of Different Viruses come in a variety of shapes and sizes that determine whether the entire virus or only its genome enters the host cells. Companion site for Biotechnology. by Clark Copyright © 2009 by Academic Press. All rights reserved. 45

Question 1 The genetic material of viruses can be A. B. C. D. E. ss. RNA ds. DNA ss. DNA All of the above

FIGURE 1. 25 Retroviral Life Cycle Retroviral genomes are made of positive RNA. Once the RNA enters the host, a DNA copy of the genome is made using reverse transcriptase. The original RNA strand is then degraded and replaced with DNA. Then the entire double-stranded DNA version of the retrovirus genome can integrate into the host genome. Companion site for Biotechnology. by Clark Copyright © 2009 by Academic Press. All rights reserved. 47

Question 2 Reverse Transcriptase is: A. B. C. D. An RNA-dependent DNA polymerase A DNA-dependent RNA polymerase An RNA polymerase that uses a DNA template A DNA-dependent DNA polymerase

FIGURE 1. 26 Conjugation in E. coli Bacteria with a transferable plasmid can make a sex pilus that attaches to a recipient cell. When the two cells touch, a conjugation bridge forms, and a copy of the plasmid transfers from one cell to another. If the plasmid is integrated into the donor cell genome, segments of genomic DNA may also pass across. Companion site for Biotechnology. by Clark Copyright © 2009 by Academic Press. All rights reserved. 49
 Replicative transposition leaves")
FIGURE 1. 27 Transposons Move by Replicative or Conservative Transposition (A) Replicative transposition leaves the original transposon in its original place, and a copy is inserted at another site within the host genome. (B) During conservative transposition, the original transposon excises from its original site and integrates at a different location. Companion site for Biotechnology. by Clark Copyright © 2009 by Academic Press. All rights reserved. 50

Chapter 2 DNA, RNA, and Protein

FIGURE 2. 2 The Structure of a Typical Genes are regions of DNA that are transcribed to give RNA. In most cases, the RNA is translated into protein, but some RNA is not. The gene has a promoter region plus transcriptional start and stop points that flank the actual message. After transcription, the RNA has a 5’ untranslated region (5’ UTR) and 3’ untranslated region (3’ UTR), which are not translated; only the ORF is translated into protein. Companion site for Biotechnology. by Clark Copyright © 2009 by Academic Press. All rights reserved. 52
 does not")
Structural Relationship Between Gene, m. RNA and Protein Transcription of DNA (top) does not begin or end at same places as translation – Transcription begins at first G – Translation begins 9 -bp downstream – This m. RNA has a 9 -bp leader or 5’-untranslated region / 5’-UTR 3 -53

DNA Size and Genetic Capacity How many genes are in a piece of DNA? – Start with basic assumptions • Gene encodes protein • Protein is abut 40, 000 D – How many amino acids does this represent? • • Average mass of an amino acid is about 110 D Average protein – 40, 000 / 110 = 364 amino acids Each amino acid = 3 DNA base pairs 364 amino acids requires 1092 base pairs 2 -54

DNAs of Various Sizes and Shapes • Phage DNA is typically circular • Some DNA will be linear • Supercoiled DNA coils or wraps around itself like a twisted rubber band 2 -55

DNA Content and the C-Value Paradox • C-value is the DNA content per haploid cell • Might expect that more complex organisms need more genes than simple organisms • For the mouse or human compared to yeast this is correct • Yet the frog has 7 times more per cell than humans 2 -56

C-Value Paradox • The observation that more complex organisms will not always need more genes than simple organisms is called the C-value paradox • Most likely explanation for the paradox is that DNA that does not code for genes is present when the less complex organism has more DNA 2 -57

FIGURE 2. 3 RNA Polymerase Synthesizes RNA at the Transcription Bubble RNA polymerase is a complex enzyme with two grooves. The first groove holds a single strand of DNA, and the second groove holds the growing RNA polymerase travels down the DNA, adding ribonucleotides that complement each of the bases on the DNA template strand. Companion site for Biotechnology. by Clark Copyright © 2009 by Academic Press. All rights reserved. 58

Question 3 RNA polymerase synthesizes: A. B. C. D. A DNA copy of the gene using the antisense strand as template An RNA copy of the gene using the antisense strand as template A DNA copy of the sequence from promoter to terminator

FIGURE 2. 4 Monocistronic versus Polycistronic Eukaryotes transcribe genes in single units, where each m. RNA encodes for only one protein. Prokaryotes transcribe genes in operons as one single m. RNA, and then translate the proteins as separate units. Companion site for Biotechnology. by Clark Copyright © 2009 by Academic Press. All rights reserved. 60

Making the RNA • The strand used by RNA polymerase is called the template (noncoding or antisense) and is complementary to the resulting m. RNA. The opposite strand of DNA is called the coding strand (nontemplate or sense strand) and its sequence is identical to the RNA except for the replacement of T with U in RNA. In vitro transcription of a c. DNA fragment placed behind a promotor using a viral polymerase can produce antisense or sense m. RNA without the requirement of transcription factors. The sequence of antisense m. RNA is complementary to that of sense m. RNA produced in living organisms.

FIGURE 2. 5 Eukaryotic Transcription Many different general transcription factors help RNA polymerase II find the TATA and initiator box region of a eukaryotic promoter. Companion site for Biotechnology. by Clark Copyright © 2009 by Academic Press. All rights reserved. 62

Four Distinct Preinitiation Complexes • TFIID with help from TFIIA binds to the TATA box forming the DA complex • TFIIB binds next generating the DAB complex • TFIIF helps RNA polymerase bind to a region from -34 to +17, now it is DABPol. F complex • Last the TFIIE then TFIIH bind to form the complete preinitiation complex = DABPol. FEH • In vitro the participation of TFIIA seems to be optional 11 -63
 are")
Class II Promoters • Promoters recognized by RNA polymerase II (class II promoters) are similar to prokaryotic promoters • Considered to have two parts: – Core promoter having 4 elements – Upstream promoter element 10 -64

Core Promoter Elements – TATA Box • TATA box – Found on the nontemplate strand – Very similar to the prokaryotic -10 box – There are frequently TATA-less promoters • Housekeeping genes that are constitutively active in nearly all cells as they control common biochemical pathways • Developmentally regulated genes 10 -65

The Class II Preinitiation Complex • Class II preinitiation complex contains: – Polymerase II – 6 general transcription factors: • • • TFIIA TFIIB TFIID TFIIE TFIIH • The transcription factors (TF) and polymerase bind the preinitiation complex in a specific order 11 -66
 m. RNA")
• Detection of heat shock protein (Hsc 70 and Hsp 70) m. RNA expression in zebrafish embryos by whole mount in situ hybridization-an example illustrating the use of antisense riboprobes obtained from in vitro transcription of cloned c. DNAs using viral RNA polymerases

36 hpf 60 hpf 84 hpf H 108 hpf hsc 70 hsp 70 Analysis of heat shock cognate 70 (Hsc 70) and heat shock protein 70 (Hsp 70) m. RNA expressions in developing zebrafish using whole mount in situ hybridization. H stands for heat shock treatment at 37℃ for 30 min. (Hsu et al. 2010)

Discovery of the Operon During the 1940 s and 1950 s, Jacob and Monod studied the metabolism of lactose by E. coli • Three enzyme activities / three genes were induced together by galactosides • Constitutive mutants need no induction, genes are active all the time • Merodiploids are partial diploid bacteria 7 -69

FIGURE 2. 7 Control of Lactose Operon The lactose operon is turned on only when glucose is absent but lactose is present. When glucose is available, the global activator protein, Crp, does not activate binding of RNA polymerase. When there is no glucose, Crp binds to the promoter and stimulates RNA polymerase to bind. The lack of lactose keeps Lac. I protein bound to the operator site and prevents RNA polymerase from transcribing the operon. Only when lactose is present is Lac. I released from the DNA. Companion site for Biotechnology. by Clark Copyright © 2009 by Academic Press. All rights reserved. 70

Question 4 An operon is: A. B. C. D. a eukaryotic gene regulation unit. a cluster of genes that share the same promoter. a cluster of genes that have different promoters. a cluster of genes that are transcribed as individual m. RNAs from a single promoter.

Catabolite Repression of the lac Operon • When glucose is present, lac operon is in a relatively inactive state • Selection in favor of glucose attributed to role of a breakdown product, catabolite • Process known as catabolite repression uses a breakdown product to repression the operon 7 -72

Positive Control of lac Operon • Positive control of lac operon by a substance sensing lack of glucose that responds by activating lac promoter – The concentration of nucleotide, cyclic-AMP, rises as the concentration of glucose drops 7 -73

Question 5 A high level of transcription from the lac operon can be achieved under the following conditions: A. B. C. D. High glucose, High c. AMP, High lactose Low glucose, Low c. AMP, Low lactose High glucose, Low c. AMP, Low lactose Low glucose, High c. AMP, High lactose

Proposed CAP-c. AMP Activation of lac Transcription • The CAP-c. AMP dimer binds to its target site on the DNA • The a. CTD (a-carboxy terminal domain) of polymerase interacts with a specific site on CAP • Binding is strengthened between promoter and polymerase 7 -75
 of lac operon binds the")
Inducer of the lac Operon • Inducer (one molecule) of lac operon binds the repressor • The inducer is allolactose, an alternative form of lactose 7 -76

FIGURE 2. 8 Structures of Lactose, allo-Lactose, and IPTG is a nonmetabolizable analog of the lactose operon inducer, allo-lactose. β-galactosidase cannot break the sulfur linkage, and therefore, does not cleave IPTG in two. Companion site for Biotechnology. by Clark Copyright © 2009 by Academic Press. All rights reserved. 77

FIGURE 2. 9 Model of Two-Component Regulatory System The two-component regulatory system includes a membrane component (sensor kinase) and a cytoplasmic component (regulator). Outside the cell, the sensor domain of the kinase detects an environmental change, which leads to phosphorylation of the transmitter domain. The response regulator protein receives the phosphate group, and as a consequence, changes configuration so as to bind the DNA. Companion site for Biotechnology. by Clark Copyright © 2009 by Academic Press. All rights reserved. 78
 One domain of the")
FIGURE 2. 10 Transcription Factors Have Two Independent Domains (A) One domain of the GAL 4 transcription factor normally binds to the GAL 4 DNA recognition sequence and the other binds the transcription apparatus. (B) If the Lex. A sequence is substituted for the GAL 4 site, the transcription factor does not recognize or bind the DNA. (C) An artificial protein made by combining a Lex. A binding domain with a GAL 4 activator domain will not recognize the GAL 4 site, but (D) will bind to the Lex. A recognition sequence and activate transcription. Thus, the GAL 4 activator domain acts independently of any particular recognition sequence. It works as long as it is held in close contact with the DNA. Companion site for Biotechnology. by Clark Copyright © 2009 by Academic Press. All rights reserved. 79

FIGURE 2. 11 Somatic Mutations The early embryo has the same genetic information in every cell. During division of a somatic cell, a mutation may occur that affects the organ or tissue it gives rise to. Because the mutation was isolated in a single precursor cell, other parts of the body and the germline cells will not contain the mutation. Consequently, the mutation will not be passed on to any offspring. Companion site for Biotechnology. by Clark Copyright © 2009 by Academic Press. All rights reserved. 80

Enhancers • Enhancers are nonpromoter DNA elements that bind protein factors and stimulate transcription – Can act at a distance – Originally found in eukaryotes – Recently found in prokaryotes 9 -81
 AP-1 is a eukaryotic transcription factor")
FIGURE 2. 12 Eukaryotic Regulation of Transcription (A) AP-1 is a eukaryotic transcription factor that consists of Fos and Jun. These two proteins interact through their leucine zippers. (B) To activate transcription, AP-1 must itself first be activated by phosphorylation by the kinase, JNK. Only then does Jun stimulate RNA polymerase II to transcribe the appropriate genes. Companion site for Biotechnology. by Clark Copyright © 2009 by Academic Press. All rights reserved. 82

FIGURE 2. 13 DNA Methylation Induces Gene Silencing Gene expression in eukaryotes can be turned off by chromatin condensation. First, the area to be silenced is methylated. The methyl groups attract methyl cytosine binding protein, which in turn attracts histone deacetylases. Once HDAC removes the acetyl groups from the histone tails, the histones aggregate tightly. The closeness of histones excludes any DNA binding proteins and hence turns off gene expression in the area. Companion site for Biotechnology. by Clark Copyright © 2009 by Academic Press. All rights reserved. 83

Question 6 Eukaryotic transcription can be controlled by: A. B. C. D. E. F. Methylation of DNA causing a decrease in expression of these genes. Histone mediated condensation of DNA causing a decrease in expression. Enhancer regions located several thousand bases upstream of the promoter. Promoter sequences. antisense RNA All of the above are true.

FIGURE 2. 14 Processing Eukaryotic m. RNA Eukaryotic RNA is processed before exiting the nucleus for translation into protein. A guanine with a methyl group is added to the 5’ end of the message, a poly(A) tail is added to the 3’ end, and the introns are spliced out. These modifications stabilize the message and make it much shorter than the original RNA transcribed from the DNA. Companion site for Biotechnology. by Clark Copyright © 2009 by Academic Press. All rights reserved. 85

FIGURE 2. 15 The Genetic Code The 64 codons found in m. RNA are shown with their corresponding amino acids. As usual, bases are read from 5’ to 3’ so that the first base is at the 5’ end of the codon. Three codons (UAA, UAG, UGA) have no cognate amino acid but signal stop. AUG (encoding methionine) and, much less often, GUG (encoding valine) act as start codons. To locate a codon, find the first base in the vertical column on the left, the second base in the horizontal row at the top, and the third base in the vertical column on the right. Companion site for Biotechnology. by Clark Copyright © 2009 by Academic Press. All rights reserved. 86

Deviations from “Universal” Genetic Code 18 -87

FIGURE 2. 16 Structure of t. RNA Allows Wobble in the Third Position Transfer RNA recognizes the codons along m. RNA and presents the correct amino acid for each codon. The first position of the anticodon on t. RNA matches the third position of the codon. Companion site for Biotechnology. by Clark Copyright © 2009 by Academic Press. All rights reserved. 88
")
t. RNA Charging • All t. RNAs have same 3 bases at 3’-end (CCA) • Terminal adenosine is the target for charging with amino acid • Amino acid attached by ester bond between – Its carboxyl group – 2’- or 3’-hydroxyl group of terminal adenosine of t. RNA 17 -89

Aminoacyl-t. RNA Synthetase Activity 17 -90
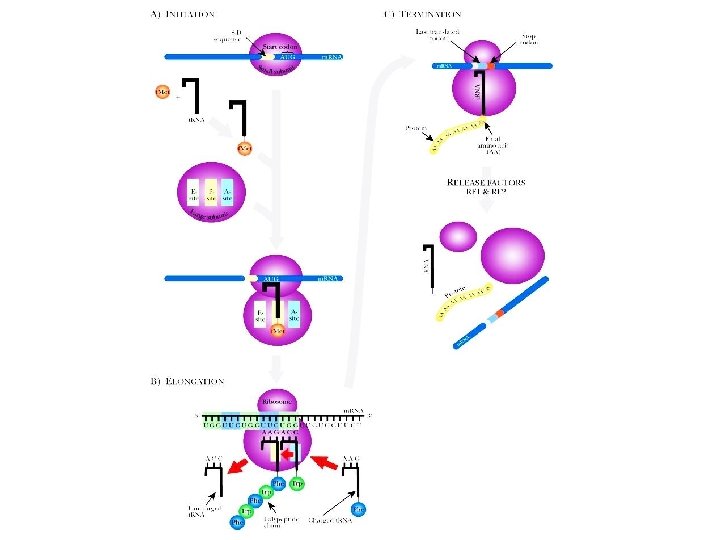
 Initiation of translation begins with the association")
FIGURE 2. 17 Translation in Prokaryotes (A) Initiation of translation begins with the association of the small ribosome subunit with the Shine-Dalgarno sequence (S-D sequence) on the m. RNA. Next, the initiator t. RNA that reads AUG is charged with f. Met. The charged initiator t. RNA associates with the small ribosome subunit and finds the start codon. Assembly is helped by initiation factors (IF 1, IF 2, and IF 3)—not shown. (B) During elongation peptide bonds are formed between the amino acids at the A-site and the P-site. The movement of the ribosome along the m. RNA and addition of a new t. RNA to the A-site are controlled by elongation factors (also not shown). (C) Termination requires release factors. The various components dissociate. The completed protein folds into its proper three-dimensional shape. site for Companion Biotechnology. by Clark Copyright © 2009 by Academic Press. All rights reserved. 91
 Assembly of the small subunit plus initiator")
FIGURE 2. 18 Translation in Eukaryotes (A) Assembly of the small subunit plus initiator Met-t. RNA involves the binding of factors e. IF 3 and e. IF 2. (B) The cap binding protein of e. IF 4 attaches to the m. RNA before it joins the small subunit. (C) The m. RNA binds to the small subunit via cap binding protein and the 40 S initiation complex is assembled. (D) Assembly of the large subunit requires factor e. IF 5. After assembly, e. IF 2 and e. IF 3 depart. Companion site for Biotechnology. by Clark Copyright © 2009 by Academic Press. All rights reserved. 93

Question 7 In prokaryotes, translation begins when: A. B. C. D. E. The small subunit of the ribosome binds to the first codon. The large subunit of the ribosome binds to the first codon. The small subunit of the ribosome binds to the promoter. The small subunit of the ribosome binds in a region called the ribosomal binding site None of the above
specific amino acid attachment")
Question 8 Amino-acyl-t. RNA synthetases catalyze the reaction of a: A)specific amino acid attachment to the 5'-OH at the 5'-CCA of a specific t. RNA. B)specific amino acid attachment to the 3'-OH at the 3'-CCA of a specific t. RNA. C)specific t. RNA with ATP to form a so called "charged t. RNA" that interacts with a specific site on m. RNA. D)all of the above. E)none of the above.

FIGURE 2. 19 Human Mitochondrial DNA The mitochondrial DNA of humans contains the genes for ribosomal RNA (16 S and 12 S), some transfer RNAs (single-letter amino acid codes mark these on the genome), and some proteins of the electron transport chain. Companion site for Biotechnology. by Clark Copyright © 2009 by Academic Press. All rights reserved. 96

Chapter 3 Recombinant DNA technology
 Photo of electrophoresis supplies. Electrophoresis chamber holds")
FIGURE 3. 1 Electrophoresis of DNA (A) Photo of electrophoresis supplies. Electrophoresis chamber holds an agarose gel in the center portion, and the rest of the tank is filled with buffer solution. The red and black leads are then attached to an electrical source. Fisher. Biotech Horizontal Electrophoresis Systems, Midigel System; Standard; 13 × 16 -cm gel size; 800 m. L buffer volume; Model No. FB-SB-1316. (B) Agarose gel separation of DNA. To visualize DNA, the agarose gel containing the separated DNA fragments is soaked in a solution of ethidium bromide, which intercalates between the bases of DNA. Under UV light, the DNA bands fluoresce a bright orange color. The size of the fragments can be calculated by comparing them to the standards on the right. Companion site for Biotechnology. by Clark Copyright © 2009 by Academic Press. All rights reserved. 98

FIGURE 3. 2 Type II Restriction Enzymes—Blunt versus Sticky Ends Hpa. I is a blunt end restriction enzyme, that is, it cuts both strands of DNA in exactly the same position. Eco. RI is a sticky end restriction enzyme. The enzyme cuts between the G and A on both strands, which generates four base-pair overhangs on the ends of the DNA. Since these ends may base pair with complementary sequences, they are considered “sticky. ” Companion site for Biotechnology. by Clark Copyright © 2009 by Academic Press. All rights reserved. 99

Question 9 • All of the following statements about gel electrophoresis are true EXCEPT: A. Agarose separates DNA molecules based on charge. B. Ethidium bromide is used to visualize DNA. C. Polyacrylamide gels are used for DNA sequencing. D. DNA migrates toward the positive electrode because it is negatively charged. E. Molecular weight standards are used to determine the size of DNA molecules.

Naming Restriction Endonucleases Restriction endonucleases are named using the 1 st three letters of their name from the Latin name of their source microorganism Hind III – First letter is from the genus H from Haemophilus – Next two letters are the 1 st two letters of the species name in from influenzae – Sometimes the strain designation is included “d” from strain Rd – If microorganism produces only 1 restriction enzyme, end the name with Roman numeral I Hind I – If more than one restriction enzyme is produced, the others are numbered sequentially II, IV, etc. 4 -101

Restriction-Modification System • What prevents these enzymes from cutting up the host DNA? – They are paired with methylases – Theses enzymes recognize, methylate the same site • Together they are called a restriction-modification system, R-M system • Methylation protects DNA, after replication the parental strand is already methylated 4 -102

Question 10 Restriction enzymes: A. Help protect bacteria from foreign DNA. B. Always generate “sticky ends. ” C. Will not cut at a recognition site if the DNA is methylated. D. a + c E. All of the above.

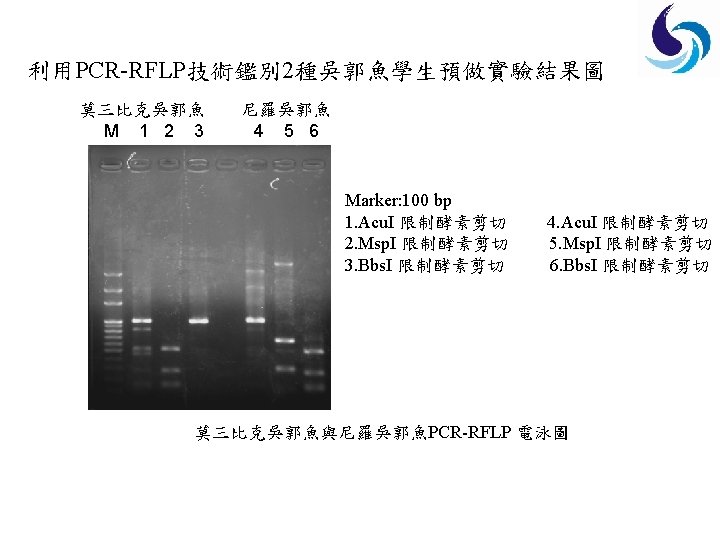
FIGURE 3. 3 Compatible Overhangs Are Linked Using DNA Ligase Bam. HI and Bgl. II generate the same overhanging or sticky ends: a 3’-CTAG-5’ overhang plus a 5’-GATC-3’ overhang. These are complementary and base pair by hydrogen bonding. The breaks in the DNA backbones are sealed by T 4 DNA ligase, which hydrolyzes ATP to energize the reaction. Figure A RFLP Analysis DNA from related organisms shows small differences in sequence that cause changes in restriction sites. In the example shown, cutting a segment of DNA from the first organism yields six fragments of different sizes (labeled a–f on the gel). If the equivalent region of DNA from a related organism were digested with the same enzyme, a similar pattern would be expected. Here a singlenucleotide difference is present, which eliminates one of the restriction sites. Consequently, digesting this DNA produces only five fragments. Fragments c and d are no longer seen, but form a new band labeled cd. Companion site for Biotechnology. by Clark Copyright © 2009 by Academic Press. All rights reserved. 105
 All nucleic acids absorb UV")
FIGURE 3. 4 Determining the Concentration of DNA (A) All nucleic acids absorb UV light via the aromatic rings of the bases. Stacked nucleotides (on the left) absorb less UV than scattered bases (on the right) because of the ordered structure. (B) The concentration of DNA in solution is determined by measuring the absorbance of UV light at 260 nm. Graphing the absorbance versus concentration shows a linear relationship. The concentration of an unknown sample can be determined by measuring its absorbance at 260 nm, then extrapolating its concentration. Companion site for Biotechnology. by Clark Copyright © 2009 by Academic Press. All rights reserved. 106

FIGURE 3. 5 Radioactively Labeled DNA can be synthesized with radioactive precursor nucleotides. These nucleotides have 32 P (rather than nonradioactive 31 P phosphorus) or 35 S (replacing oxygen) in the phosphate backbone. Companion site for Biotechnology. by Clark Copyright © 2009 by Academic Press. All rights reserved. 107
 is dried and")
FIGURE 3. 6 Autoradiography A gel containing radioactive DNA (or RNA) is dried and a piece of photographic film is laid over the top. The two are loaded into a cassette case that prevents light from entering. After some time (hours to days), the film is developed and dark lines appear where the radioactive DNA was present. Companion site for Biotechnology. by Clark Copyright © 2009 by Academic Press. All rights reserved. 108
 Fluorescent tagging of DNA. During synthesis,")
FIGURE 3. 7 Fluorescent Labeling of DNA (A) Fluorescent tagging of DNA. During synthesis, a nucleotide linked to a fluorescent tag is incorporated at the 3’ end of the DNA. A beam of light excites the fluorescent tag, which in turn, releases light of a longer wavelength. (B) Energy levels in fluorescence. The fluorescent molecule attached to the DNA has three different energy levels, S 0, S 1’, and S 1. The S 0 or ground state is the state before exposure to light. When the fluorescent molecule is exposed to a light photon, the fluorescent tag absorbs the energy and enters the first excited state, S 1’. Between S 1’ and S 1, the fluorescent tag relaxes slightly, but doesn’t emit any light. Eventually the high-energy state releases its excess energy by emitting a longer wavelength photon. This release of fluorescence returns the molecule to the ground state. Companion site for Biotechnology. by Clark Copyright © 2009 by Academic Press. All rights reserved. 109

FIGURE 3. 8 Labeling and Detecting DNA with Biotin DNA can be synthesized in vitro with a uracil nucleotide linked with a biotin molecule. The biotin can be visualized by adding an avidin/alkaline phosphatase conjugate. The avidin half binds to biotin and the alkaline phosphatase half removes phosphates from different substrates. In this figure, alkaline phosphatase removes phosphate from X-Phos to form a blue dye. Companion site for Biotechnology. by Clark Copyright © 2009 by Academic Press. All rights reserved. 110

FIGURE 3. 10 Capillary Action Transfers DNA from Gel to Membrane Single-stranded DNA from a gel will transfer to the membrane. The filter paper wicks buffer from the tank, through the gel and membrane, and into the paper towels. As the buffer liquid moves, the single-stranded DNA also travels from the gel and sticks to the membrane. The weight on top of the setup keeps the membrane and gel in contact and helps wick the liquid from the tank. Companion site for Biotechnology. by Clark Copyright © 2009 by Academic Press. All rights reserved. 111

FIGURE 3. 11 Hybrid DNA Molecules Can Detect Related Sequences in Southern Blots Southern blotting requires the target DNA to be cut into smaller fragments and run on an agarose gel. The fragments are denatured chemically to give single strands, and then transferred to a nylon membrane. A radioactive probe (also single-stranded) is incubated with the membrane at a temperature that allows hybrids (with some mismatches) to form. When photographic film is placed over the top of the membrane, the location of the radioactive hybrid molecules is revealed. Companion site for Biotechnology. by Clark Copyright © 2009 by Academic Press. All rights reserved. 112

FIGURE 3. 12 Dot Blot Dot blots begin by spotting DNA or RNA samples onto a nylon membrane. Often, different concentrations of the sample are dotted side by side. The membrane is incubated with a radioactive probe and then exposed to photographic film. Samples that contain DNA or RNA complementary to the probe will leave a black spot on the film. Figure B Zoo Blot A specialized form of Southern blotting, called zoo blotting, is used to distinguish coding DNA from noncoding regions. The target DNA includes several samples of genomic DNA from different animals, hence the term “zoo. ” The probe is a segment of human DNA that may or may not be from a coding region. Since base sequences of noncoding DNA mutate and change rapidly, whereas coding sequences do not mutate as rapidly, a probe that recognizes genomic DNA from many different organisms is usually a coding region. On the left, the only hybrid seen was between the probe and the human DNA; therefore, the probe is probably noncoding. In the example on the right, the probe binds to related sequences in other animals; therefore, this probe is probably from a coding region. Companion site for Biotechnology. by Clark Copyright © 2009 by Academic Press. All rights reserved. 113
 and (B) FISH of")
FIGURE 3. 13 Gene Location on Chromosomes by FISH (A) and (B) FISH of interphase nuclei with a dual-color DNA probe that shows RUNX 1 (= AML 1) in red and TEL (telomerase) in green. (A) Patient 1 showed multiple RUNX 1 signals and lacked one TEL signal (arrow). (B) Patient 2 also showed extra copies of RUNX 1, but had two normal TEL signals (arrows). (C) Partial GTG-banding karyotype and CGH profile of chromosomes 21 from both patients, showing that the amplification threshold is exceeded for the 21 q 22 region where RUNX 1 is located. From: Garcia-Casado et al. (2006). High-level amplification of the RUNX 1 gene in two cases of childhood acute lymphoblastic leukemia. Cancer Genet Cytogenet 170, 171– 174. Reprinted with permission. Companion site for Biotechnology. by Clark Copyright © 2009 by Academic Press. All rights reserved. 114

FIGURE 3. 14 Typical Polylinker or Multiple Cloning Site The restriction enzyme sites within the polylinker region are unique. This ensures that the plasmid is only cut once by each restriction enzyme. Companion site for Biotechnology. by Clark Copyright © 2009 by Academic Press. All rights reserved. 115

Bacterial Transformation • Traditional method involves incubating bacterial cells in concentrated calcium salt solution – The solution makes the cell membrane leaky, permeable to the plasmid DNA • Newer method uses high voltage to drive the DNA into the cells in process called electroporation 4 -116
 Insertional inactivation. Cells with an insert")
FIGURE 3. 15 Detecting Inserts in Plasmids (A) Insertional inactivation. Cells with an insert become sensitive to the second antibiotic. Cells without an insert remain resistant to the antibiotic. (B) Alpha complementation refers to the ability of β-galactosidase to be expressed as two protein fragments, which assemble to form a functional protein. In cells without an insert in the plasmid, β-galactosidase is active and splits X-gal to form a blue dye. In cells with an insert, the alpha fragment is not made and β-galactosidase is inactive. These cells remain white on media with X-gal. Companion site for Biotechnology. by Clark Copyright © 2009 by Academic Press. All rights reserved. 117
 Typical bacterial cloning vector. This vector has")
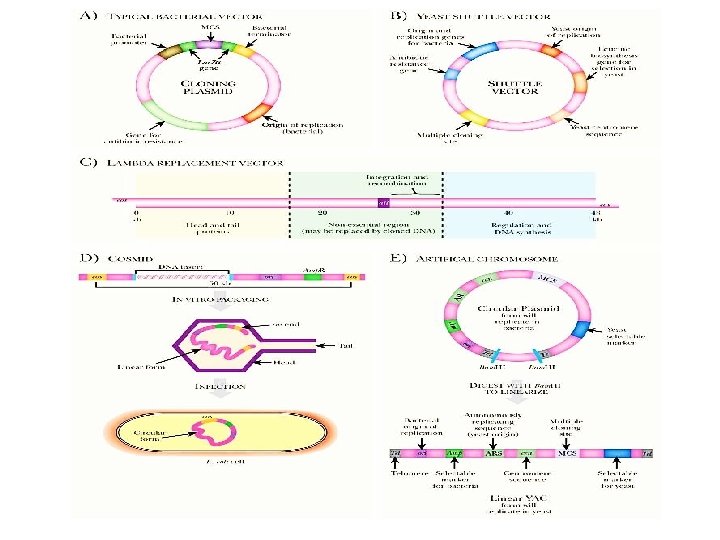
FIGURE 3. 16 Various Cloning Vectors (A) Typical bacterial cloning vector. This vector has bacterial sequences to initiate replication and transcription. In addition, it has a multiple cloning site embedded within the lac. Z α gene so that the insert can be identified by alpha-complementation. The antibiotic resistance gene allows the researcher to identify any E. coli cells that have the plasmid. (B) Yeast shuttle vector. This vector can survive in either bacteria or yeast because it has both yeast and bacterial origin of replication, a yeast centromere, and selectable markers for yeast and bacteria. As with most cloning vectors, there is a polylinker. (C) Lambda replacement vectors. Because lambda phage is easy to grow and manipulate, its genome has been modified to accept foreign DNA inserts. The region of the genome shown in green is nonessential for lambda growth and packaging. This region can be replaced with large inserts of foreign DNA (up to about 23 kb). (D) Cosmids are small multicopy plasmids that carry cos sites. They are linearized and cut so that each half has a cos site (not shown). Next, foreign DNA is inserted to relink the two halves of the cosmid DNA. This construct is packaged into lambda virus heads and used to infect E. coli. (E) Artificial chromosomes. Yeast artificial chromosomes have two forms, a circular form for growing in bacteria and a linear form for growing in yeast. The circular form is maintained like any other plasmid in bacteria, but the linear form must have telomere sequences to be maintained in yeast. The linear form can hold up to 2000 kb of cloned DNA and is very useful for genomics research. Companion site for Biotechnology. by Clark Copyright © 2009 by Academic Press. All rights reserved. 118

Question 11 • Cloning is the insertion of a DNA fragment into the proper cloning vector—often times a plasmid. Usually, the fragment is cloned into the _____, and the presence of the fragment is detected due to _____ of another gene. A. Construct; recombination B. Multiple cloning site; insertional inactivation C. Construct; complementation D. Polylinker; hybridization E. None of the above

Question 12 • Which of the following cloning vectors can hold the largest amount of foreign DNA? A. Bacterial plasmids B. Cosmids C. Bacteriophage artificial chromosomes D. Bacterial artificial chromosomes E. Yeast artificial chromosomes •

Question 13 What is the most logical sequence of steps for splicing foreign DNA into a plasmid and inserting the plasmid into a bacterium? I. III. IV. V. Transform bacteria with recombinant DNA molecule. Cut the plasmid DNA using restriction enzymes. Extract plasmid DNA from bacterial cells. Hydrogen-bond the plasmid DNA to nonplasmid DNA fragments. Use ligase to seal plasmid DNA to nonplasmid DNA. ______ A) I, IV, III, V B) III, IV, V, I C) IV, V, I, III D) II, III, V, I E) III, IV, V, I, II

FIGURE 3. 17 In Vitro Packaging A lambda cloning vector containing cloned DNA must be packaged in a phage head before it can infect E. coli. First, one culture of E. coli cells is infected with a mutant lambda that lacks the gene for one of the head proteins called E. A different culture of E. coli is infected with a different mutant, which lacks the phage head protein D. The two cultures are induced to lyse, which releases the tails, assembly proteins, and head proteins, but no complete heads because of the missing proteins. When these are mixed with a lambda replacement vector, the three spontaneously form complete viral particles containing DNA. These are then used to infect E. coli. Companion site for Biotechnology. by Clark Copyright © 2009 by Academic Press. All rights reserved. 123

FIGURE 3. 18 Transformation Bacterial cells are able to take up recombinant plasmids by incubation in calcium on ice. After a brief heat shock, some of the bacteria take up the plasmid. Companion site for Biotechnology. by Clark Copyright © 2009 by Academic Press. All rights reserved. 124

FIGURE 3. 19 Creating a DNA Library Genomic DNA from the chosen organism is first partially digested with a restriction enzyme that recognizes a four base-pair sequence. Partial digestions are preferred because some of the restriction enzyme sites are not cut, and larger fragments are generated. If every recognition site were cut by the restriction enzyme, then the genomic DNA would not contain many whole genes. The genomic fragments are cloned into an appropriate vector, and transformed and maintained in bacteria. Companion site for Biotechnology. by Clark Copyright © 2009 by Academic Press. All rights reserved. 125

FIGURE 3. 20 Screening a Library with DNA Probe First, bacterial colonies containing the library inserts are grown and plated on large, shallow agar-filled dishes. Many different colonies are plated so that every cloned piece of DNA is present. These colonies are transferred to nylon filters and lysed open. The cell remains are washed away, while the genomic and plasmid DNA sticks to the nylon. The sequences are made single-stranded by incubating the filters in a strong base. When these are incubated with a radioactive single-stranded probe at the appropriate temperature, the probe hybridizes to any matching sequences. Companion site for Biotechnology. by Clark Copyright © 2009 by Academic Press. All rights reserved. 126

FIGURE 3. 22 Immunological Screening of an Expression Library Bacteria expressing foreign genes are grown on an agar plate, transferred to a membrane, and lysed. Released proteins are bound to the membrane. This figure shows only one attached protein, although in reality many different proteins are present. These include both expressed library clones and bacterial proteins. The membrane is incubated with a primary antibody that binds only the protein of interest. To detect this protein: antibody complex, a second antibody with a detection system such as alkaline phosphatase is added. The bacterial colony expressing the protein of interest will turn blue when X-Phos is added. This allows the vector with the correct insert to be isolated. Companion site for Biotechnology. by Clark Copyright © 2009 by Academic Press. All rights reserved. 127

Question 14 • What is a DNA library? A. An information repository for nucleic acid sequences. B. A collection of all protein-encoding genes cloned into bacterial plasmids. C. A collection of non-coding DNA sequences. D. A collection of various DNA fragments, usually representing an entire genome, cloned into plasmids. E. None of the above.

FIGURE 3. 23 Expression Vectors Have Tightly Regulated Promoters An expression vector contains sequences upstream of the cloned gene that control transcription and translation of the cloned gene. The expression vector shown uses the lac. UV promoter, which is very strong, but inducible. To stimulate transcription, the artificial inducer, IPTG, is added. IPTG binds to the Lac. I repressor protein, which then detaches from the DNA. This allows RNA polymerase to transcribe the gene. Before IPTG is added, the Lac. I repressor prevents expression of the cloned gene. Companion site for Biotechnology. by Clark Copyright © 2009 by Academic Press. All rights reserved. 129

FIGURE 3. 24 Using Tags to Isolate Proteins Some expression vectors have DNA sequences that code for short protein tags. The 6 HIS tag (A) codes for six histidine residues. When fused in-frame with the coding sequence for the cloned gene, the tag is fused to the protein. The 6 HIS tag specifically binds to nickel ions; therefore, binding to a nickel ion column isolates 6 HIStagged proteins. Other tags, such as Myc or FLAG (B), are specific antibody epitopes that work in a similar manner. Myc-tagged or FLAG-tagged proteins can be isolated or identified by binding to antibodies to Myc or FLAG, respectively. Companion site for Biotechnology. by Clark Copyright © 2009 by Academic Press. All rights reserved. 130

FIGURE 3. 25 Cloning by Subtractive Hybridization The key to subtractive hybridization is to hybridize all the wild-type or “healthy” DNA fragments (pink) with an excess of mutant DNA (purple). In this example, the mutant DNA is digested with restriction enzyme 1 and the wild-type DNA is digested with enzyme 2. Next, the two DNA samples are mixed, denatured, and allowed to anneal. The DNA will hybridize to form mutant/mutant strands (flanked by sites for restriction enzyme 1); mutant/healthy strands (flanked by incompatible ends); or healthy/healthy strands (flanked by sites for enzyme 2). The healthy/healthy hybrids will be rare and should correspond to the region of the deletion. They are easily separated from the other hybrids by cloning into a vector cut with restriction enzyme 2. Companion site for Biotechnology. by Clark Copyright © 2009 by Academic Press. All rights reserved. 131

FIGURE 3. 26 Subtractive Hybridization Captures m. RNA Expressed under Specific Conditions Two different cultures are grown, one under standard conditions (green) and the other under experimental conditions (orange). The m. RNA is isolated from each culture, and one sample is converted to c. DNA (purple). The c. DNA is bound to the filter and denatured to make it single-stranded. The experimental m. RNA (orange) is passed through the filter. Only m. RNA that is unique to the experimental conditions will fail to find a partner to hybridize. Consequently, this m. RNA will come through the filter. Conversely, any m. RNA that is present under both growth conditions will be trapped on the filter. Companion site for Biotechnology. by Clark Copyright © 2009 by Academic Press. All rights reserved. 132

UNN 1. 2 Companion site for Biotechnology. by Clark UNN 1. 1 Copyright © 2009 by Academic Press. All rights reserved. 133

Question 15 • The most important feature of an expression vector is the: A. Protein tag. B. Transcription stop sites. C. Tightly regulated promoter region. D. Ability to be expressed in both prokaryotic and eukaryotic hosts. E. All of the above.
- Slides: 134