Biostatistics Experimental Design Qian Wenfeng Self introduction Qian

Biostatistics & Experimental Design Qian, Wenfeng
 • Institute of Genetics & Developmental Biology, CAS")
Self introduction • Qian, Wenfeng (钱文峰) • Institute of Genetics & Developmental Biology, CAS • Center for Molecular Systems Biology

My research • Genetic basis of gene expression – Expression variations among species – Expression variations among environments – Expression variations among isogenic cells – Genetic-environment interactions • Kinetics of gene expression – Protein synthesis/degradation – Transcriptional/translational burst

My group • http: //qianlab. genetics. ac. cn/

My education • 2006, B. S. , Peking University – Biological Sciences • 2012, Ph. D. , University of Michigan – Evolutionary genetics

Statistics and me • Top 1% statistics among biologists • Top 1% biology among statisticians

Course introduction • Applied biostatistics • Examples, examples, and examples • Try to make it not too heavy

Schedule • • April 22: Probability April 24: Introduction to R April 29: Hypothesis testing Prof. Yang May 6: Analysis of covariance May 8: Regression and correlation May 13: Plots with R May 15: Presentations (== final exam)

R language • Standard statistical tool in science • Will be introduced by Prof. Yang • You will need to bring your laptop to the class, with R installed.

Download R http: //www. r-project. org/

Exam • Final exam is a report based on the use of statistics in a small project. The report should be between 1000 and 2000 words. • Ten-minute (including 2 min Q & A) oral defense of the report in front of the class.

PPT • Will be uploaded to my lab website after each class • qianlab. genetics. ac. cn • Words in red: waiting for your response • Words in green: the beginning of a new example

Your introduction

Statistics is the base of all sciences • The definition of the modern science?

What is science? • A theory in the empirical sciences can never be proven, but it can be falsified, meaning that it can and should be scrutinized by decisive experiments. Hypothesis testing Karl Popper 1902 -1994

Statistics • Statistics is the study of the collection, organization, analysis, interpretation and presentation of data.

Deterministic vs stochastic events Deterministic events Stochastic events • If I roll a dice, I will get a face up • I will get up in the tomorrow morning • A child will grow up • The number on the face up • The exact time (minute and second) I get up • The height and weight of the child Other examples?

Phenomena in biology • Are likely to be stochastic, compared to physical phenomena • In physical world – Sun rises – Planet moves – Water boils

In biological world • Weight and height • Disease • Life span • Reason?

Reasons of stochasticity in life • Traits are determined by both genes and environments • Environment is heterogeneous • Most traits are affected by multiple genes with minor effect each • Developmental strategy (body plan) • Life sciences contains a huge number of factors, which makes stochasticity everywhere.

Normal distribution • The bell shape • Appears everywhere in biology • Why? – Traits are determined by both genes and environments – Many genes with minor effects – Additivity • What if not?

The height is more than 1. 9 meter • If the distribution of height follows normal distribution, with mean = 1. 75 and standard deviation = 0. 06
 • Standard deviation (σ)")
Descriptive statistics • Mean • Variance (σ2) • Standard deviation (σ)

The height is more than 1. 9 meter • If the distribution of height follows normal distribution, with mean = 1. 75 and standard deviation = 0. 06 • P = 1 - “NORMDIST(1. 9, 1. 75, 0. 06, 1)” • =0. 6%

Density function Cumulative density function

The height is more than 1. 9 meter • If the distribution of height follows normal distribution, with mean = 1. 75 and standard deviation = 0. 06 • What is the probability of less than 1. 2 meter?

The height is more than 1. 9 meter • If the distribution of height follows normal distribution, with mean = 1. 75 and standard deviation = 0. 06 • What is the probability of less than 1. 2 meter? • What if this number is different from what has been reported?
 the mean is")
Regression to the mean • In statistics, regression toward (or to) the mean is the phenomenon that if a variable is extreme on its first measurement, it will tend to be closer to the average on its second measurement • An positive gene in your screen may not appear in the next time. • The best student in the collage could become ordinary later in his/her career • Why? Any examples?

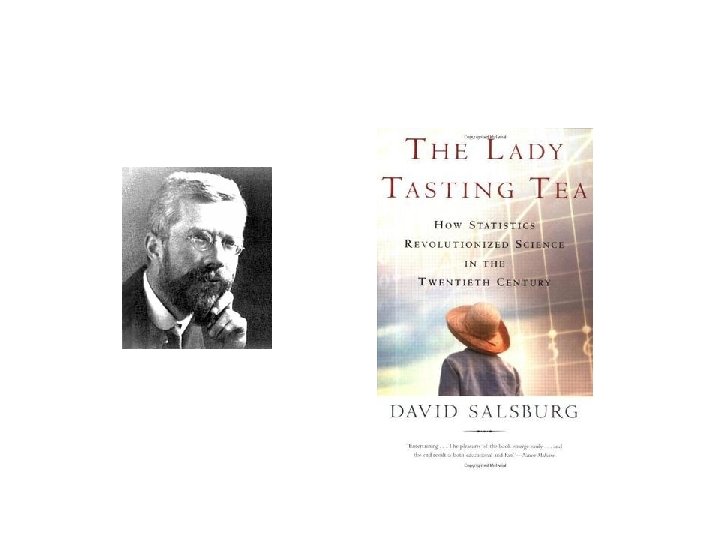
How do we treat stochastic data • At a summer tea party in Cambridge, England, a guest states that tea poured into milk tastes different from milk poured into tea. Her notion is shouted down by the scientific minds of the group. • But one man, Ronald Fisher, proposes to scientifically test the hypothesis.

How to test the hypothesis? • H 0: There is not difference on order of milk and tea

How to test the hypothesis? • H 0: There is not difference on order or milk and tea • 10 cups of drink • Mixed blind to the lady • Let the lady tell the order of milk and tea • If H 0 is correct, what is the probability the lady get all 10 guess correct?

How to test the hypothesis? • If H 0 is correct, what is the probability the lady get all 10 guess correct? 0. 1% • It is unlikely that event with such low probability happened in a single test. Thus, the most likely scenario is that H 0 is incorrect, and there is differences between two orders.

What if… • Among 10 tests, the lady succeeded for 8 of them?

Binomial distribution • • First, child Boy or Girl Second, B or G Third, B or G Eight possibilities: – BBB, BBG, BGB, BGG, GBB, GBG, GGB, GGG • What is the probability of having 2 B in 3 children?

Binomial distribution •

What if… • Among 10 tests, the lady succeeded for 8 of them?
 – In")
Probability estimation • Alternatively, we can estimate the probability of success (E) – In this case 80% • Then, we can get 95% confidence interval (CI) • If E – CI > 0. 5, we conclude a difference between the order

How to calculate confidence interval? • Implications

Law of large number • The estimate of the probability 0. 8 may not be accurate … • The larger the sample size, the more accurate our estimate is. • So that we could potentially distinguish 50% from 60%

Applications of such idea • Hold your nose, and you may not able to tell coke from sprite

• Is a drug effective or not? • Other examples?

Blaise Pascal calculator 1623 -1662 Pascal's principle

Geek’s joke • One day, Einstein, Newton, and Pascal meet up and decide to play a game of hide and seek. Einstein volunteered to be “It. ” As Einstein counted, eyes closed, to 100, Pascal ran away and hid, but Newton stood right in front of Einstein and drew a one meter by one meter square on the floor around himself. When Einstein opened his eyes, he immediately saw Newton and said “I found you Newton, ” but Newton replied,

Einstein, Newton, and Pascal Play Hide and Seek • “No, you found one Newton per square meter. You found Pascal!”.

Pascal’s Problem • The rule of the game – Two people toss the coin one by one – They both bet 12 coins – Player A wins when s/he gets 3 “head” – Player B wins when s/he gets 3 “tail” – The game has to stop when A gets 2 “head” and B gets 1 “tail” because of King’s call – How to split the bet?

Opinions • B: A gets 2/3 and B gets 1/3 – A needs one more “head”, P = 1/2 – B needs two more “tails”, P = 1/4 • A: A gets 3/4 and B gets 1/4 – B wins only when B gets two “tails” P = 1/4 – Otherwise, A wins P = 3/4 • Who is correct?

Conclusion • A: A gets 3/4 and B gets 1/4

Monty Hall problem • Suppose you're on a game show, and you're given the choice of three doors: Behind one door is a car; behind the others, goats. You pick a door, say No. 1, and the host, who knows what's behind the doors, opens another door, say No. 3, which has a goat. He then says to you, "Do you want to pick door No. 2? " Is it to your advantage to switch your choice? Your guess?

Monty Hall problem • If the car is not behind door 3, the probabilities of being behind door 1 and door 2 are equal • P = ½ for both.

Solution 1 • 1/3

Solution 2

Solution 3

Consider 10000 doors … • You chose door 1 • The host open 9998 doors for you, and none of them have cars behind • Do you switch?

Monty Hall problem • Switch it!

The probability of the same birthday in a class • Consider a class with 50 people • What is the probability that at least two students have the same birthday? Your guess?

The probability that all have different birthday • • • The first person: 1 The second person: 364/365 The third person: 363/365 … The 50 th person: 316/365 • P = 0. 03

The answer • The probability that all have different birthdays • P = 0. 03 • The probability that at least two students have the same birthday • 1 – P =0. 97

The probability of selfing • A rice is a monoecious plant • Male flower and female flower have different timings. • Male flowers blossoms for 5 days • Female flowers blossoms for 3 days • It is estimated that male flower may blossom during June 5 - 10, and female flower may blossom during June 1 – 15 • The probability of selfing?

The probability of selfing • Male 5 d; Female 3 d • Male flower may blossom during June 5 - 10 • Female flower may blossom during June 1 – 15

The success of an experiment • Two people A and B are doing an experiment in my lab • According to the history records, the successful rate for A is 0. 8, and that for B is 0. 7 • Each of them does the experiment once • What is the probability of at least one success?

The success of an experiment • Consider the probability both of them fail • P = 1 - 0. 2 * 0. 3 = 0. 94 • Any problems here?

The success of an experiment • • Consider the probability both of them fail P = 1 - 0. 2 * 0. 3 = 0. 94 Any problems here? It depends on whether the two people are doing experiments independently! – Do they use the same set of reagents? – If true, then A’s failure increases the probability of B’s failure
 • The probability of A given B • The")
The conditional probability • P(A|B) • The probability of A given B • The probability of girl given the first child is a boy in the family • P(the second child is a girl | the first child is a boy) • If independent P (2 nd girl | 1 st boy) = P (girl)

Autosomal single-locus disease Patients ? Normal individuals

Autosomal single-locus disease Patients ? Normal individuals

Bayesian theorem •

Probability of infection • A test can detect 95% of the people with infection (true positive) • There is 1% probability of false positive • The frequency of a infection is 0. 5% • What is the probability of infection, given a positive result in the test

Bayesian theorem •

Autosomal single-locus disease Patients ? Normal individuals

The probability of 4 th girl in the family, given the first 3 are all girls • Your opinion?

Genetics or stochasticity • Model I: for some genetic reasons, only sperms with X chromosome survive. • Model II: the birth of sons and daughters are equally likely • For a family with 3 daughters, which model is more likely?

Genetics or stochasticity • Model I: for some genetic reasons, only sperms with X chromosome survive. • Model II: the birth of sons and daughters are equally likely • How to calculate it quantitatively?

Genetics or stochasticity • Model I: for some genetic reasons, only sperms with X chromosome survive. • Model II: the birth of sons and daughters are equally likely • LOD score: log 10 of odds • LOD = log 10(P(obs. | model I)/ P(obs. | model II)) • Why?

Genetics or stochasticity • Model I: Genetics • Model II: By chance • LOD = log 10(P(obs. | model I)/ P(obs. | model II)) • P(obs. | model I) = 1 • P(obs. | model II) = 1/8 • LOD =log 10(1/8) = -0. 9 • Threshold: >3 or <-3

Number of left handed people • If the probability of left handed people is 5% in a population, what is the probability of a 50 -student class containing exact 1 left handed people?

Poisson distribution λ = mean = variance

Number of left handed people •
- Slides: 78