Biosphere WHAT IS ECOLOGY Ecology the scientific study

Biosphere

WHAT IS ECOLOGY? Ecology- the scientific study of interactions between organisms and their environments, focusing on energy transfer Ecology is a science of relationships

Daily Dose: Biomes

DD Questions 1. Define a biome in your own words. 2. List some factors that affect biomes around the world. 3. Put your list into two inclusive categories. Inclusive categories - word can NOT be put into both list, words only works in one list.

WHAT DO YOU MEAN BY ENVIRONMENT? The environment is made up of two factors: Biotic factors- all living organisms inhabiting the Earth Abiotic factors- nonliving parts of the environment (i. e. temperature, soil, light, moisture, air currents)

Biosphere Ecosystem Community Population Organism

Organism - any unicellular or multicellular form exhibiting all of the characteristics of life, an individual. • The lowest level of organization

POPULATION ü a group of organisms of one species living in the same place at the same time that interbreed üProduce fertile offspring üCompete with each other for resources (food, mates, shelter, etc. )

Community - several interacting populations that inhabit a common environment and are interdependent.

Ecosystem - populations in a community and the abiotic factors with which they interact (ex. marine, terrestrial)

Biosphere - life supporting portions of Earth composed of air, land, fresh water, and salt water. • The highest level of organization

Habitat vs. Niche - the role a species plays in a community; its total way of life Habitat- the place in which an organism lives out its life

Feeding Relationships There are 3 main types of feeding relationships Producer - Consumer 2. Predator - Prey 3. Parasite - Host 1.
, they trap energy from the sun – photosynthesis")
Feeding Relationships Producer- all autotrophs (plants), they trap energy from the sun – photosynthesis Bottom of the food chain

Photosynthesis

Feeding Relationships Consumer- all heterotrophs: they ingest food containing the sun’s energy ØHerbivores ØCarnivores ØOmnivores ØDecomposers

Feeding Relationships CONSUMERS 1. Primary consumers Eat plants Herbivores Secondary, tertiary … consumers Prey animals Carnivores

Feeding Relationships Consumer-Carnivores-eat meat Predators Hunt prey animals for food.

Feeding Relationships Consumer- Carnivores- eat meat Scavengers Feed on carrion, dead animals

Feeding Relationships Consumer- Omnivores -eat both plants and animals
 and the other is harmed (host) Parasite-Host")
Symbiotic Relationships Parasitism- one species benefits (parasite) and the other is harmed (host) Parasite-Host relationship

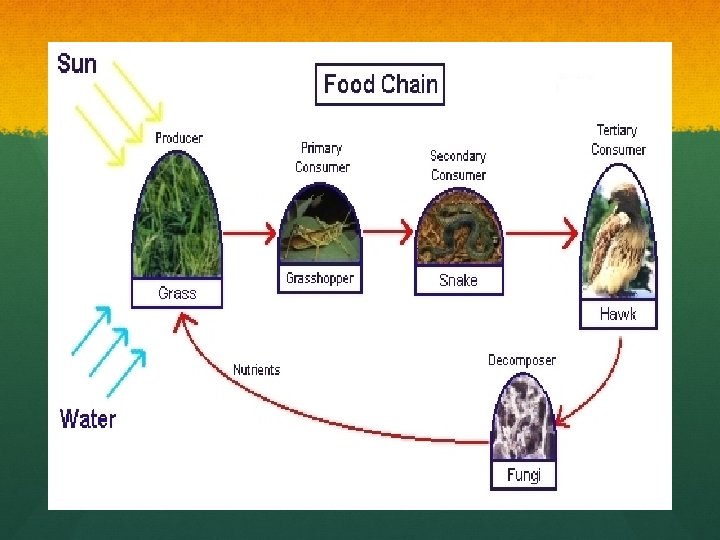
Trophic Levels Each link in a food chain is known as a trophic level. Trophic levels represent a feeding step in the transfer of energy and matter in an ecosystem.

Trophic Levels Food chain- simple model that shows how matter and energy move through an ecosystem

Trophic Levels Food web- shows all possible feeding relationships in a community at each trophic level Represents a network of interconnected food chains
 Food web (all possible energy paths)")
Food chain (just 1 path of energy) Food web (all possible energy paths)

Biodiversity Daily Dose


Question 1 1. How many reptile species are located in North Carolina? a. b. c. d. 7 32 121 5, 000

Biodiversity DD Questions: 2. In your own words define biodiversity. 3. Why is biodiversity so important in a biome? 4. Create a list of how animals are becoming extinct.

What is biodiversity? Biodiversity – variety of living things in an area Three levels 1. 2. 3. Genetic diversity Species diversity Ecosystems diversity When you hear “biodiversity of Earth” it means species diversity

Biodiversity of Earth Species diversity – Last estimate there are 8. 7 million species many still yet to be discovered Can affect the stability of ecosystems If one species is lost it affects the entire ecosystem is effected Humans need biodiversity for medical, industrial, and agricultural proposes Foxglove Digitalis for heart failure Pacific yew Ovarian Cancer

Areas of Critical Biodiversity “hotspots” 1. 2. High numbers of endemic species – means many organisms that live there are not found anywhere else in the world Threatened by human activities Tropical rainforests Coral reefs and coastal ecosystems Islands

Global Biodiversity Hotspots

U. S. Biodiversity Hotspots 2 4 3 5 Top Six Hot Spots 6 1 Hawaii 2 San Francisco Bay area 3 Southern Appalachians 4 Death Valley 5 Southern California 6 Florida Panhandle Concentration of rare species 1 Low Moderate High

IF YOU

C C

How do humans cause extinction? HIPPCO 1. Habitat destruction – may be complete destruction or habitat fragmentation Habitat destruction is the number one threat to biodiversity

How do humans cause extinction? HIPPCO 2. Introduction of invasive species Example: Mites, called Verroa destructor, introduced from Asia have seriously reduced the wild honeybee population in the U. S.

Spread of fire ants 1918 2000

Kudzu Fast-growing climbing vine from Asia Introduced to control erosion

European Starling Released into New York City in the late 1800’s by a man who wanted to introduce to the U. S. all of the birds mentioned in Shakespeare Now widespread across North America Outcompetes many native birds, such as bluebirds, for nest holes

How do humans cause extinction? HIPPCO 3. Population growth – root of the problem? Food for thought: What native species could live in these conditions?

How do humans cause extinction? HIPPCO 4. Pollution Example: Use of DDT almost caused the extinction of the Bald Eagle and other predatory birds

Biomagnification Also called biological magnification Accumulation of pollutants in higher order trophic levels

How do humans cause extinction? HIPPCO 5. Climate change polar bear – loss of sea ice bleaching of coral reefs

Golden toads were discovered in 1964, in Monteverde, Costa Rica Males The mountainous cloud forest has a perfect climate for amphibians Extreme sexual dimorphism Unfortunately, they became extinct within 25 years Causes: 1. Changes in habitat – drying of cloud forest due to global warming, ENSO 2. Narrow window of time for reproduction – breed in temporary ponds which dried up early 3. Limited range 4. Disease Female

How do humans cause extinction? HIPPCO 6. Overharvesting, hunting, poaching Both legal and illegal collecting of organisms had a negative impact

Easter Island

Population Growth Footprint and Growth

Lorax Notes Who does the Lorax represent? Who does the Once-ler represent? What happened to the animals that lived there before the Once-ler made the factory? What was the Once-ler’s major mistake? With your group come up with something that the Once-ler could have done to prevent his business from going under?

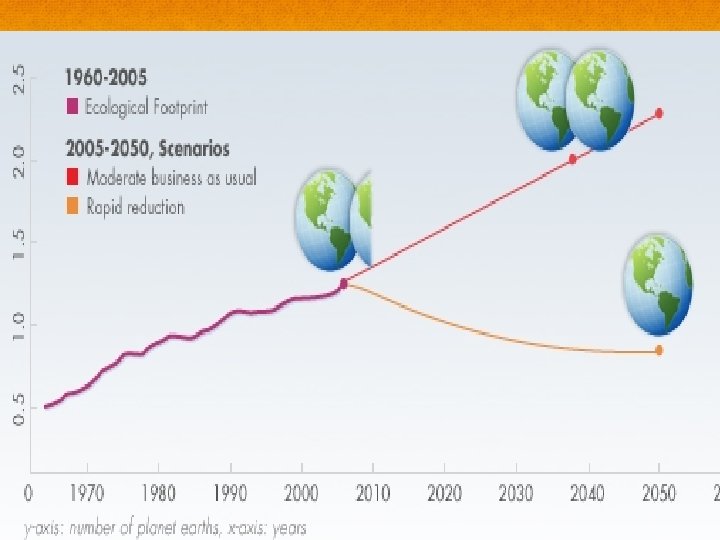
Footprints Ecological Footprints – measure the extent to which humans are using the Earth’s bioproductive capacity How fast we are using up Earth’s resources Bioproductivity – amount of biological material that is useful to humans Measured in Hectares – 2. 4 acres 1 hectare = 2 complete football fields 11. 5 billion hectares of biologically productive surface

Supply and Demand

Supply and Demand Supply = biocapacity/bioproductivity Supply is declining because of urbanization and deforestation Demand = Human needs Demand is increasing because population of the Earth is rising

Current estimates indicate that humans are overusing the bioproductivity of Earth by about 25 -50% Think about The Lorax Eventually the amount of needed by humans exceeded how much Earth produced. What did this cause?

What is your footprint? Do Ecological Footprint Activity

How do we measure up with the rest of the world?

How does Earth on a whole stand? 11. 5 billion hectares Amount of bioproductive land is declining There about 7 billion people on earth Amount of people is increasing Currently have 1. 6 hectares person Most ecologists believe this is insufficient to support a significant quality of life for the average person It is predicted that by 2050 we will have only 1 acre person

Solutions Controlling emissions is cheaper than paying for the climate change

• A 2010 study by the Pew Trust estimates the cost of lost ecological services by 2100 • Costs included factors such as lost agricultural productivity from drought, damage to infrastructure from flooding and storms, lost biological productivity, health costs from heat stress, and lost water supplies • The Pew report found that climate change is likely to cost between $5 trillion and $90 trillion by 2100 • The Stern Review (2006) estimates a cost of only about 1% of global GDP to avoid the worst impacts of climate change

Solutions Controlling emissions is cheaper than paying for the climate change Ways to control emissions • We can reduce dependence on coal, which produces more CO 2 per energy unit than any other fuel • We could institute fees for selling fossil fuels–these would help fossil fuel prices represent their many hidden costs • We can invest in new technologies and energy efficiency • We can institute emissions trading, by instituting a legal cap on emissions, then allowing companies to buy and sell shares of that total cap (California’s AB-32 does this)

Population Growth

Daily Dose The Stork and the Grim Reaper

Questions 1. Make a prediction on what will happen to the water level.

Questions 1. Make a prediction on what will happen to the water level. 2. In the scenario which is greater the death rate or the birth rate? 3. What does this tell us about Earth’s population growth? 4. List some things that would make the Reaper’s cup larger…Real life things. 5. What would need to happen to have the water level remain constant?

Population Growth Population – number of organisms for a species Can increase, decrease, or remain constant What’s happening to the population on the right over time?

Factors that affect Growth Create a list with your table of factors that affect a population’s growth. Write on sticky notes and place on board

Population Growth Terms Limiting Factor – limits the growth of a population Food availability Droughts Predators Competition Catastrophic events Parasite Disease Habitat availability

Terms continued Carrying Capacity – maximum population size an environment can support for a long period of time Carrying capacities can change as the environment changes Birth Rate – number of births in a population per year Death Rate – number of deaths in a population per year

Scenario Scenario: You have just been hired for exactly one month. Your boss is discussing your pay and asks for your opinion. He wants you to choose: Option A: $100 per week Option B: 1 penny for the first day and doubled everyday for the next 28 days Which one should you chose. Take 3 minutes to come to your conclusion.

Scenario cont. You should choice option B because it grow exponentially and you would get more $$ Same is true in population growth

Population Growth Patterns Exponential Growth Birth Rate is HIGHER than the death rate Birth rate is increasing Called a J - Graph

Population Growth Patterns Carrying capacity and limiting factors cause a plateau in growth. Called S-graph

Human Growth Based on the graph what is human growth?

Human Growth

Human Growth Why is the growth pattern exponential?

Human Growth Why is the growth pattern exponential? Birth rate > Death Rate

Human Growth Why is the growth pattern exponential? Birth rate > Death Rate Medical advances Increase technology

Current Population Around 7 billion people Read 13. 3 page

Essay Prompt Are humans exceeding Earth’s carrying capacity? How can you tell? What would happen if we were to exceed the carrying capacity? Minimum 2 paragraphs Include: 1. 2. 3. Definition of carrying capacity. What type of growth pattern humans have. Solutions for minimizing human footprints and thereby increasing our carrying capacity. 4. Defend your answer
- Slides: 83