Biomedical Master Introduction to genomewide association studies Metabolic
 Sven Bergmann University")
Biomedical Master Introduction to genome-wide association studies Metabolic diseases (B. Thorens) Sven Bergmann University of Lausanne & Swiss Institute of Bioinformatics http: //serverdgm. unil. ch/bergmann Biomedical Master: Metabolic diseases Lausanne, November 8, 2010
 systems Small systems • many uncharacterized • elements")
A Systems Biology approach Large (genomic) systems Small systems • many uncharacterized • elements well-known elements • relationships unknown • computational analysis should: • many relationships established • quantitative modeling of systems properties like: § improve annotation § Dynamics § reveal relations § Robustness § reduce complexity § Logics


Overview • Population stratification • Our whole genome associations • New Methods and Approaches
 ATTGCAATCCGTGG. . . ATCGAGCCA…TACGATTGCACGCCG… ATTGCAAGCCGTGG. . .")
Genetic variation in SNPs (Single Nucleotide Polymorphisms) ATTGCAATCCGTGG. . . ATCGAGCCA…TACGATTGCACGCCG… ATTGCAAGCCGTGG. . . ATCTAGCCA…TACGATTGCAAGCCG…

6’ 189 individuals Co. Laus = Cohort Lausanne Genotypes 500. 000 SNPs Phenotypes 159 measurement 144 questions Collaboration with: Vincent Mooser (GSK), Peter Vollenweider & Gerard Waeber (CHUV)

Analysis of Genotypes only Principle Component Analysis reveals SNP-vectors explaining largest variation in the data

PC 2 Ethnic groups cluster according to geographic distances PC 1

PCA of POPRES cohort

Predicting location according to SNP-profile . . .

… is pretty accurate!

The Swiss segregate according to language

PC-Analysis of genotypic profile • Is surprisingly accurate! • Is useful forensic purposes or for individuals interested in their ancestry • Is useful for population stratification in Genome-wide Association studies

Phenotypic variation:

What is association? SNPs trait variant chromosome Genetic variation yields phenotypic variation Population with ‘ ’ allele Distributions of “trait”

phenotype Association using regression genotype Coded genotype
 transformation effect size (regression coefficient) error (residual) phenotype (response variable) of")
Regression formalism (monotonic) transformation effect size (regression coefficient) error (residual) phenotype (response variable) of individual i p(β=0) coded genotype (feature) of individual i Goal: Find effect size that explains best all (potentially transformed) phenotypes as a linear function of the genotypes and estimate the probability (p-value) for the data being consistent with the null hypothesis (i. e. no effect)

Whole Genome Association

Whole Genome Association Current microarrays probe ~1 M SNPs! significance Standard approach: Evaluate significance for association of each SNP independently:

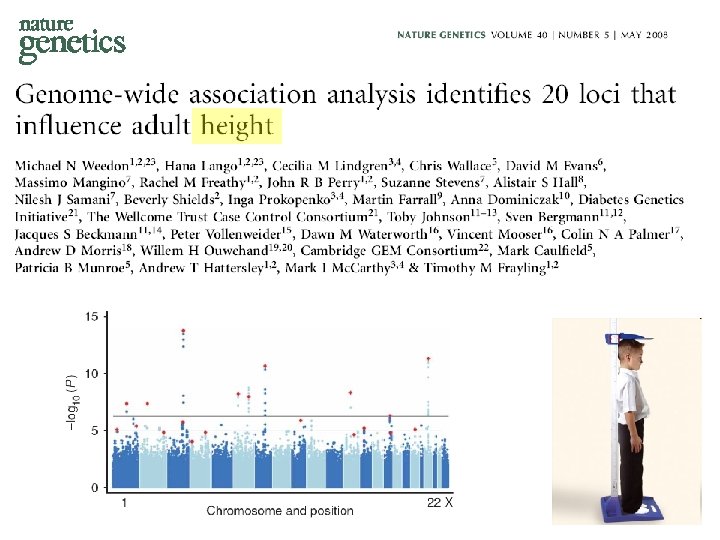
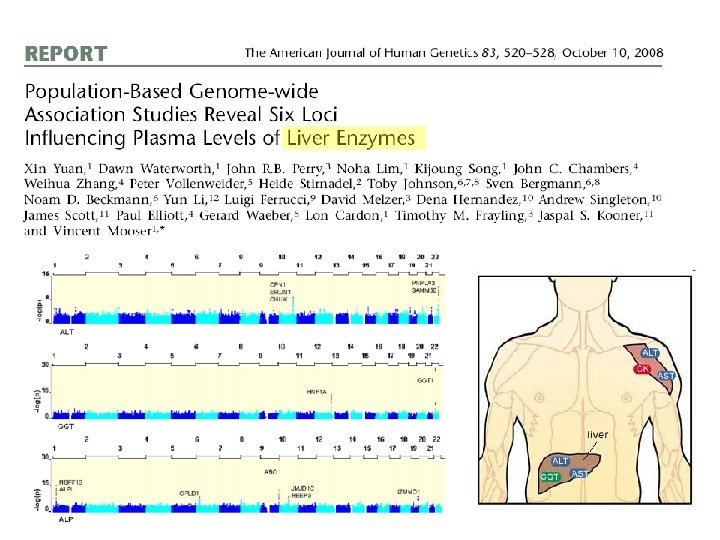
Whole Genome Association Quantile-quantile plot significance observed significance Manhattan plot Chromosome & position Expected significance GWA screens include large number of statistical tests! • Huge burden of correcting for multiple testing! • Can detect only highly significant associations (p < α / #(tests) ~ 10 -7)

")
Genome-wide meta-analysis for serum calcium identifies significantly associated SNPs near the calcium-sensing receptor (CASR) gene Karen Kapur, Toby Johnson, Noam D. Beckmann, Joban Sehmi, Toshiko Tanaka, Zoltán Kutalik, Unnur Styrkarsdottir, Weihua Zhang, Diana Marek, Daniel F. Gudbjartsson, Yuri Milaneschi, Hilma Holm, Angelo Di. Iorio, Dawn Waterworth, Andrew Singleton, Unnur Steina Bjornsdottir, Gunnar Sigurdsson, Dena Hernandez, Ranil De. Silva, Paul Elliott, Gudmundur Eyjolfsson, Jack M Guralnik, James Scott, Unnur Thorsteinsdotti, Stefania Bandinelli, John Chambers, Kari Stefansson, Gérard Waeber, Luigi Ferrucci, Jaspal S Kooner, Vincent Mooser, Peter Vollenweider, Jacques S. Beckmann, Murielle Bochud, Sven Bergmann
studies with (ten-)thousands of samples have identified a")
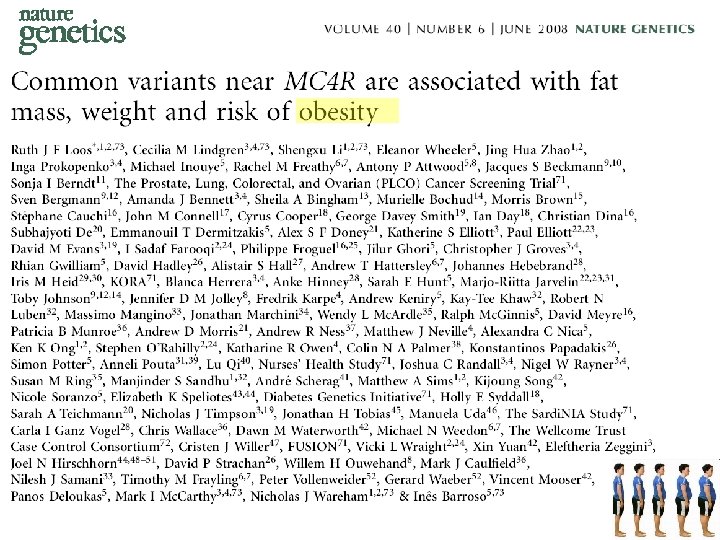
Current insights from GWAS: • Well-powered (meta-)studies with (ten-)thousands of samples have identified a few (dozen) candidate loci with highly significant associations • Many of these associations have been replicated in independent studies
 fraction of")
Current insights from GWAS: • Each locus explains but a tiny (<1%) fraction of the phenotypic variance • All significant loci together explain only a small (<10%) of the variance
Problem Why should a simplistic (additive) model using incomplete or")
The “Missing variance” (Non -)Problem Why should a simplistic (additive) model using incomplete or approximate features possibly explain anything close to the genetic variance of a complex trait? … and it doesn’t have to as long as Genome -wide Association Studies are meant to as an undirected approach to elucidate new candidate loci that impact the trait!

How could our models become more predictive? 1. Improve measurements: - measure more variants (e. g. by UHS) - measure other variants (e. g. CNVs) - measure “molecular phenotypes” 2. Improve models: - proper integration of uncertainties - include interactions - multi-layer models
 phenotypes to better understand organismal")
Towards a layered Systems Model We need intermediate (molecular) phenotypes to better understand organismal phenotypes

Network Approaches for Integrative Association Analysis Using knowledge on physical gene-interactions or pathways to prioritize the search for functional interactions

Transcription Modules reduce Complexity http: //maya. unil. ch: 7575/Expression. View SB, J Ihmels & N Barkai Physical Review E (2003)
 module expression is often stronger than for any of its constituent")
Association of (average) module expression is often stronger than for any of its constituent genes

Take-home Messages: • Analysis of genome-wide SNP data reveals that population structure mirrors geography • Genome-wide association studies elucidate candidate loci for a multitude of traits, but have little predictive power so far • Future improvement will require – better genotyping (CGH, UHS, …) – New analysis approaches (interactions, networks, data integration)
- Slides: 36