
Biomarkers in Action Examining the Effects of Dormant
Biomarkers in Action Examining the Effects of Dormant. Season Pesticide Runoff on Resident Fish Species ><> Andrew Whitehead <>< UC Davis, Bodega Marine Laboratory
Talk Overview: Biomarkers: • Definition • Traits • Advantages / Strengths • Drawbacks / Difficulties Biomarkers in Action: Pesticides Project • Goals • Experimental Design • Data
Biomarkers: Definition Physiological / biochemical response of an organism that is mechanistically / functionally related to xenobiotic exposure Principle: Xenobiotics interact with molecular targets through defined biochemical pathways which result in predictable physiological effects
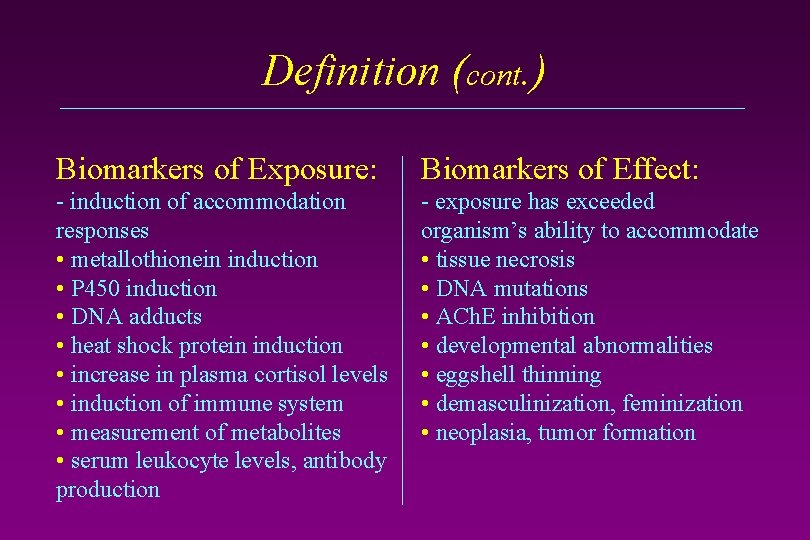
Definition (cont. ) Biomarkers of Exposure: Biomarkers of Effect: - induction of accommodation responses • metallothionein induction • P 450 induction • DNA adducts • heat shock protein induction • increase in plasma cortisol levels • induction of immune system • measurement of metabolites • serum leukocyte levels, antibody production - exposure has exceeded organism’s ability to accommodate • tissue necrosis • DNA mutations • ACh. E inhibition • developmental abnormalities • eggshell thinning • demasculinization, feminization • neoplasia, tumor formation
Biomarkers: Traits • Variability • Sensitivity • Selectivity • Clarity of Interpretation • Biological Significance • Duration of Response • Ease of use, Cost, Labor
Biomarkers vs. Other Approaches H 2 O Chemistry Monitoring: Unequivocal demonstration of presence/absence Snapshot in time/space, partitioning, exposure pathways, linkage to biological responses. . . Body Burden Analysis: Multiple exposure pathways Metabolism, sequestration Bioassays: Biological consequences Lab setting, standard test species
Biomarkers: Advantages/Strengths • “So What? ” • Linking Exposure to Effects • Integrated Information - Spatial - Temporal - Additive effects • Lab and Field experiments • Resident / Native organisms • Complex Field Evaluations: “Do Contaminants Play a Role? ”
Biomarkers: Drawbacks/Difficulties • Interpretation - Inferring causes - Scaling to meaningful effects - Timecourse of response • Understanding components of variation • Choice of biomarkers: What to measure? - Use tiered approach - Use other tools (chemistry) to focus choice
Examining the Effects of Dormant. Season Pesticide Runoff on Resident Fish Species PI: Dr. Susan Anderson – UC Davis, Bodega Marine Laboratory Coinvestigators: Dr. Bernie May – UC Davis Dr. Kathryn Kuivila – USGS Dr. David Hinton – Duke U Dr. Barry Wilson – UC Davis Graduate Student: Andrew Whitehead – UC Davis, Bodega Marine Laboratory Funding: EPA Star Grant, 1998
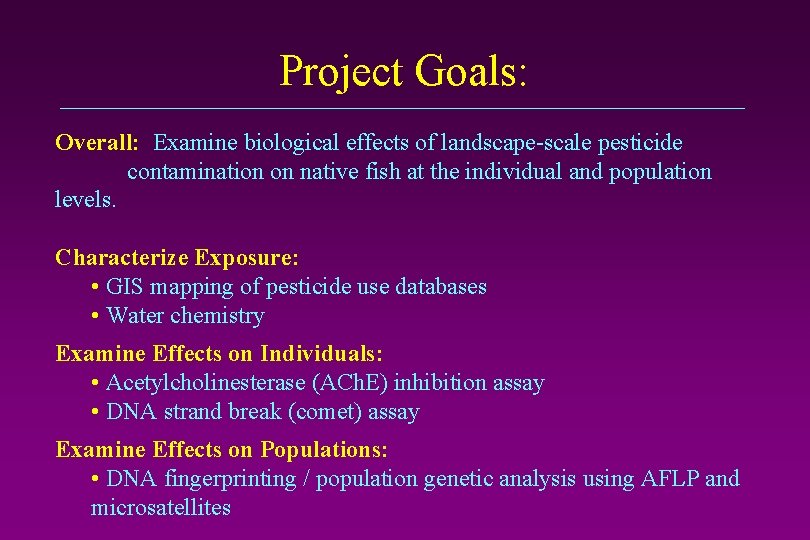
Project Goals: Overall: Examine biological effects of landscape-scale pesticide contamination on native fish at the individual and population levels. Characterize Exposure: • GIS mapping of pesticide use databases • Water chemistry Examine Effects on Individuals: • Acetylcholinesterase (ACh. E) inhibition assay • DNA strand break (comet) assay Examine Effects on Populations: • DNA fingerprinting / population genetic analysis using AFLP and microsatellites
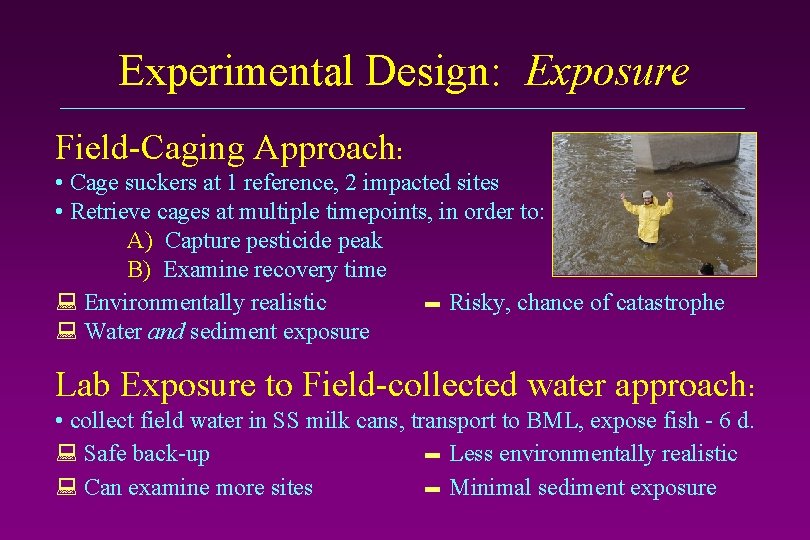
Experimental Design: Exposure Field-Caging Approach: • Cage suckers at 1 reference, 2 impacted sites • Retrieve cages at multiple timepoints, in order to: A) Capture pesticide peak B) Examine recovery time Environmentally realistic Risky, chance of catastrophe Water and sediment exposure Lab Exposure to Field-collected water approach: • collect field water in SS milk cans, transport to BML, expose fish - 6 d. Safe back-up Less environmentally realistic Can examine more sites Minimal sediment exposure
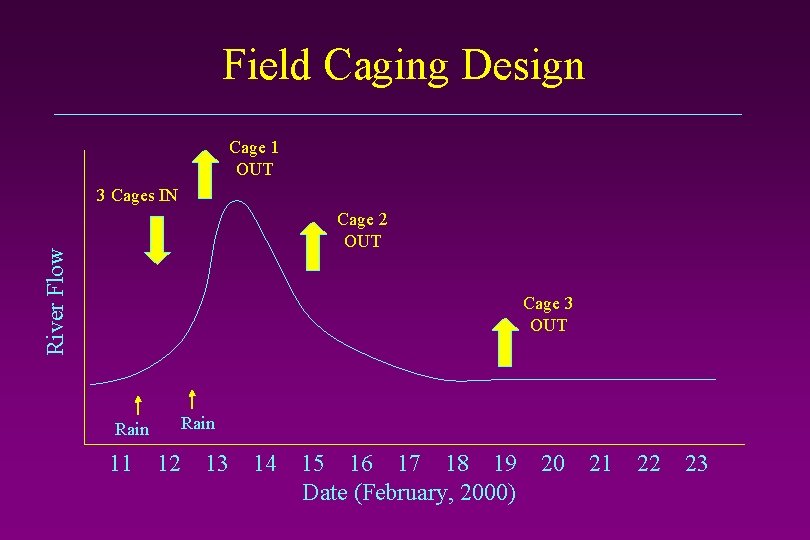
Field Caging Design Cage 1 OUT 3 Cages IN River Flow Cage 2 OUT Cage 3 OUT Rain 11 Rain 12 13 14 15 16 17 18 19 Date (February, 2000) 20 21 22 23
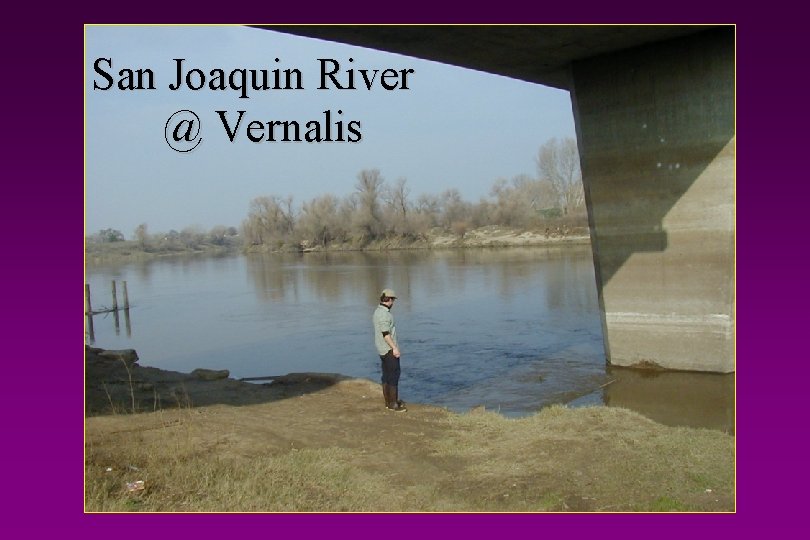
San Joaquin River @ Vernalis
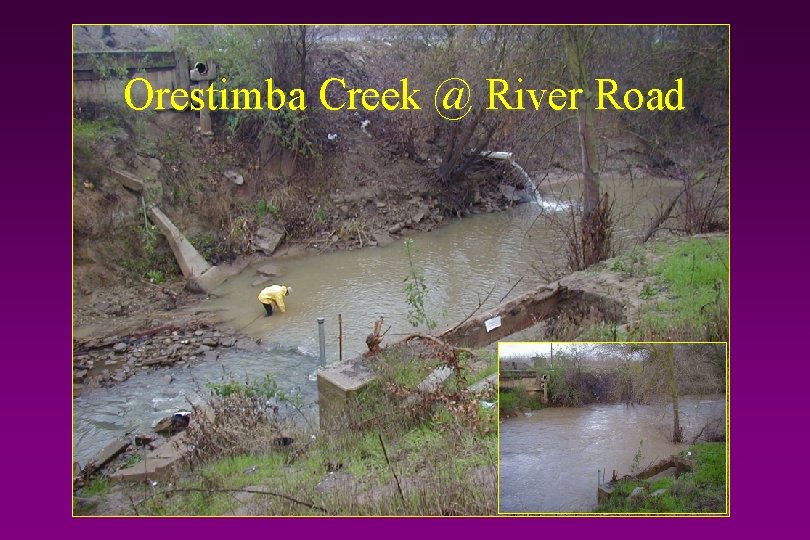
Orestimba Creek @ River Road
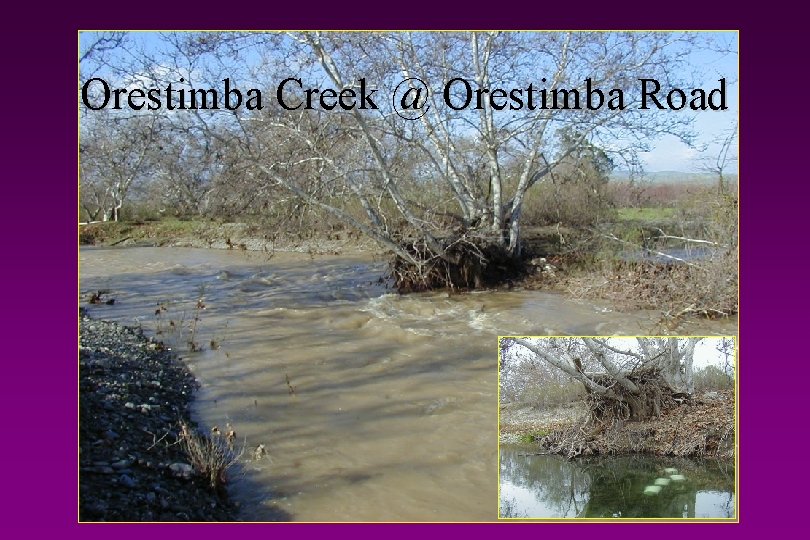
Orestimba Creek @ Orestimba Road
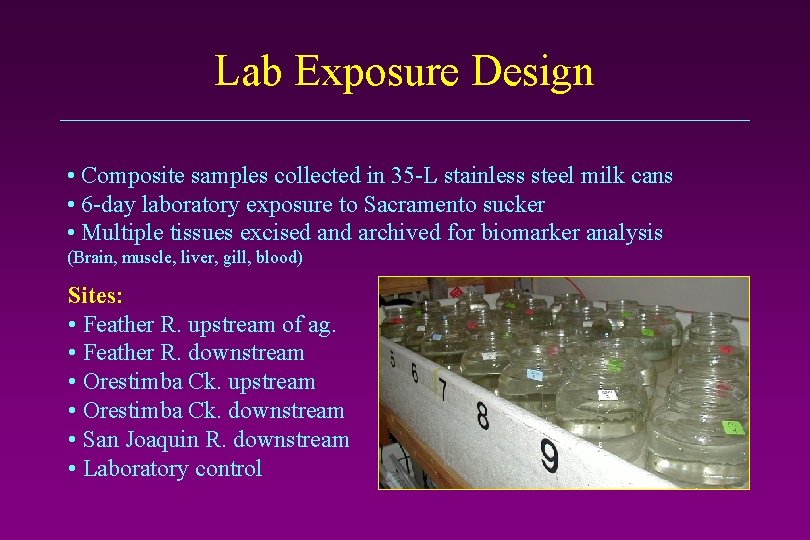
Lab Exposure Design • Composite samples collected in 35 -L stainless steel milk cans • 6 -day laboratory exposure to Sacramento sucker • Multiple tissues excised and archived for biomarker analysis (Brain, muscle, liver, gill, blood) Sites: • Feather R. upstream of ag. • Feather R. downstream • Orestimba Ck. upstream • Orestimba Ck. downstream • San Joaquin R. downstream • Laboratory control
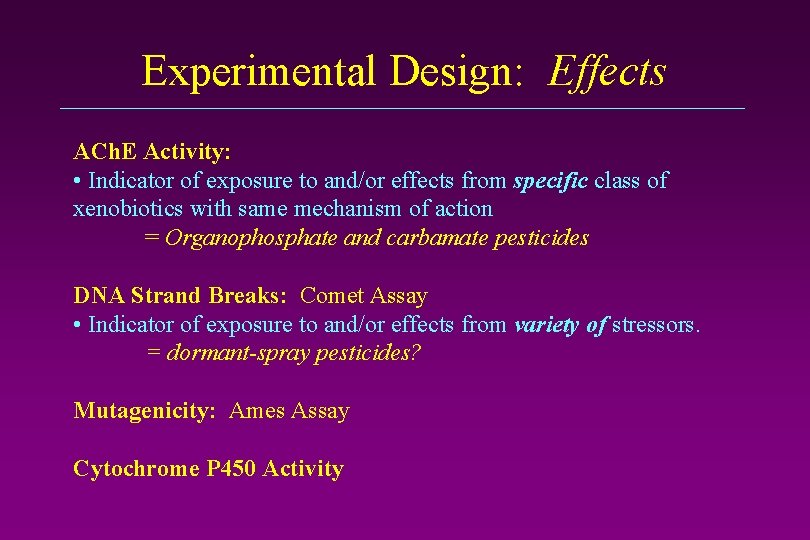
Experimental Design: Effects ACh. E Activity: • Indicator of exposure to and/or effects from specific class of xenobiotics with same mechanism of action = Organophosphate and carbamate pesticides DNA Strand Breaks: Comet Assay • Indicator of exposure to and/or effects from variety of stressors. = dormant-spray pesticides? Mutagenicity: Ames Assay Cytochrome P 450 Activity
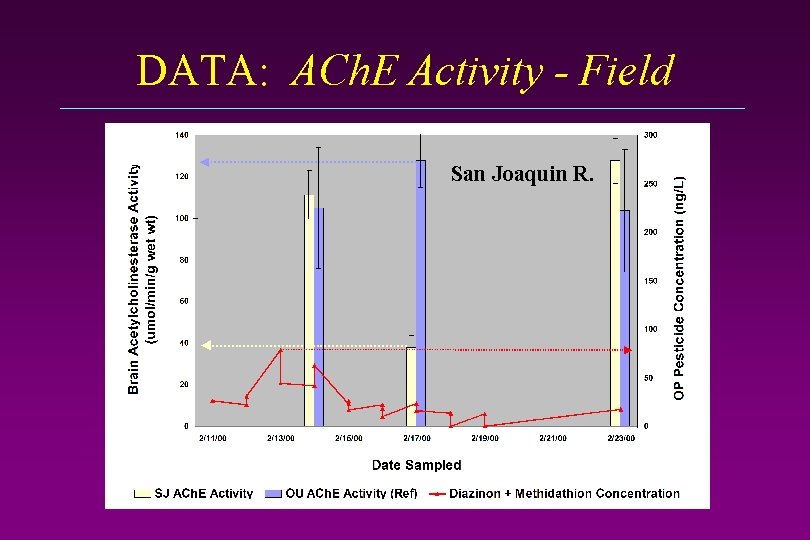
DATA: ACh. E Activity - Field San Joaquin R.
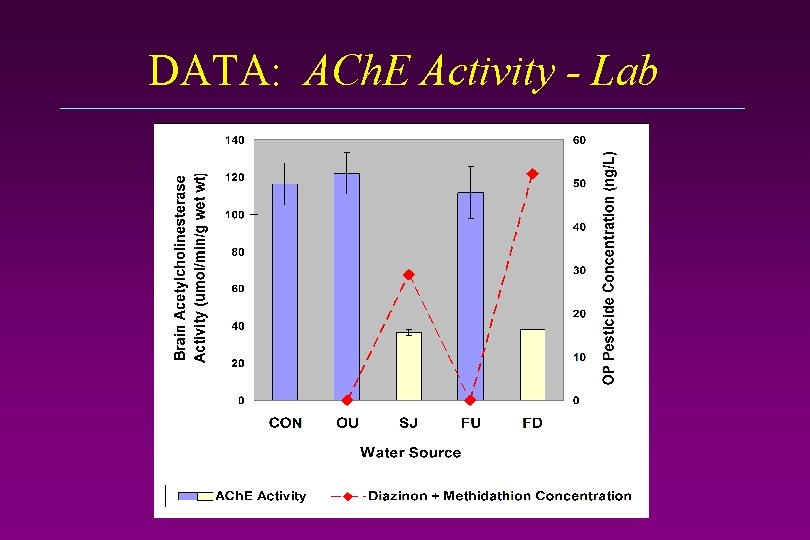
DATA: ACh. E Activity - Lab
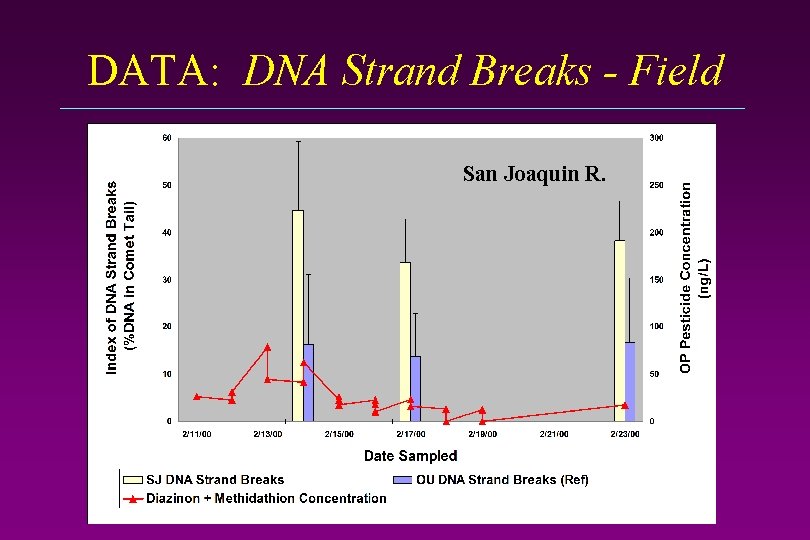
DATA: DNA Strand Breaks - Field San Joaquin R.
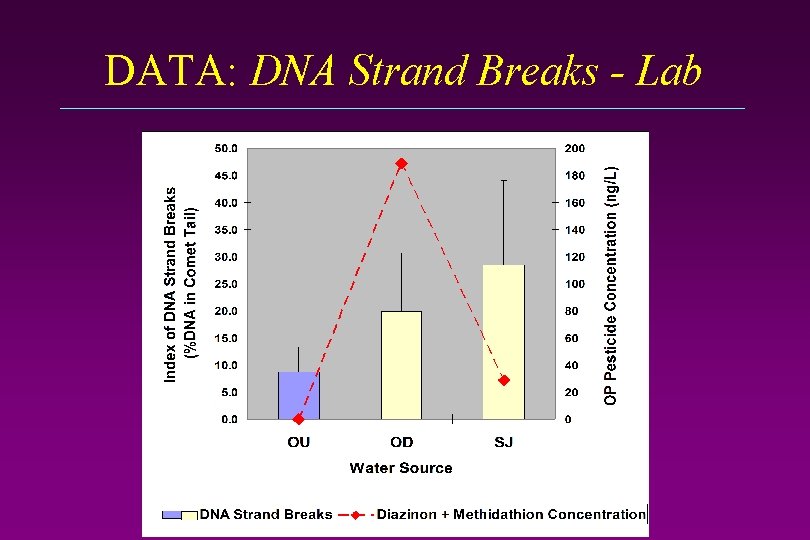
DATA: DNA Strand Breaks - Lab
Summary: Project Suite of indicators, coupled with chemistry, has been a strong approach for assessing effects in the field, and in lab, on relevant species ACh. E Data: - As hypothesized, dormant-season pesticides are affecting resident fish - Would not have expected effects based on chemistry alone DNA Strand Break Data: - Indicates importance of chemicals other than pesticides Ongoing/Future Work: - Other indicators: Mutagenicity assay, P 450 activity, more chemistry - Population genetic approach
Overall Summary For simple problems, use simple tools Complex problems demand more sophisticated approaches Biomarker information • “So What? ” • Focus - what are the real problems? • Integrated information • Relevant organisms • Field and lab evaluations
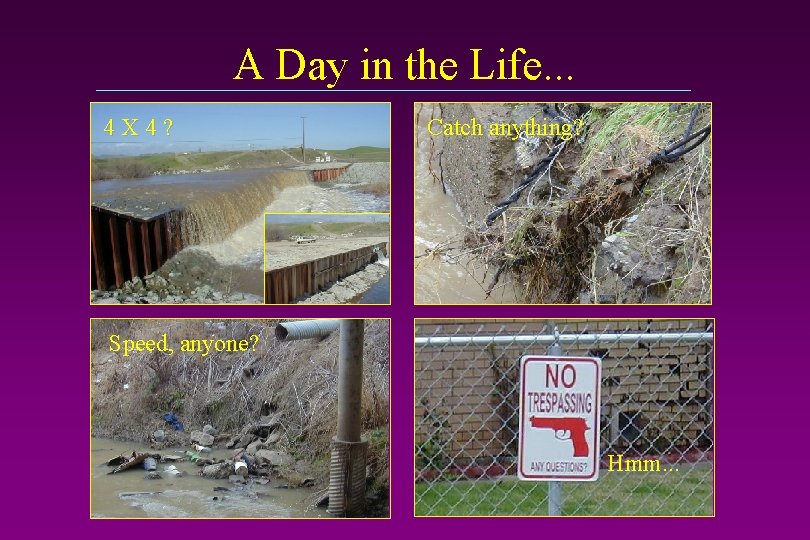
A Day in the Life. . . 4 X 4? Catch anything? Speed, anyone? Hmm. . .
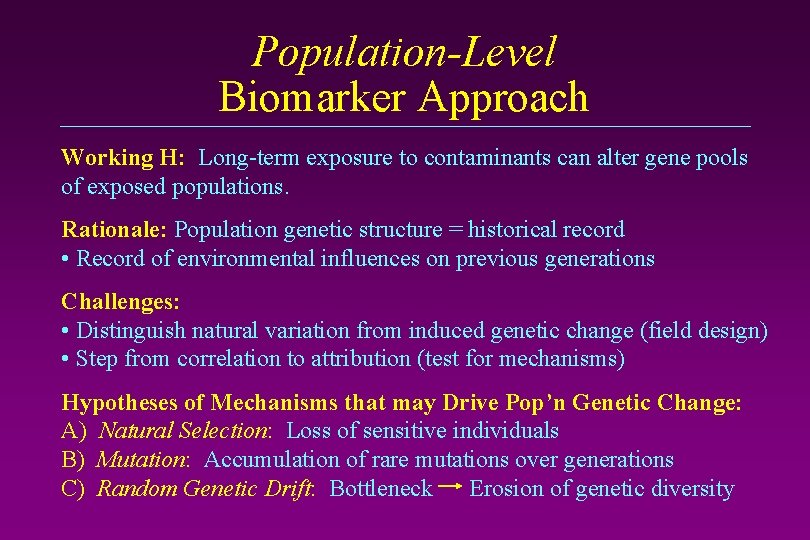
Population-Level Biomarker Approach Working H: Long-term exposure to contaminants can alter gene pools of exposed populations. Rationale: Population genetic structure = historical record • Record of environmental influences on previous generations Challenges: • Distinguish natural variation from induced genetic change (field design) • Step from correlation to attribution (test for mechanisms) Hypotheses of Mechanisms that may Drive Pop’n Genetic Change: A) Natural Selection: Loss of sensitive individuals B) Mutation: Accumulation of rare mutations over generations C) Random Genetic Drift: Bottleneck Erosion of genetic diversity
- Slides: 25