Biology of Global Change Main Driver of Global

Biology of Global Change

Main Driver of Global Change
")
Population Growth (%/year)

During lifetime, average American uses: 1 million times their weight in water 10, 000 times fossil fuels 10, 000 times construction materials 3000 x wood, metal etc. (i. e. manufactured products)

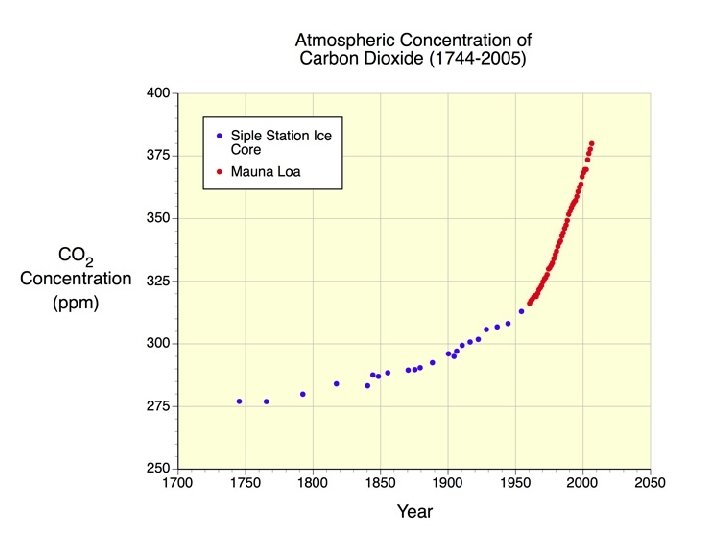
Energy Use Produces a lot of CO 2 that is a greenhouse gas

Fossil Fuel & Cement CO 2 Emissions Growth rate 2010 5. 9% yr Growth rate 2000 -2010 3. 1% per year Growth rate 2009 -1. 3% per year Growth rate 1990 -1999 1% per year - Uncertainty (6 -10%) + 1 Petagram (Pg) = 1015 grams = 1 Billion metric tons = 1 Gigaton Therefore, we put ~10 billion metric tons of CO 2 into the atmosphere per year Peters et al. 2011, Nature CC; Data: Boden, Marland, Andres-CDIAC 2011; Marland et al. 2009

Units • 1 Pg = 1 Petagram = 1 x 10¹⁵ g = 1 Billion metric tons = 1 Gigaton • 1 Tg = 1 Teragram = 1 x 10¹² g = 1 Million metric tons • 1 Kg Carbon (C) = 3. 67 Kg Carbon Dioxide (CO 2)
 Carbon Emissions")
2010 Growth Rates China 10. 4% 2500000 (C tons x 1, 000) Carbon Emissions per year Fossil Fuel CO 2 Emissions: Top Emitters 2000000 1500000 USA 4. 1% 1000000 Russian Fed. 500000 0 India Japan 9. 4% 5. 8% 6. 8% 2000 2010 199019911992199319941995199619971998199920002001200220032004200520062007200820092010 0 Time (y) From 1860 -1991: energy use per capita increased 93 x, while population increased only 4 x Global Carbon Project 2011; Peters et al. 2011, Nature CC; Data: Boden, Marland, Andres-CDIAC 2011
 127% of growth 200")
Change in CO 2 Emissions from Coal (2008 to 2010) 127% of growth 200 150 100 1) CO 2 emissions (Tg C y- 250 50 0 -50 -100 China India Developed Dev. world World Global Carbon Project 2011; Data: Boden, Marland, Andres-CDIAC 2011

Deforestation releases CO 2 Amazon Between 2000 -2010 land the size of Greece was deforested

Deforestation releases CO 2 Deforestation reduces habitat, removes native plants, leads to animal extinctions, diminishes CO 2 uptake by photosynthesis, increases decomposition, and accounts for 20% of anthropogenic CO 2 release.
 Current LUC emissions ~10% of total")
CO 2 Emissions from FF and LUC (19602010) Current LUC emissions ~10% of total CO 2 emission Updated from Le Quéré et al. 2009, Nature

Sea Level Rise Stefan Rahmstorf. 2007 Science Express Past sea level and sea level projections 1990 -2100 based on global mean temperature projections. The gray uncertainty range spans the range of temperature rise of 1. 4 - 5. 8 ºC combined with the best statistical fit. The dashed gray lines show the added uncertainty due to the statistical error.

Coasts ü Increased damage from floods and storms ü Large % of coastal wetlands lost ü Millions of people could experience coastal flooding
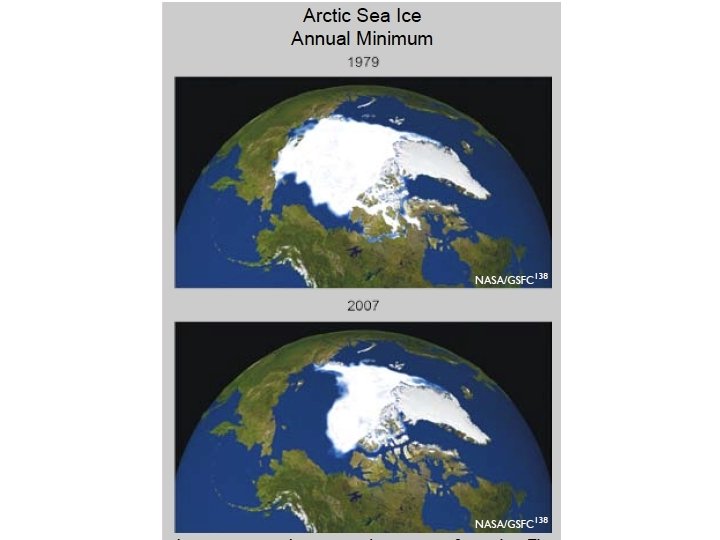

Greenland ice cap and global glaciers are melting at unprecedented rates

Water ü Increased availability in moist tropics & high latitudes ü Decreased availability with drought in mid latitudes and semi arid low latitudes ü Hundreds of millions of people subject to increased water stress
 ü Coral bleaching and widespread mortality ü")
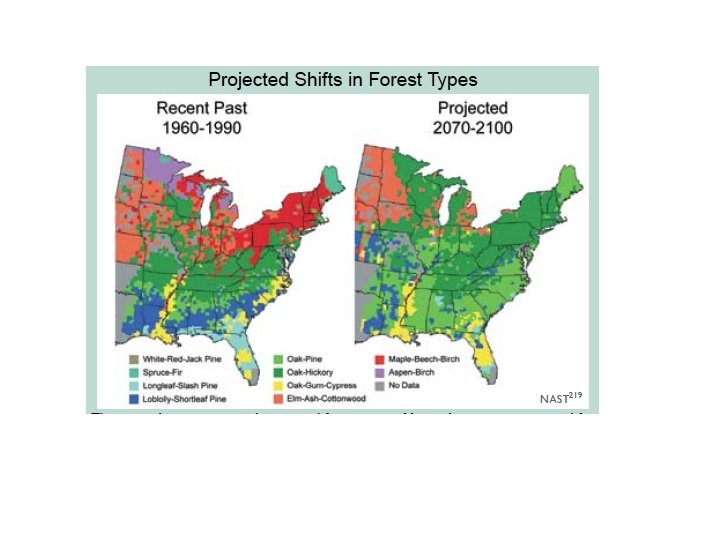
Ecosystems ü Significant extinctions of species (>40%) ü Coral bleaching and widespread mortality ü Terrestrial biosphere switches from sink to source of C ü Ecosystem changes in general (range shifts, fire risk)

Winter shift in fish distribution in the North Sea Fish with faster life cycles and smaller sizes tend to shift distributions with temp (A-cod; B-anglerfish; C-snake blenny) (Arrow indicate significant shit in latitude in one direction) Perry et al. , 2005 (Science)

Schwarzenbach et al. , 2006 Science

Schwarzenbach et al. , 2006 Science

Health ü Increased malnutrition, and diarrhoeal, cardiorespiratory, and infectious disease ü Increased morbidity and mortality from heat waves, floods, droughts ü Changed distribution of disease vectors
 Crust Components No change What if Organic Matter")
Global Biogeochemical Cycle (Garrels and Lerman) Crust Components No change What if Organic Matter Increases on Earth?

“Proof” of Model Fe. S 2 + Ca. CO 3 = gypsum + CH 2 O
- Slides: 38