
Biology Department Georgetown University Washington D C 20057
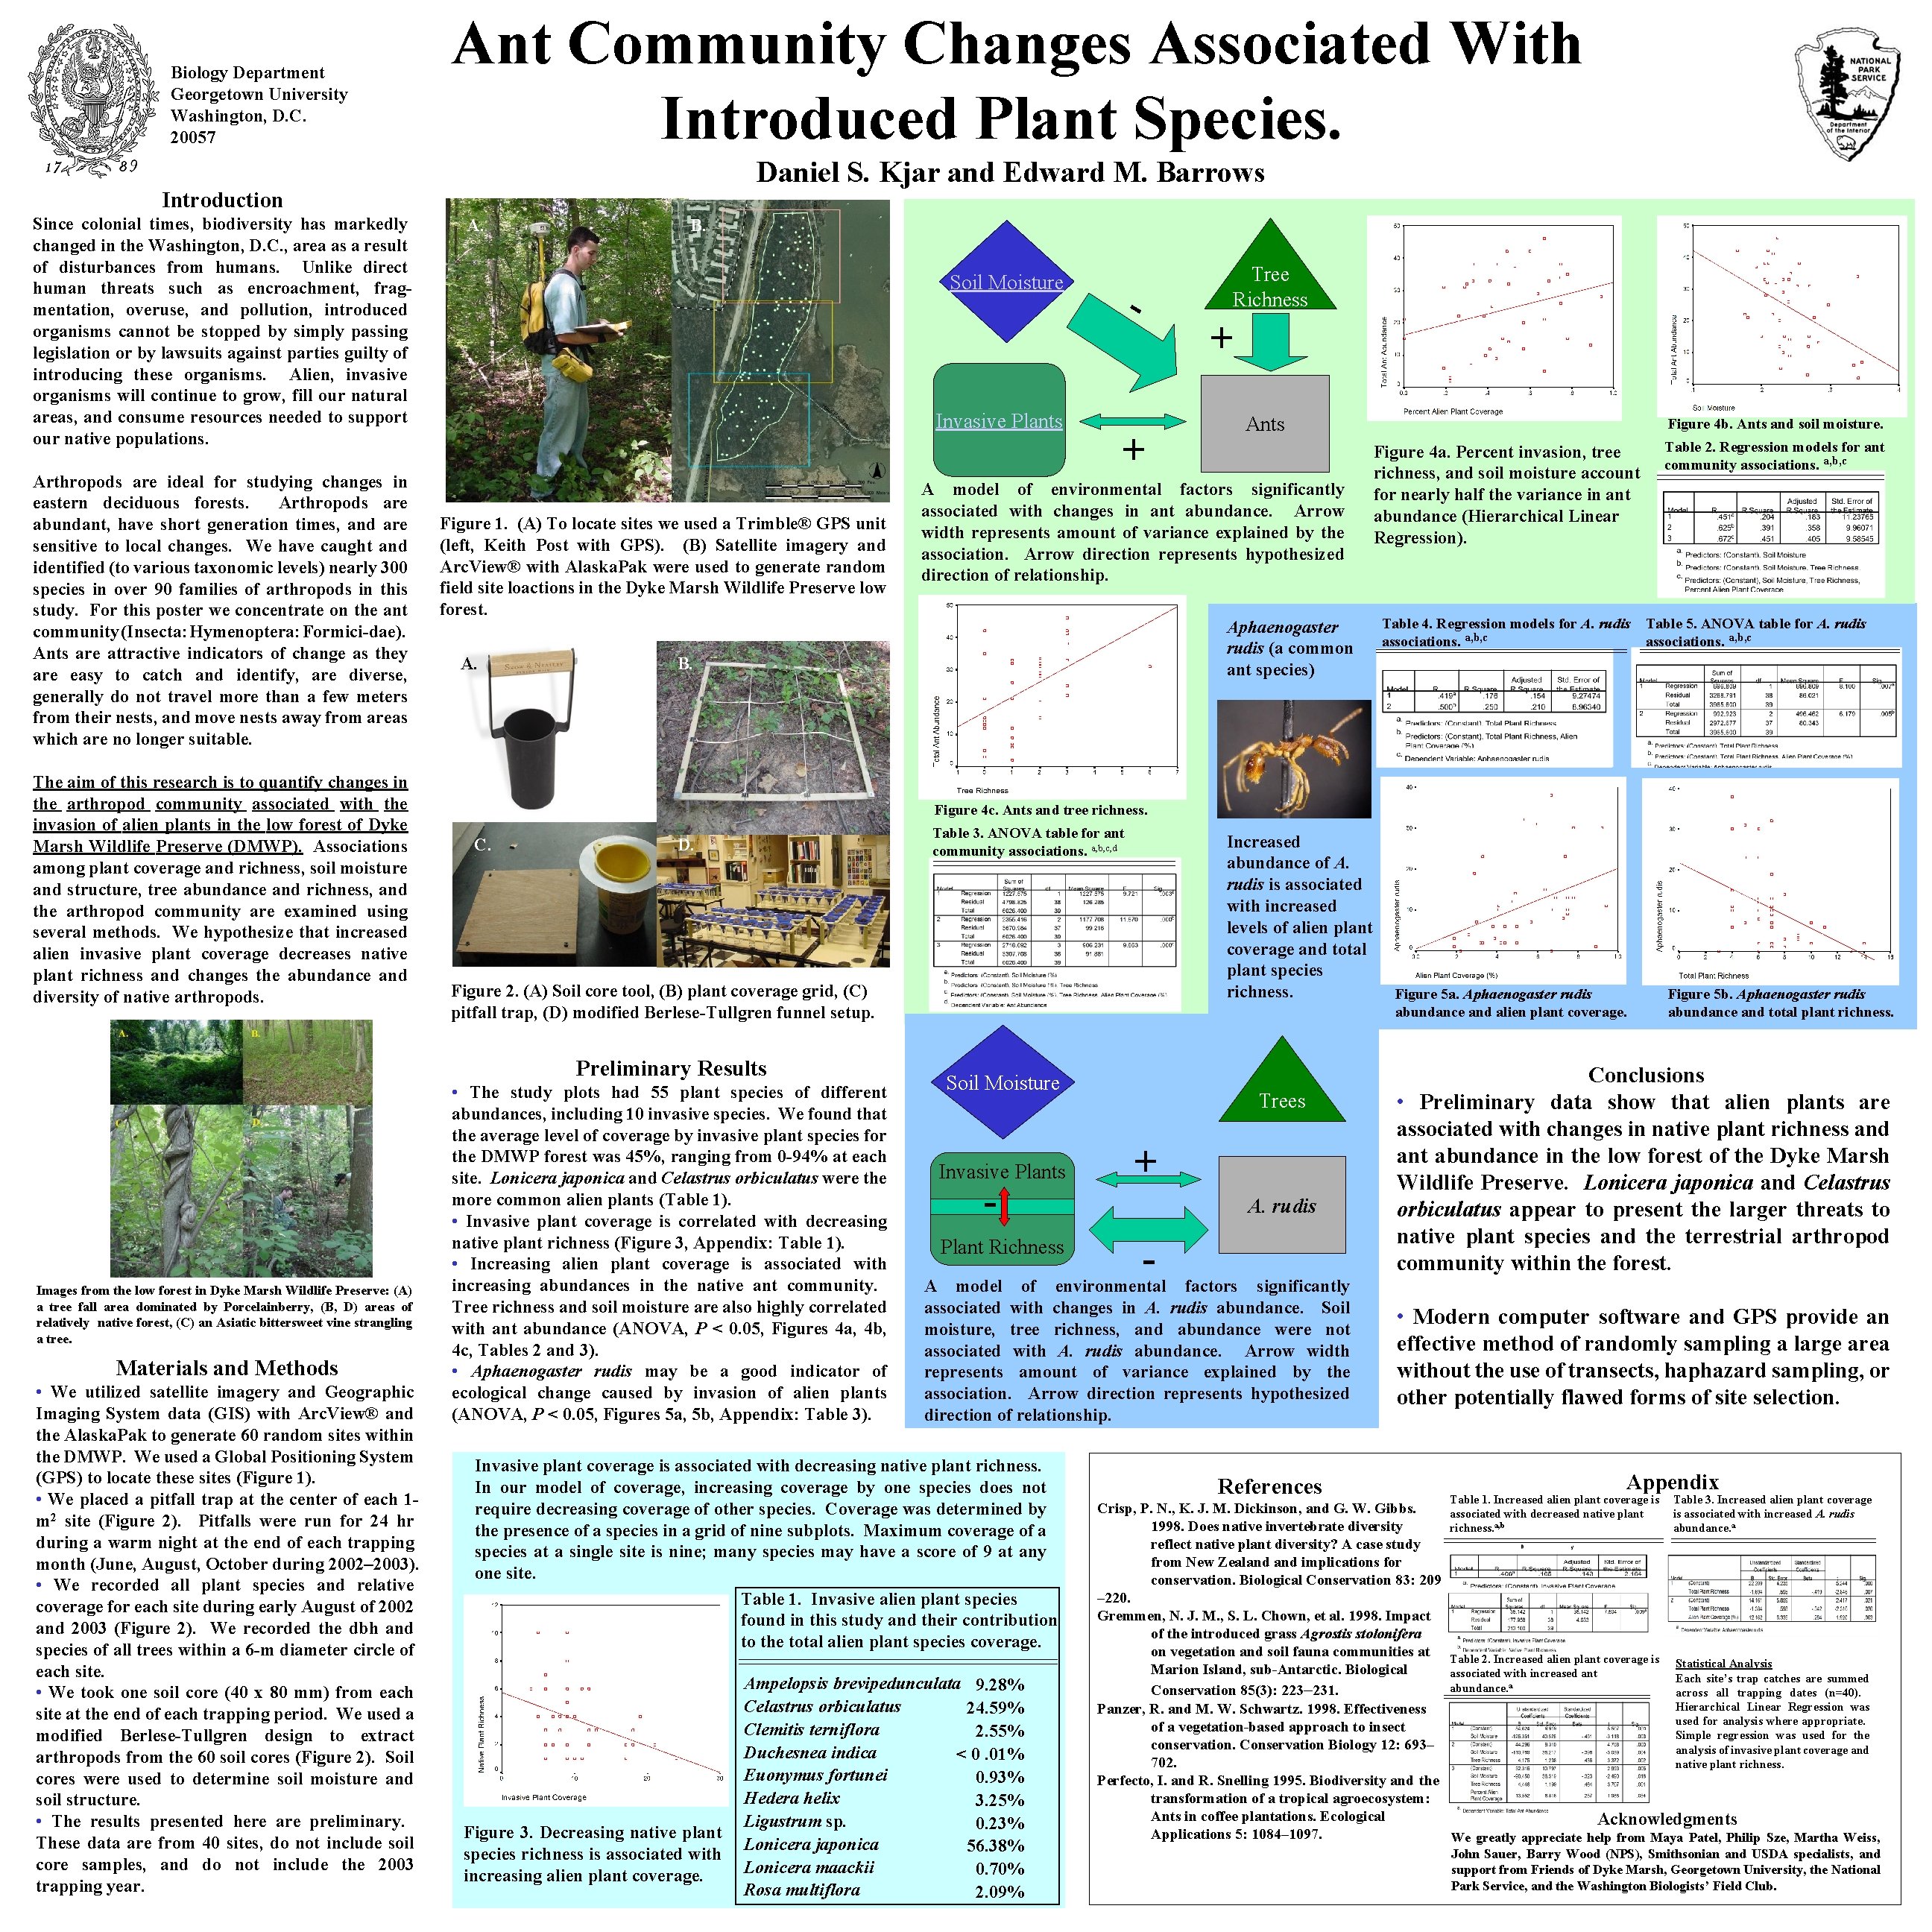
Biology Department Georgetown University Washington, D. C. 20057 Ant Community Changes Associated With Introduced Plant Species. Daniel S. Kjar and Edward M. Barrows Introduction Since colonial times, biodiversity has markedly changed in the Washington, D. C. , area as a result of disturbances from humans. Unlike direct human threats such as encroachment, fragmentation, overuse, and pollution, introduced organisms cannot be stopped by simply passing legislation or by lawsuits against parties guilty of introducing these organisms. Alien, invasive organisms will continue to grow, fill our natural areas, and consume resources needed to support our native populations. Arthropods are ideal for studying changes in eastern deciduous forests. Arthropods are abundant, have short generation times, and are sensitive to local changes. We have caught and identified (to various taxonomic levels) nearly 300 species in over 90 families of arthropods in this study. For this poster we concentrate on the ant community (Insecta: Hymenoptera: Formici-dae). Ants are attractive indicators of change as they are easy to catch and identify, are diverse, generally do not travel more than a few meters from their nests, and move nests away from areas which are no longer suitable. The aim of this research is to quantify changes in the arthropod community associated with the invasion of alien plants in the low forest of Dyke Marsh Wildlife Preserve (DMWP). Associations among plant coverage and richness, soil moisture and structure, tree abundance and richness, and the arthropod community are examined using several methods. We hypothesize that increased alien invasive plant coverage decreases native plant richness and changes the abundance and diversity of native arthropods. A. B. Soil Moisture Invasive Plants Figure 1. (A) To locate sites we used a Trimble® GPS unit (left, Keith Post with GPS). (B) Satellite imagery and Arc. View® with Alaska. Pak were used to generate random field site loactions in the Dyke Marsh Wildlife Preserve low forest. A. Materials and Methods • We utilized satellite imagery and Geographic Imaging System data (GIS) with Arc. View® and the Alaska. Pak to generate 60 random sites within the DMWP. We used a Global Positioning System (GPS) to locate these sites (Figure 1). • We placed a pitfall trap at the center of each 1 m 2 site (Figure 2). Pitfalls were run for 24 hr during a warm night at the end of each trapping month (June, August, October during 2002– 2003). • We recorded all plant species and relative coverage for each site during early August of 2002 and 2003 (Figure 2). We recorded the dbh and species of all trees within a 6 -m diameter circle of each site. • We took one soil core (40 x 80 mm) from each site at the end of each trapping period. We used a modified Berlese-Tullgren design to extract arthropods from the 60 soil cores (Figure 2). Soil cores were used to determine soil moisture and soil structure. • The results presented here are preliminary. These data are from 40 sites, do not include soil core samples, and do not include the 2003 trapping year. - + + Ants A model of environmental factors significantly associated with changes in ant abundance. Arrow width represents amount of variance explained by the association. Arrow direction represents hypothesized direction of relationship. Aphaenogaster rudis (a common ant species) B. Figure 4 b. Ants and soil moisture. Table 2. Regression models for ant community associations. a, b, c Figure 4 a. Percent invasion, tree richness, and soil moisture account for nearly half the variance in ant abundance (Hierarchical Linear Regression). Table 4. Regression models for A. rudis associations. a, b, c Table 5. ANOVA table for A. rudis associations. a, b, c Figure 4 c. Ants and tree richness. C. Table 3. ANOVA table for ant community associations. a, b, c, d D. Increased abundance of A. rudis is associated with increased levels of alien plant coverage and total plant species richness. Figure 2. (A) Soil core tool, (B) plant coverage grid, (C) pitfall trap, (D) modified Berlese-Tullgren funnel setup. Preliminary Results Images from the low forest in Dyke Marsh Wildlife Preserve: (A) a tree fall area dominated by Porcelainberry, (B, D) areas of relatively native forest, (C) an Asiatic bittersweet vine strangling a tree. Tree Richness • The study plots had 55 plant species of different abundances, including 10 invasive species. We found that the average level of coverage by invasive plant species for the DMWP forest was 45%, ranging from 0 -94% at each site. Lonicera japonica and Celastrus orbiculatus were the more common alien plants (Table 1). • Invasive plant coverage is correlated with decreasing native plant richness (Figure 3, Appendix: Table 1). • Increasing alien plant coverage is associated with increasing abundances in the native ant community. Tree richness and soil moisture also highly correlated with ant abundance (ANOVA, P < 0. 05, Figures 4 a, 4 b, 4 c, Tables 2 and 3). • Aphaenogaster rudis may be a good indicator of ecological change caused by invasion of alien plants (ANOVA, P < 0. 05, Figures 5 a, 5 b, Appendix: Table 3). Soil Moisture Invasive Plants - Plant Richness + A. rudis - A model of environmental factors significantly associated with changes in A. rudis abundance. Soil moisture, tree richness, and abundance were not associated with A. rudis abundance. Arrow width represents amount of variance explained by the association. Arrow direction represents hypothesized direction of relationship. Invasive plant coverage is associated with decreasing native plant richness. In our model of coverage, increasing coverage by one species does not require decreasing coverage of other species. Coverage was determined by the presence of a species in a grid of nine subplots. Maximum coverage of a species at a single site is nine; many species may have a score of 9 at any one site. Table 1. Invasive alien plant species found in this study and their contribution to the total alien plant species coverage. Figure 3. Decreasing native plant species richness is associated with increasing alien plant coverage. Trees Ampelopsis brevipedunculata 9. 28% Celastrus orbiculatus 24. 59% Clemitis terniflora 2. 55% Duchesnea indica < 0. 01% Euonymus fortunei 0. 93% Hedera helix 3. 25% Ligustrum sp. 0. 23% Lonicera japonica 56. 38% Lonicera maackii 0. 70% Rosa multiflora 2. 09% References Figure 5 a. Aphaenogaster rudis abundance and alien plant coverage. Figure 5 b. Aphaenogaster rudis abundance and total plant richness. Conclusions • Preliminary data show that alien plants are associated with changes in native plant richness and ant abundance in the low forest of the Dyke Marsh Wildlife Preserve. Lonicera japonica and Celastrus orbiculatus appear to present the larger threats to native plant species and the terrestrial arthropod community within the forest. • Modern computer software and GPS provide an effective method of randomly sampling a large area without the use of transects, haphazard sampling, or other potentially flawed forms of site selection. Appendix Table 1. Increased alien plant coverage is Table 3. Increased alien plant coverage Crisp, P. N. , K. J. M. Dickinson, and G. W. Gibbs. associated with decreased native plant is associated with increased A. rudis 1998. Does native invertebrate diversity richness. a, b abundance. a reflect native plant diversity? A case study from New Zealand implications for conservation. Biological Conservation 83: 209 – 220. Gremmen, N. J. M. , S. L. Chown, et al. 1998. Impact of the introduced grass Agrostis stolonifera on vegetation and soil fauna communities at Table 2. Increased alien plant coverage is Statistical Analysis Marion Island, sub-Antarctic. Biological associated with increased ant Each site’s trap catches are summed a abundance. Conservation 85(3): 223– 231. across all trapping dates (n=40). Hierarchical Linear Regression was Panzer, R. and M. W. Schwartz. 1998. Effectiveness used for analysis where appropriate. of a vegetation-based approach to insect Simple regression was used for the conservation. Conservation Biology 12: 693– analysis of invasive plant coverage and 702. native plant richness. Perfecto, I. and R. Snelling 1995. Biodiversity and the transformation of a tropical agroecosystem: Ants in coffee plantations. Ecological Acknowledgments Applications 5: 1084– 1097. We greatly appreciate help from Maya Patel, Philip Sze, Martha Weiss, John Sauer, Barry Wood (NPS), Smithsonian and USDA specialists, and support from Friends of Dyke Marsh, Georgetown University, the National Park Service, and the Washington Biologists’ Field Club.
- Slides: 1