Biology 227 Methods in Modern Microscopy Andres Collazo

Biology 227: Methods in Modern Microscopy Andres Collazo, Director Biological Imaging Facility Yonil Jung, Graduate Student, TA Week 10 Multispectral Imaging

Spectral or Lambda Scanning Multispectral Imaging Instead of Z – stacks, collect λ – stacks
 excitation images acquired in a single channel")
Spectral image dataset -stack can be: (i) excitation images acquired in a single channel at different excitation (ii) emission images acquired at a single excitation in several channels at different ( emission) Garini et al, Cytometry Part A, 2006

Spectral image dataset Garini et al, Cytometry Part A, 2006

Spectral imaging methods: Spatial-scan • 3 Different ways used by microscope companies

Dispersion through refraction versus diffraction 1. Diffraction grating 2. Refraction through prism Note how longer wavelengths (red) diffract at greater angle than shorter wavelengths (blue) but they refract at smaller angle than shorter wavelengths.

Monochromator: Optical instrument for generating single colors • Used in optical measuring instruments • How a monochromator works according to the principle of dispersion • Most actually disperse through diffraction, not prism Monochromator (Prism Type) Entrance Slit Exit Slit

Spectral imaging with a grating

History of the Zeiss META detector • Where did the idea of a multichannel detector come from?

History of the Zeiss META detector • Where did the idea of a multichannel detector come from? • Collaboration between the Jet Propulsion Laboratory, Scott Fraser’s lab here at Caltech and Zeiss
 • Instrument for earth imaging and ecological research. •")
Airborne Visible/Infrared Imaging Spectrometer (AVIRIS) • Instrument for earth imaging and ecological research. • Instrument has 224 detectors. • Covers a range from 380 nm to 2500 nm.
 • Original • Next Generation (AVIRISng)")
Airborne Visible/Infrared Imaging Spectrometer (AVIRIS) • Original • Next Generation (AVIRISng)

History of the Zeiss META detector • Zeiss META had 8* channel detector • Replaced by 32 channel Quasar detector

Spectral imaging with a prism and mirrors
 excitation images acquired in a single channel")
Spectral image dataset -stack can be: (i) excitation images acquired in a single channel at different excitation (ii) emission images acquired at a single excitation in several channels at different ( emission) Garini et al, Cytometry Part A, 2006

Leica lambda squared map • White light laser that emits from 470 to 670 nanometers

Choose spectrally well-separated dyes Source: Zimmermann, T. , 2005. Spectral Imaging and Linear Unmixing in Light Microscopy, in: Rietdorf, J. (Ed. ), Microscopy Techniques. Springer Berlin Heidelberg, pp. 245 -265. if not possible: use spectral unmixing!

Spectral unmixing: general concept Multi-channel Detector Collect Lambda Stack FITC Raw Image Sytox-green Derive Emission Fingerprints Unmixed Image
 •")
Spectral unmixing • 8 channel detector (can you guess the instrument used? ) • Using Emission spectra • Example of parallel acquisition • Reference spectra important

Linear spectral unmixing: principle To solve and obtain Ai for each pixel From Michael Liebling, UCSB

Linear spectral unmixing: principle 2 possibilities: From Michael Liebling, UCSB

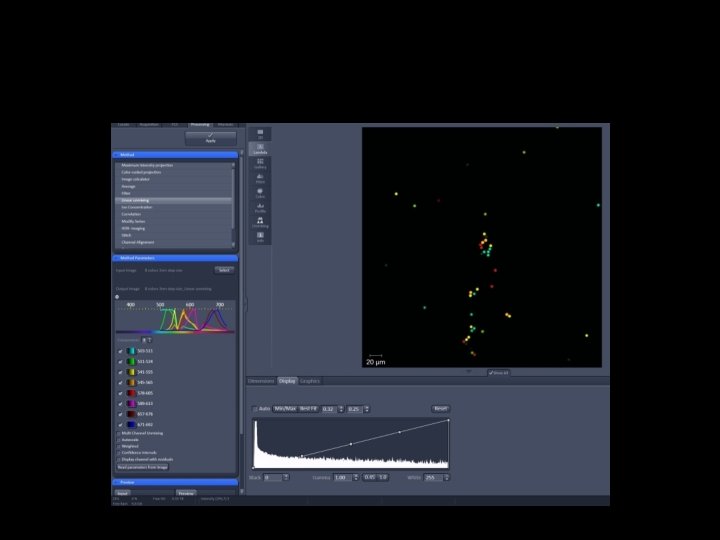
Linear Unmixing, Class example 8 Colors Green: 503 -511 -524 Orange: 541 -555, 545 -565 Far Red: 657 -676 671 -692 Red: 578 -605 589 -613

Linear Unmixing, Class example 8 Colors, Reference Spectra • Collect reference spectra for each color • Ideally 9 samples • 8 for each color alone • 1 with all 8 together • Sample slide had 8 colors across 4 wells • Linear unmixing with Zeiss Zen software • Note notches in sprecta

Linear Unmixing, 9 nm step size 8 Colors

Linear Unmixing, 3 nm step size 8 Colors

Spectral unmixing of autofluorescence Red and green arrows indicate regions from which sample spectra were obtained. Blue = computed spectrum (a) Image obtained at the peak of one of the quantum dots. (b) Unmixed image of the 570 -nm quantum dot. (c) Unmixed image of the 620 -nm quantum dot. (d) Combined pseudocolor image of (b) (green), (c), and autofluorescence channel (in white). Mansfield et al, Journal of Biomedical Optics (2005)

Determine the two photon spectra of uncharacterized dye • In vivo Hair Cell Dye, FM 1 -43 Spectra

Spectral or Lambda Scanning • Separate very similar colored fluorophores • e. g. FITC and Sytox green. • Could be used to eliminate non-specific background fluorescence that has different emission spectra. • Different technologies for spectrum detection • Sequentially (Leica SP) • Simultaneously (Zeiss QUASAR)
 survey period for WI 2015")
Course Business • The Teaching Quality Feedback Report (TQFR) survey period for WI 2015 -16 will open next Monday, March 14, 2015. Students will have several weeks to submit their reviews; however, you will be able to view student responses beginning on Monday, March 21 via the TQFR Reports link in access. caltech (https: //access. caltech. edu). • Feedback

Spectral unmixing: GFP/YFP
- Slides: 31