BiologicallyBased Risk Estimation for RadiationInduced Chronic Myeloid Leukemia

Biologically-Based Risk Estimation for Radiation-Induced Chronic Myeloid Leukemia Radiation Carcinogenesis: Applying Basic Science to Epidemiological Estimates of Low-Dose Risks

Overview v Bayesian methods and CML v Linear-Quadratic-Exponential model v Likelihood and prior data sets v Baseline LQE estimate of CML risk v Improved risk estimates based on BCR-to-ABL distances and CML target cell numbers v Net lifetime CML risk: Can it have a U-shaped low dose response?

Bayesian Methods Priors+ likelihood estimates posteriors v Posterior information equals prior plus likelihood information v Posterior means are information-weighted averages of prior and likelihood means v Posteriors are normal if the prior and likelihood estimates are normal v Priors act as soft constraints on the parameters v Priors and structures come from the same data v

Chronic Myeloid Leukemia v CML is homogeneous, prevalent, radiationinduced, and caused by BCR-ABL v The a 2 intron of ABL is unusually large v Leukemic endpoints have rapid kinetics v White blood cells need fewer stages v Linear CML risk is not biologically-based v Linear-quadratic-exponential CML risk does have a biological basis

Linear Risk Model Using the BCR-ABL to CML waiting time density and the linear model we maximized the log-likelihood

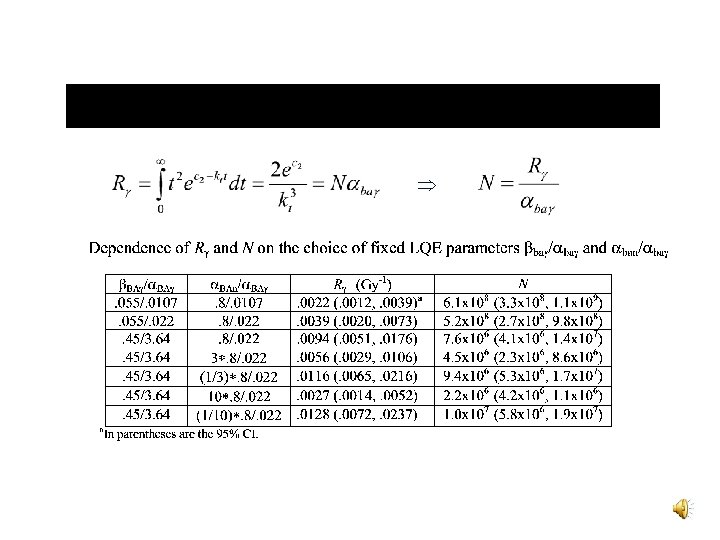
Linear-Quadratic-Exponential Model The LQE model is where D i and Dni are the gamma and neutron doses in gray N is the number of CML target cells per adult P(ba|T) is the probability of BCR-ABL given a translocation This is a one-stage model of carcinogenesis.

Likelihood Data v CML is practically absent in Nagasaki v High dose HF waiting times are too long v HM data is consistent with prior expectations

aage at diagnosis = observed cases (E = expected background cases based on U. S. incidence rates) ctsx = average of the times since exposure for the cases b. O

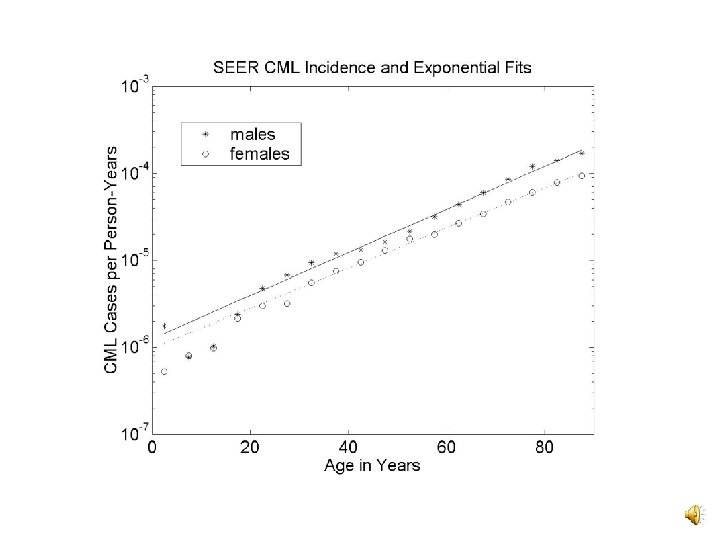
Prior Data: Sources v C 1 and k: SEER data v kt : Patients irradiated for BGD v k, k and kn : CAFC and MRA assays v / and n/ : Lymphocyte dicentric yields v C 2 : Depends on , kt, N, and P(ba|T) • N: SEER and translocation age structure data • P(ba|T): BCR and ABL intron sizes, the genome size

Parameter Estimates

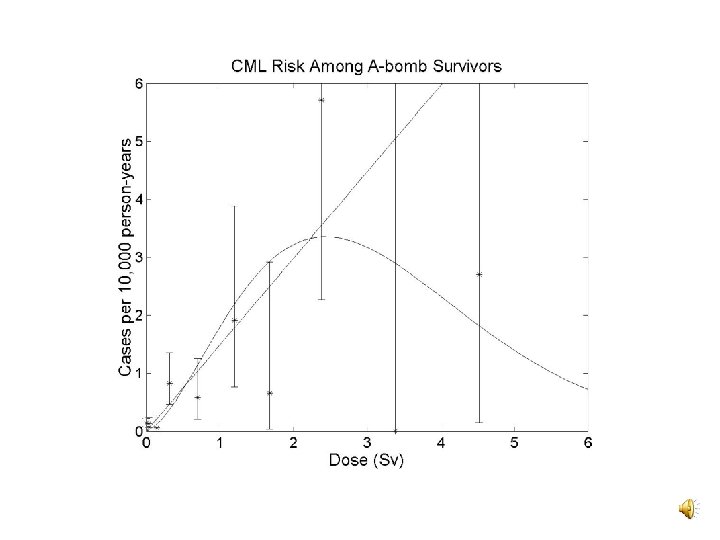
CML Risk Estimates The lifetime excess CML risk in the limit of low -ray doses yields v Linear model • R = 0. 0075 Gy-1 and Q = 0. 0158 Gy-1 v LQE posterior model • R = 0. 0022 Gy-1 and Q = 0. 0042 Gy-1

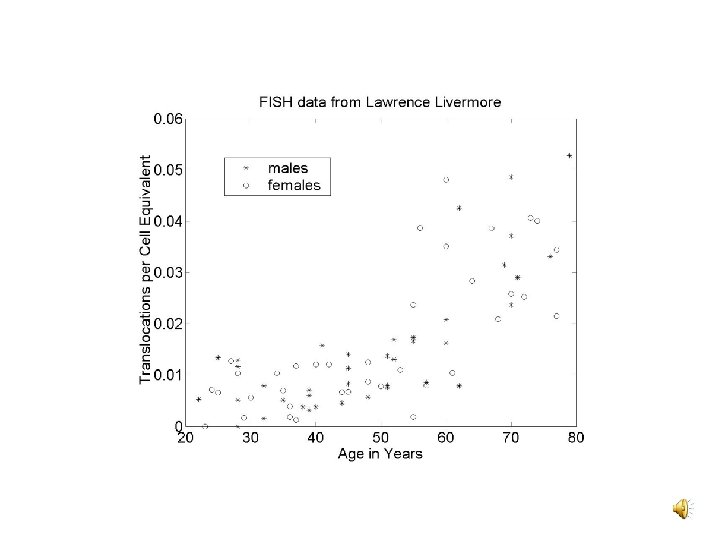
CML Target Cell Numbers v A comparison of age responses for CML and total translocations suggests a CML target cell number of 2 x 10⁸ v 1012 nucleated marrow cells per adult and one LTC-IC per 105 marrow cells suggests 107 CML target cells v P(ba|T) = 2 Tabl. Tbcr/ 2 may not hold
 Chromosoma 108: 426 -435")
BCR-to-ABL 2 D distances in lymphocytes Kozubek et al. (1999) Chromosoma 108: 426 -435
 = probability of a BCR-ABL translocation per G")
Theory of Dual Radiation Action P(ba|D) = probability of a BCR-ABL translocation per G 0/G 1 cell given a dose D t. D(r)dr = expected energy at r given an ionization event at the origin = intra-track component + inter-track component Sba(r) = the BCR-to-ABL distance probability density g(r) = probability that two DSBs misrejoin if they are created r units apart Y = 0. 0058 DSBs per Mb per Gy; = mass density TBCR = 5. 8 kbp; TABL = 300 kbp
![Estimation of g(r) d in [. 01, . 025], dx in [. 04, .](http://slidetodoc.com/presentation_image_h2/f33b304be4611a56879c4ffbd09458b5/image-18.jpg "Estimation of g(r) d in [. 01, . 025], dx in [. 04, .")
Estimation of g(r) d in [. 01, . 025], dx in [. 04, . 05], d in [. 05, . 06] R = 3. 7 um r 0 = 0. 24 m, p 0 = 0. 06 G=35 DSB/Gy per cell 6. 25 kev/um 3 = 1 Gy

Dead-Band Control of HSC levels v Transplant doses of 10, 100, and 1000 CRU => CRU levels 1 -20% or 15 -60% normal Blood (1996) 88: 2852 -2858 v Broad variation in human HSC levels Stem Cells (1995) 13: 512 -516 v Low levels of HSCs in BMT patients Blood (1998) 91: 1959 -1965
 and the log-survival dose response")
Figure 3: Hypersensitivity ratios in the literature (left panel) and the log-survival dose response for T 98 G human glioma cells (right panel). Figures from Joiner, M. C. , Marples, B. , Lambin, P. , Short, S. C. and Turesson, I. , Low-dose hypersensitivity: current status and possible mechanisms. Int J Radiat Oncol Biol Phys (2001) 49: 379 -389.

Net Lifetime CML Risk The net lifetime excess risk of CML is Letting Dn = 0 while D 0 We solved R 0 = 0 for k s as a function of exposure age x.
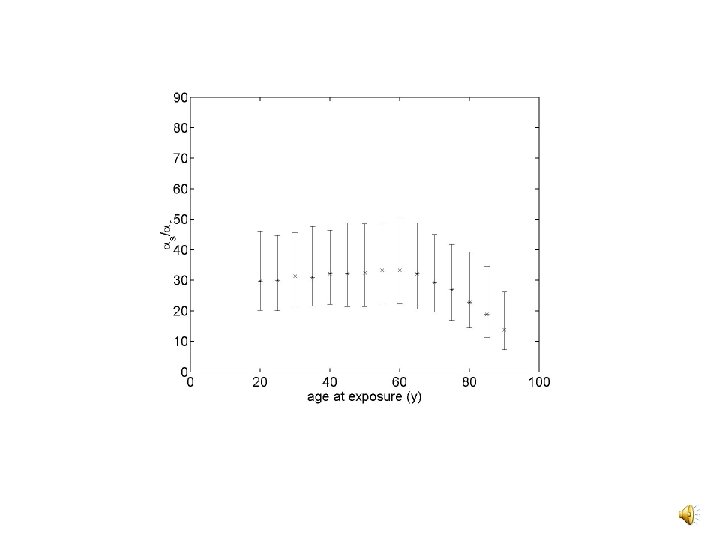
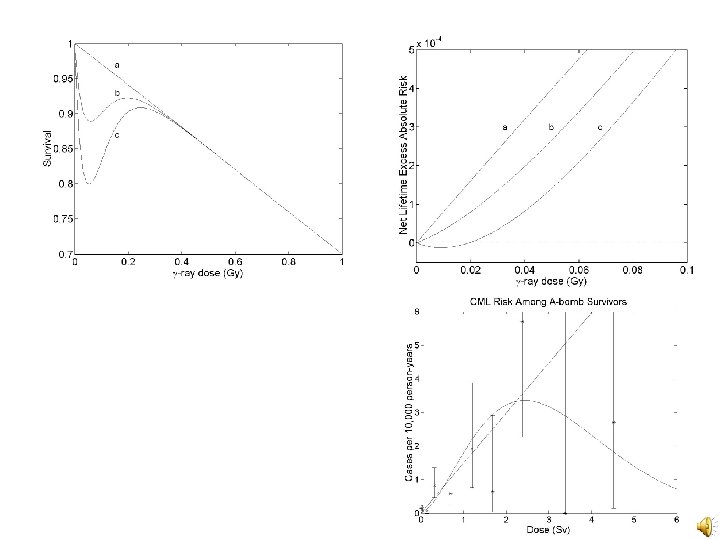

Conclusions v Bayesian methods provide a natural framework for biologically based risk estimation v BCR-to-ABL distance data and knowledge of CML target cell numbers can be useful in a biologically based approach to CML risk estimation v Low dose hypersensitivity to killing might lead to a U-shaped low dose response if there is a deadband in the control of target cell numbers

Acknowledgments Rainer Sachs v David Hoel v NIH and DOE v
- Slides: 26