
Biological Interactions of selenium and tellurium Bioprocessing Detection
Biological Interactions of selenium and tellurium: Bioprocessing, Detection, and Toxicity Radhika Burra, Gonzalo A. Pradenas, Claudio C. Vásquez and Thomas G. Chasteen
Selenium Ø identified as an element in 1917, named from the Greek word, ‘selene’ Ø exists in different forms: ü metallic, ü water soluble and ü gaseous. Ø considered as an essential trace nutrient Ø used in the treatment of serious deficiency diseases Ø used as an anti-oxidant, in glass manufacturing industry, semi- conductor materials and in electronic applications
Tellurium Ø discovered in 1782, named after Latin word ‘tellus’ Ø extremely rare element Ø chemically related to selenium and sulfur Ø mildly toxic, teratogenic Ø used in semiconductor and electronic industry Ø used in the treatment of syphilis and leprosy
Why we are concerned? ? ? Ø exposure is fatal to living beings. Ø considered as a severe environmental problem. Ø environmental problems include, ü water contamination • Kesterson Reservoir of California • Power River Basin, Wyoming ü soil contamination • selenium contamination affecting plants and animals

What is Bioprocessing? ? Ø Environmental clean-up method includes: ü Biological treatment-bioprocessing. ü Filtration after p. H adjustment ü Evaporation and soil removal Chemical detoxification methods } ü Bioprocessing: also called bioremediation/bioreduction: • use of microorganisms or their enzymes for detoxification. • different microbial pathways for the metabolism of toxic compounds. • detoxify soluble toxic ions to insoluble and other less toxic forms.
Bacteria currently being used Ø LHVE - species of interest. Ø characteristics include: ü gram positive, rod shaped bacteria ü forms spores. ü gelatinase activity. Ø classified as a Bacillus spp. Ø isolated from Huerquehue National park, Chile. Ø selenium (Se) resistant. Ø reduce Se in solution to elemental Se. Ø can be seen as a blood-red precipitate.
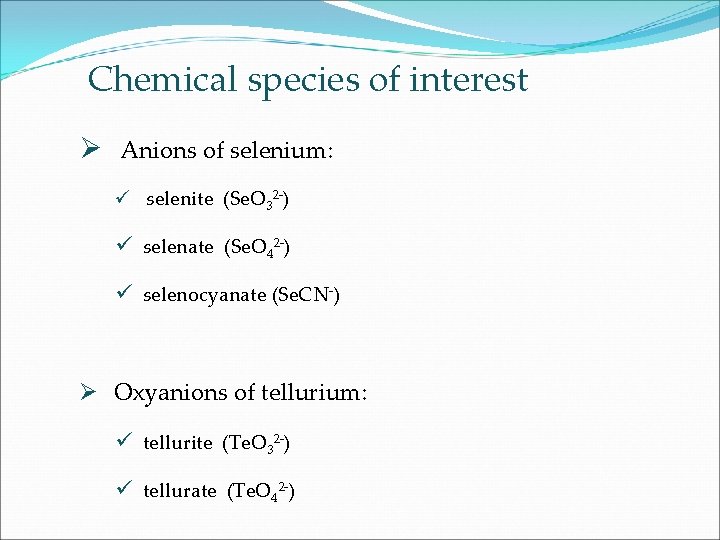
Chemical species of interest Ø Anions of selenium: ü selenite (Se. O 32 -) ü selenate (Se. O 42 -) ü selenocyanate (Se. CN-) Ø Oxyanions of tellurium: ü tellurite (Te. O 32 -) ü tellurate (Te. O 42 -)
Instrumentation Ø Gas chromatography with fluorine induced sulfur chemiluminescence detector (GC-SCD) ü analyze and separate volatile compounds ü specific for Se, Te, and Sb compounds ü detection limits are in picogram range Ø Gas chromatography- mass spectrometry (GC-MS) ü identification of structure of the unknown compounds
Sample preparation Ø Luria-Bertani (LB) medium: tryptone, sodium chloride, yeast extract, water. Ø p. H adjusted to 7. Ø autoclave at 1200 C. Ø preparation of preculture. Ø incubation at 370 C for approximately 24 hrs. Ø growth curve and headspace samples preparation. Ø amendment with different metalloid concentrations.
Growth curve analysis Ø performed using liquid culture absorbance at 526 nm Ø readings are taken at regular intervals of time Ø log phases of growth are estimated as the linear portion of the log of absorbance versus time plot Ø the specific growth rate gave a clear idea about the relative toxicity of each of the amended metalloid Ø lower specific growth rates suggest higher toxicity
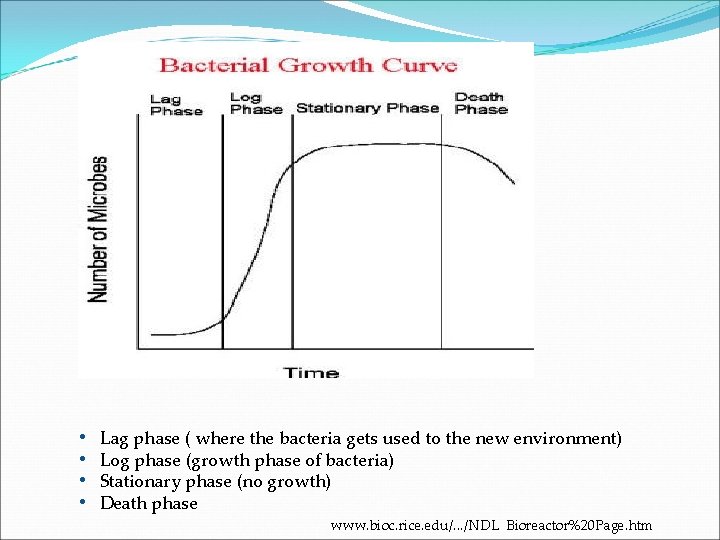
• Lag phase ( where the bacteria gets used to the new environment) • Log phase (growth phase of bacteria) • Stationary phase (no growth) • Death phase www. bioc. rice. edu/. . . /NDL Bioreactor%20 Page. htm
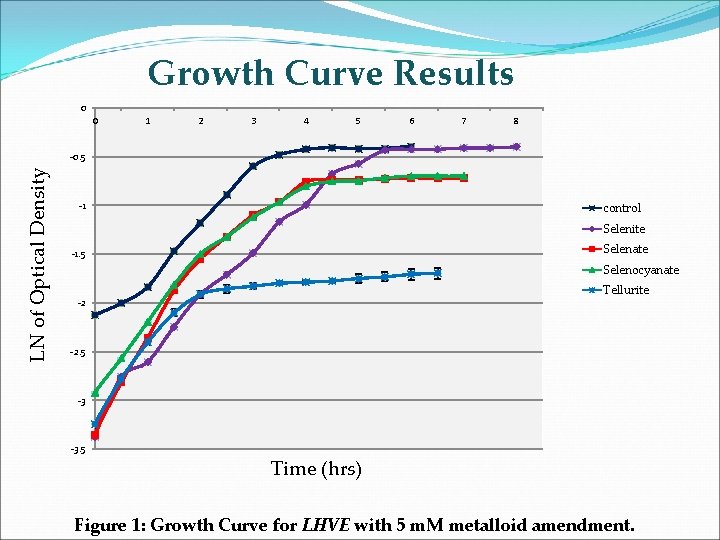
Growth Curve Results 0 0 1 2 3 4 5 6 7 8 LN of Optical Density -0. 5 -1 control Selenite Selenate -1. 5 Selenocyanate Tellurite -2 -2. 5 -3 -3. 5 Time (hrs) Figure 1: Growth Curve for LHVE with 5 m. M metalloid amendment.
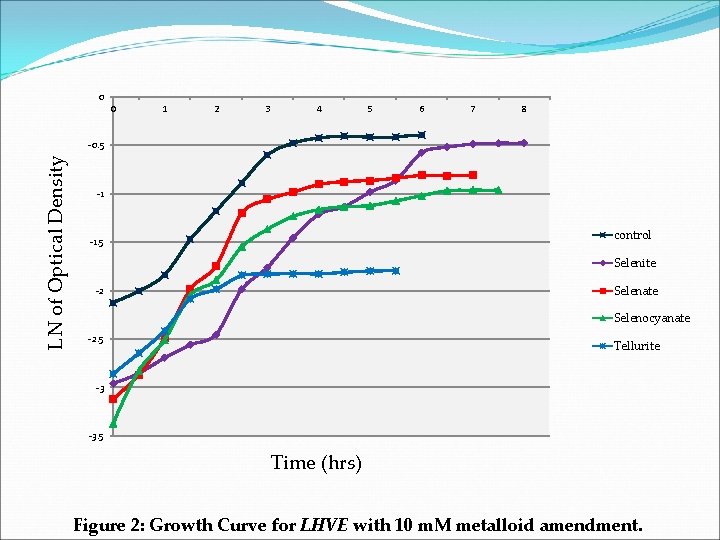
0 0 1 2 3 4 5 6 7 8 LN of Optical Density -0. 5 -1 control -1. 5 Selenite Selenate -2 Selenocyanate -2. 5 Tellurite -3 -3. 5 Time (hrs) Figure 2: Growth Curve for LHVE with 10 m. M metalloid amendment.
Zone of Inhibition Ø second method of estimating the relative toxicity Ø it is the clear region around the paper disc saturated with metalloid solution on the agar surface Ø this is an indication of the absence, or the effective inhibition, of microbial growth by the metalloid Ø zone of inhibition of 52 mm was observed for tellurite amended plate Ø tellurite was proved to be more highly toxic than all selenium anions Ø these set of experiments further confirmed the growth curve results
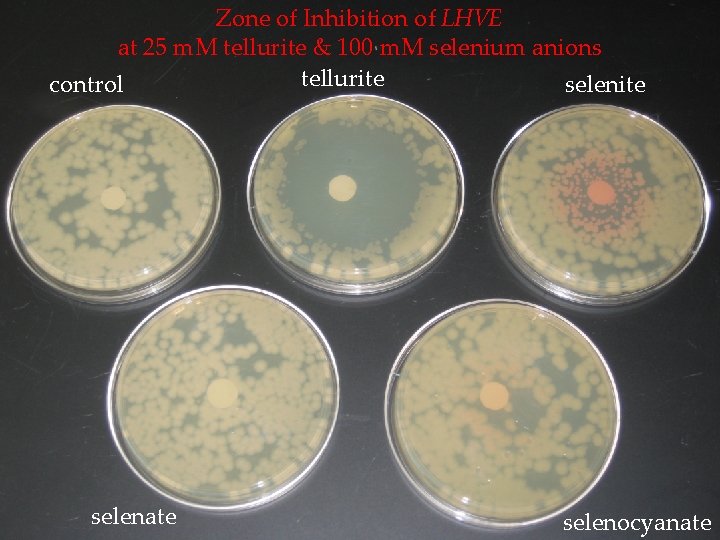
Zone of Inhibition of LHVE at 25 m. M tellurite & 100 m. M selenium anions tellurite control selenite selenate selenocyanate
Headspace Analysis Ø part of the bioreduction process involves methylating Se Ø the headspace of the bacteria is sampled using solid-phase microextraction fiber (SPME) Ø fiber thickness is 75 µm (larger the surface area, the greater the adsorption) Ø fiber exposure time is about 20 -45 minutes. Ø splitless injection of sample in 2750 C injector. Ø temperature Program: 300 C for 2 minutes, ramped 150/min and held at 2750 C for 5 minutes.
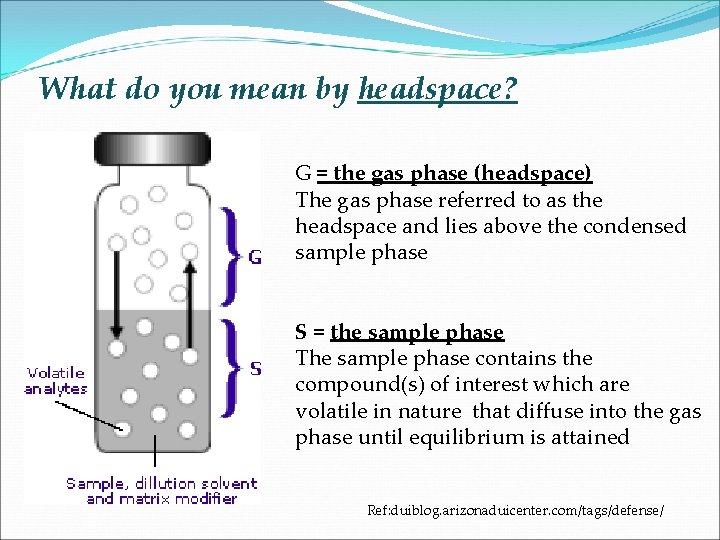
What do you mean by headspace? G = the gas phase (headspace) The gas phase referred to as the headspace and lies above the condensed sample phase S = the sample phase The sample phase contains the compound(s) of interest which are volatile in nature that diffuse into the gas phase until equilibrium is attained Ref: duiblog. arizonaduicenter. com/tags/defense/
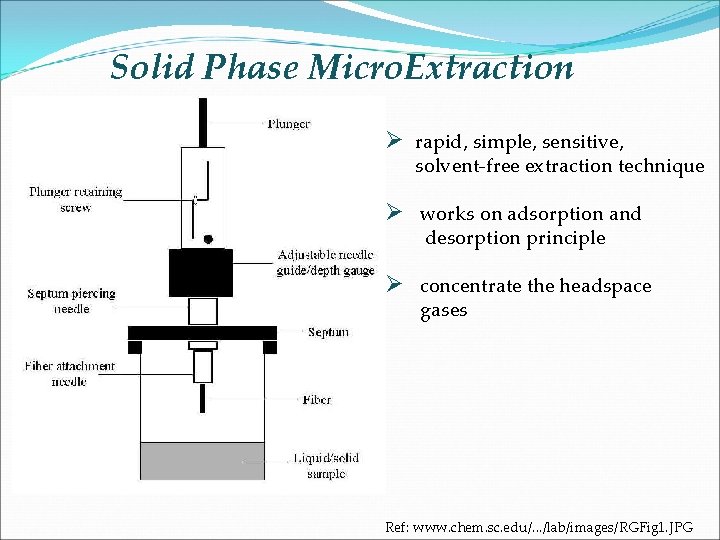
Solid Phase Micro. Extraction Ø rapid, simple, sensitive, solvent-free extraction technique Ø works on adsorption and desorption principle Ø concentrate the headspace gases Ref: www. chem. sc. edu/. . . /lab/images/RGFig 1. JPG
Headspace Results Me. SH- methanethiol DMe. DS- dimethyl disulfide DMe. TS- dimethyl trisulfide Figure 3: Chromatogram of LHVE control after 48 h.
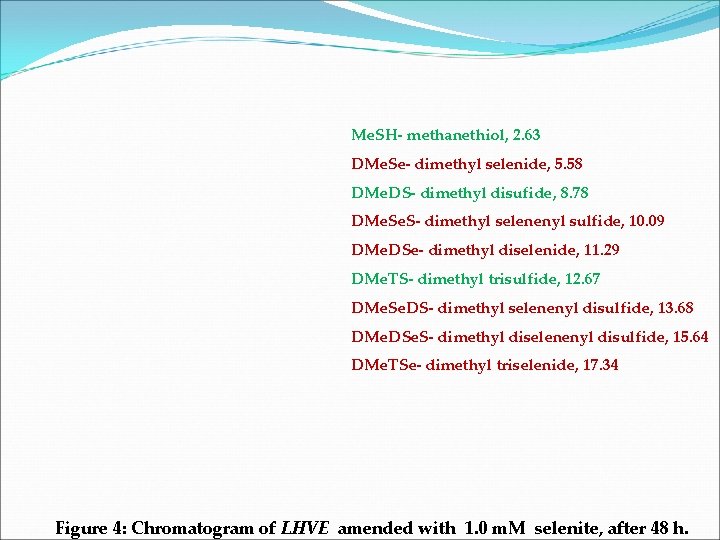
Me. SH- methanethiol, 2. 63 DMe. Se- dimethyl selenide, 5. 58 DMe. DS- dimethyl disufide, 8. 78 DMe. S- dimethyl selenenyl sulfide, 10. 09 DMe. DSe- dimethyl diselenide, 11. 29 DMe. TS- dimethyl trisulfide, 12. 67 DMe. Se. DS- dimethyl selenenyl disulfide, 13. 68 DMe. DSe. S- dimethyl diselenenyl disulfide, 15. 64 DMe. TSe- dimethyl triselenide, 17. 34 Figure 4: Chromatogram of LHVE amended with 1. 0 m. M selenite, after 48 h.
Me. SH- methanethiol, 2. 60 DMe. DS- dimethyl disufide, 8. 76 DMe. TS- dimethyl trisulfide, 12. 66 Figure 5: Chromatogram of LHVE amended with 1 m. M tellurite, after 48 h.
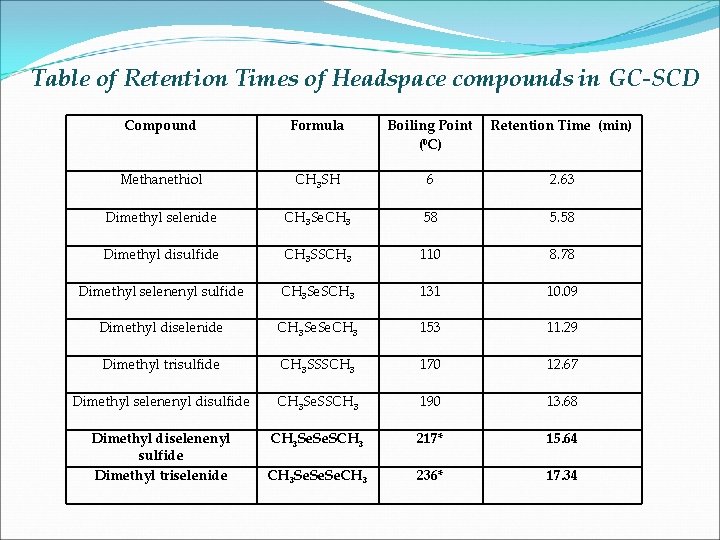
Table of Retention Times of Headspace compounds in GC-SCD Compound Formula Boiling Point (0 C) Retention Time (min) Methanethiol CH 3 SH 6 2. 63 Dimethyl selenide CH 3 Se. CH 3 58 5. 58 Dimethyl disulfide CH 3 SSCH 3 110 8. 78 Dimethyl selenenyl sulfide CH 3 Se. SCH 3 131 10. 09 Dimethyl diselenide CH 3 Se. CH 3 153 11. 29 Dimethyl trisulfide CH 3 SSSCH 3 170 12. 67 Dimethyl selenenyl disulfide CH 3 Se. SSCH 3 190 13. 68 Dimethyl diselenenyl sulfide Dimethyl triselenide CH 3 Se. SCH 3 217* 15. 64 CH 3 Se. Se. CH 3 236* 17. 34
GC-MS Results Figure 6: Total ion chromatogram of an empty SPME fiber.
From the SPME fiber Figure 7: Total ion chromatogram of LHVE control after 72 h.
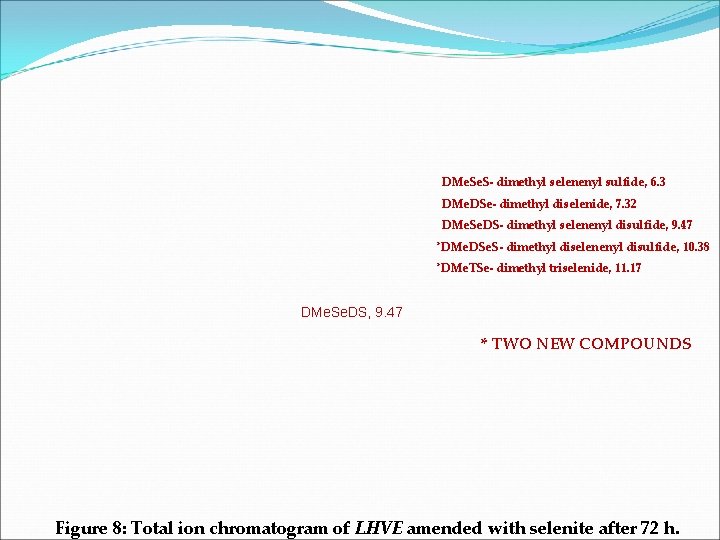
DMe. S- dimethyl selenenyl sulfide, 6. 3 DMe. DSe- dimethyl diselenide, 7. 32 DMe. Se. DS- dimethyl selenenyl disulfide, 9. 47 *DMe. DSe. S- dimethyl diselenenyl disulfide, 10. 38 *DMe. TSe- dimethyl triselenide, 11. 17 DMe. Se. DS, 9. 47 * TWO NEW COMPOUNDS Figure 8: Total ion chromatogram of LHVE amended with selenite after 72 h.
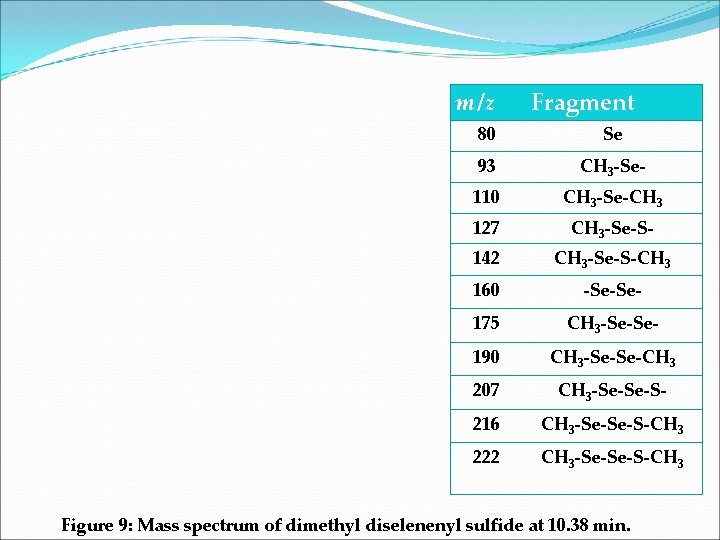
m/z Fragment 80 Se 93 CH 3 -Se- 110 CH 3 -Se-CH 3 127 CH 3 -Se-S- 142 CH 3 -Se-S-CH 3 160 -Se-Se- 175 CH 3 -Se-Se- 190 CH 3 -Se-Se-CH 3 207 CH 3 -Se-Se-S- 216 CH 3 -Se-Se-S-CH 3 222 CH 3 -Se-Se-S-CH 3 Figure 9: Mass spectrum of dimethyl diselenenyl sulfide at 10. 38 min.
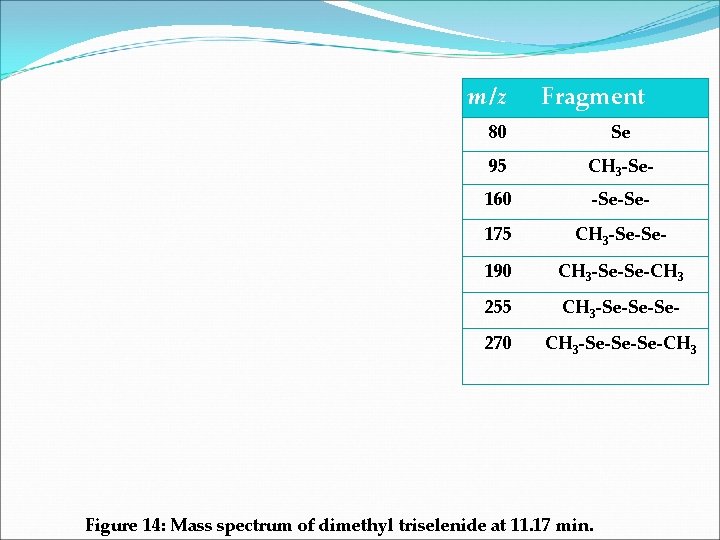
m/z Fragment 80 Se 95 CH 3 -Se- 160 -Se-Se- 175 CH 3 -Se-Se- 190 CH 3 -Se-Se-CH 3 255 CH 3 -Se-Se-Se- 270 CH 3 -Se-Se-Se-CH 3 Figure 14: Mass spectrum of dimethyl triselenide at 11. 17 min.
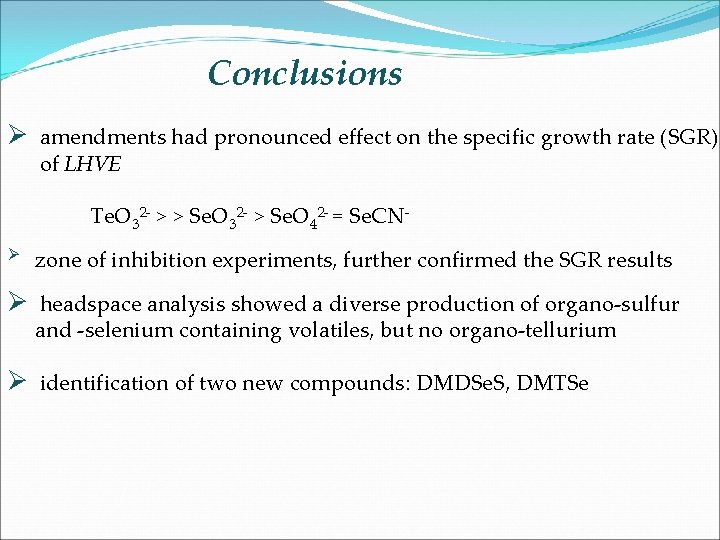
Conclusions Ø amendments had pronounced effect on the specific growth rate (SGR) of LHVE Te. O 32 - > > Se. O 32 - > Se. O 42 - = Se. CN- Ø zone of inhibition experiments, further confirmed the SGR results Ø headspace analysis showed a diverse production of organo-sulfur and -selenium containing volatiles, but no organo-tellurium Ø identification of two new compounds: DMDSe. S, DMTSe
Acknowledgements • Department of Chemistry, Sam Houston State University • Ms. Rachelle Smith, Analytical Laboratory Manager, TRIES Lab • Funding from Robert A. Welch Foundation • Rekha Raghavendra, for guiding in toxicity experiments • Dr. Stacey Edmonson, UWGRE

Thank You…

Questions? ?
- Slides: 31