Bioinformatics 91 07 Nucleic Acid Secondarily Structure AND

Bioinformatics 91 -07 Nucleic Acid Secondarily Structure AND Primer Selection

http: //gcg. nhri. org. tw: 8003/gcg-bin/seqweb. cgi

Nucleic Acid Secondary Structure Stemloop and Mfold In Nucleic acids, inverted repeat sequences may indicate foldback (self pairing)structures. Identifying Inverted Repeats Calculating RNA Folding Stemloop Mfold Displaying of Folding Structures Plotfold/Dotplot
 within a sequence. You specify the minimum")
STEMLOOP Stem. Loop finds stems (inverted repeats) within a sequence. You specify the minimum stem length (number of nucleotides in a paired stretch), minimum and maximum loop sizes, and the minimum number of bonds per stem (length of nucleotide sequence between the paired regions). Vertical bars ('|') indicating the base pairs. The associated loop is shown to the right of the stem. If either the stem or loop is too long to be displayed in its entirety on the line, then only that part that fits on the line is shown. The first and last coordinates of the stem are displayed on the left, and the length of the stem (size), the number of bonds in the stem (quality), and the loop size are shown on the right. start end size 217 AGGCTGCAGTG AGCCGTGAT 11, 25 |||||| C quality 257 TCCGGCCTCAC GTCACCGCG stem

Stem. Loop searches for inverted repeats in your sequence after you choose a minimum stem length and minimum and maximum loop sizes. You must also specify a minimum number of bonds per stem with G-T, A-T/U, and G-C scored as 1, 2, and 3 bonds, respectively. The stems found can be sorted by position, size (stem length), or quality (number of bonds) and can be either filed or displayed on the screen. Stem. Loop tells you the number of stems found for your settings of minimum stem size, maximum loop size, minimum loop size, and minimum bonds per stem. If you feel there are too many stems, you may reset the parameters without reviewing the stems found or view only the best stems found. To view only the best stems, there must be more than 25 stems found and you must sort them by quality or size.
 sets the minimum stem length.")
PARAMETER REFERENCE – STEM LOOP Minimum stem length (window) sets the minimum stem length. This value cannot exceed either 50 or half the sequence length. Minimum bonds per stem (stringency) sets the minimum bonds per stem. Minimum loop size sets the minimum loop size. Maximum loop size (distance to furthest inverted repeat) sets the maximum loop size (distance to furthest inverted repeat). Sort stems by: position quality size indicates how to sort the stems in the output. Number of stems to show sets the maximum number of stems to show (only applies when stems are sorted by quality or size). Threshold for nibbling, match (|), and point display The output from this program has a '|' (vertical bar) between sequence symbols that match. This match display character is added to the output whenever the symbol comparison value for the two symbols in your scoring matrix is greater than or equal to the average positive non-identical comparison value in the
 indicating the base pairs. The associated loop")
STEM LOOP output file Vertical bars ('|') indicating the base pairs. The associated loop is shown to the right of the stem. The first and last coordinates of the stem are displayed on the left. The length of the stem (size), the number of bonds in the stem (quality), and the loop size are shown on the right. Loop 1 2 3 4 5 6 7 8 217 AGGCTGCAGTG |||||| 257 TCCGGCCTCAC AGCCGTGAT 135 TAGCCGGGCGT ||| || |||| 160 GTCCGCG GG 11, 22 GT 4 Start 217 135 139 69 4 213 221 35 End 257 160 95 25 247 248 54 GTCACCGCG C Size 11 11 8 7 9 8 7 8 11, 25 19 Quality 25 22 20 20 20 19 18 18
 See the stems 2) See the stem coordinates 3) File")
STEMLOOP Output formats 1) See the stems 2) See the stem coordinates 3) File the stems (*. fld) 4) File the stems as points for DOTPLOT 5) Choose new parameters 6) Get a different sequence Sort stems by: 1) Position 2) Quality 3) Size 221 TGCAGTG AGCCGTG 7, 18 ||||||| 248 ACGTCAC CGCGCTA 14 Loop Start End Size Quality 1 35 54 8 18 *. stem *. pnt DOTPLOT

MFOLD Using energy minimization criteria, any predicted "optimal" secondary structure for an RNA or DNA molecule depends on the model of folding and the specific folding energies used to calculate that structure. Different optimal foldings may be calculated if the folding energies are changed even slightly. Because of uncertainties in the folding model and the folding energies, the "correct" folding may not be the "optimal" folding determined by the program. You may therefore want to view many optimal and suboptimal structures within a few percent of the minimum energy. You can use the variation among these structures to determine which regions of the secondary structure you can predict reliably. For instance, a region of the RNA molecule containing the same helix in most calculated optimal and suboptimal secondary structures may be more reliably predicted than other regions with greater variation. Mfold output file: *. mfold
 sub-optimal")
MFOLD How to read *. mfold? Survey of optimal and suboptimal foldings A) sub-optimal energy plot B) p-num plot Sampling of optimal and suboptimal foldings C) circles D) domes E) mountains F) squiggles PLOTFOLD
 sub-optimal energy plot The energy dotplot indicates all of the base pairs")
PLOTFOLD A) sub-optimal energy plot The energy dotplot indicates all of the base pairs involved in all optimal and suboptimal secondary structures within the energy increment you specify. The plot takes the form of a two-dimensional graph where both axes of the graph represent the same RNA sequence. Each point drawn in the graph indicates a base pair between the ribonucleotides whose positions in the sequence are the coordinates of that point on the graph
 p-num plot This plot shows the amount of variability in pairing at")
PLOTFOLD B) p-num plot This plot shows the amount of variability in pairing at each position in the sequence in all predicted foldings within the increment of the optimal folding energy you specify
 circles")
PLOTFOLD plot. C) circles
 domes")
PLOTFOLD D) domes
 mountains The program plots representative secondary structures that satisfy the energy increment")
PLOTFOLD E) mountains The program plots representative secondary structures that satisfy the energy increment and window size criteria you specify.
 squiggles")
PLOTFOLD F) squiggles

Exercise 07 Stem. Loop & Mfold link Open the file “Exercixe 91 -07 -1. doc” and follow the steps. gcg 2 4% fetch gb: d 00063 and gb: j 02061. gb_vi d 00063. gb_pl gcg 2 5% mfold d 00063. gb_pl d 00063. mfold j 02061. gb_vi j 02061. mfold $ Mfold (Linear) MFOLD what sequence ? j 02061. gb_vi Begin (* 1 *) ? End (* 121 *) ? What should I call the energy matrix output file (* j 02061. mfold *) ?

Primer Selection Nucleotide sequences Targets an amplicon length of 75 to 150 bp 50 to 60% GC content Limit secondary structure Limit stretch of G or C’s longer than 3 bases No stable interaction between forward and reverse primers (primer/dimer pairs) Place C’s and G’s on ends of primers, but no more than 2 in the last 5 bases on 3’ end Melting Temperature (Tm) above 50 o. C Verify specificity Specificity - %GC Dimer – Hairpin - Tm Amino Acid sequences Pileup Prettybox CONSENSUS Nucleotide Amino Acid backtranslate Primer Selection Program-Prime Confirm by BLAST

http: //gcg. nhri. org. tw: 8003/gcg-bin/seqweb. cgi
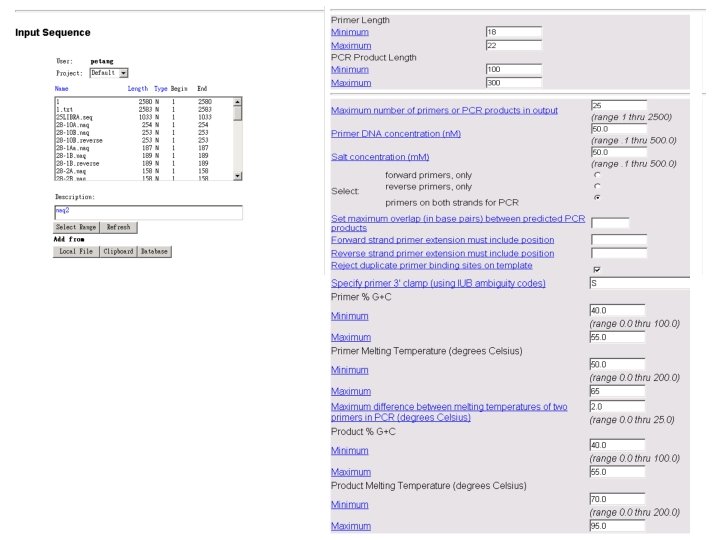

Primer Length Minimum Maximum - -----------------------PCR Product Length Minimum Maximum - ----------------------- Maximum number of primers or PCR products in output (range 1 thru 2500) Primer DNA concentration (n. M) (range. 1 thru 500. 0) Salt concentration (m. M) (range. 1 thru 500. 0) - -----------------------Select: forward primers, only reverse primers, only primers on both strands for PCR Set maximum overlap (in base pairs) between predicted PCR products Forward strand primer extension must include position Reverse strand primer extension must include position ----------------------- Reject duplicate primer binding sites on template Specify primer 3' clamp (using IUB ambiguity codes) -----------------------Primer % G+C Minimum (range 0. 0 thru 100. 0) Maximum -----------------------Primer Melting Temperature (degrees Celsius) Minimum (range 0. 0 thru 200. 0) Maximum -----------------------Maximum difference between melting temperatures of two primers in PCR (degrees Celsius) (range 0. 0 thru 25. 0) -----------------------Product % G+C Minimum (range 0. 0 thru 100. 0) Maximum -----------------------Product Melting Temperature (degrees Celsius) Minimum (range 0. 0 thru 200. 0) Maximum

Useful bookmarks for probe and primer design: http: //www. operon. com/oligos/toolkit. php Use free online Tm calculators to see what the Tm for primer and probe sequences are. We use the Operon calculator, as it also has a good tool to check possible primer-dimerization sequences. Reach it from www. operon. com then select DNA Synthesis, then select Oligo Toolkit. http: //www-genome. wi. mit. edu/cgi-bin/primer 3_www. cgi This is a link to Primer 3 software. It is software that allows for primer design and also helps picking an internal oligo sequence to these primers (a probe sequence). Like most primer design algorithms, it has the disadvantage of not taking into account secondary structure issues that are paramount in primer/probe design for real-time PCR. With that caveat in mind, it is a good place to start the design process, if you are not inclined to do it by eye (i. e. scanning the sequence yourself). Then you can check your sequences at the folding site (described below). http: //www. ncbi. nlm. nih. gov/BLAST/ This is the site for the Basic Local Alignment Search Tool from the National Center for Biotechnology Information. Use this site for checking specificity of probe and primer sequences.

RNA folding programs on the Web mfold version 3. 0 by Zuker and Turner at Washington Univ. of St. Louis http: //mfold 2. wustl. edu/~mfold/rna/form 1. cgi SStruct. View: RNA Secondary Structure Java Applet that visualizes RNA structures as calculated by mfold http: //smi-web. stanford. edu/projects/helix/pubs/gene-combis 96/eg-rnafold. html RNA secondary structure prediction with Gen. Bee at the Belozersky Institute, Moscow State University, Russia http: //www. genebee. msu. su/services/rna 2_reduced. html Protein Hydrophobicity Server: Bioinformatics Unit, Weizmann Institute of Science , Israel http: //bioinformatics. weizmann. ac. il/hydroph/ SAPS - statistical analysis of protein sequences http: //www. isrec. isb-sib. ch/software/SAPS_form. html

Exercise 07 -4 Primer Selection Use the human npm c. DNA sequence to design a pair of primers that will copy the whole coding sequence when translated in frame. THEN Check the specificity of the primers by using BLAST.
- Slides: 24