Biogeography of Cloud Forests Use of satellite data

Biogeography of Cloud Forests: Use of satellite data and numerical modeling Udaysankar S. Nair 1, Robert O. Lawton 2, Ron Welch 3, Qingyuan Han 3, Jian Zeng 3, Deepak Ray 3, Salvi Asefi 3 1 Earth System Science Center, University of Alabama in Huntsville 2 Department of Biological Science, University of Alabama in Huntsville 3 Department of Atmospheric Science, University of Alabama in Huntsville

Tropical montane cloud forests • Predictable, frequent and prolonged immersion in orographic clouds. • Altitude range 1500 -3500 m, coastal areas descends to 1000 -300 m
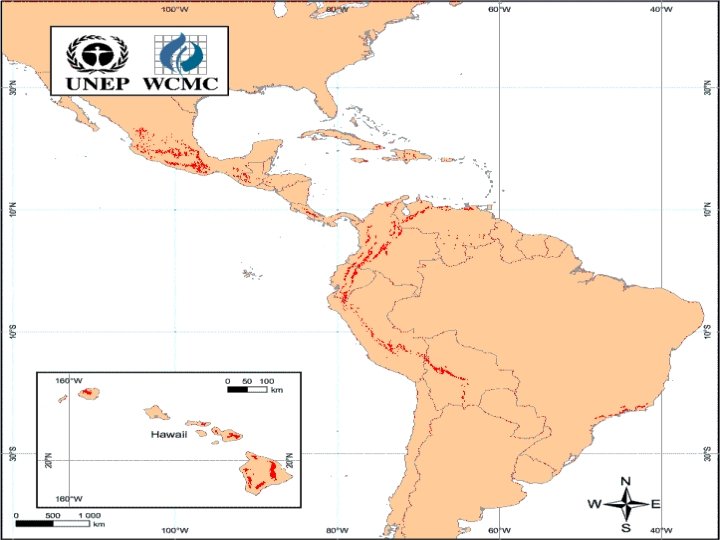

Cloud forest locations Hamilton et. al. , 1996

Ecological importance of TMCF Myers et. al. , 2000 • TMCFs are located within biological hotspots that support about 20% and 16% of plants and vertebrates • Retains less than 25% of their original primary vegetation cover

Hydrological importance • Direct interception of liquid water from orographic clouds by vegetation • “Horizontal precipitation” can account for up to 14 – 18 % and 15% - 100% of total precipitation during wet and dry season respectively

Hydrological importance Rain: 4310 mm 1500 m Rain: 4590 mm Horizontal: 240 mm 1320 m 1200 m Horizontal: 3560 mm 3600 3100 Rain: 6390 mm 2600 Horizontal: 350 mm 2100 1600 1100 600 Caribbean 100 0

Hydrological importance • Mosses and ferns acts as capacitors, modulating runoff

Why map TMCFs? • TMCFs are fragile ecological hotspots that require specialized conservation management • TMCFs are water resources with potential to affect agriculture, water distribution and power generation • Characterization of TMCFs are essential for understanding ecology • Upscaling of cloud forest hydrology and ecology

Current state of cloud forest mapping • “Version 1”, International TMCF Symposium, 1990, TMCF researchers pointing out locations on a map.

Current state of cloud forest mapping • “Version 2”, Cloud Forest Agenda, based on DEM and “expert testimony” • Review of literature • Information on particular study sites dictated the mapping at the regional scale • EW volcanic chain in Mexico, has pine oak forest in the west, misclassified as cloud forest

Current state of cloud forest mapping 10 30 50 70 90

“Version 3” Mapping of cloud forests using remotely sensed data • Satellite used to quantify frequency of cloud immersion • Detect cloud using automated cloud masking algorithms • Estimate cloud base height from remotely sensed cloud top pressure, liquid water path

Estimation of cloud base height from satellite imagery r u s s e r p p o t d Clou As sum e h t p us e d l radi a c ti ive p O ect Eff Te mp pro era file tur e Cl ou d t op he ig ht MODIS ptio ns Cloud Thickness

Study Area and Data Sources • March 2003, Study region centered in Monteverde, Costa Rica. • MODIS Terra data: Cloud optical properties retrieved from level-1 B, Level-2 cloud top pressure, and atmospheric thermodynamic profiles
: Dual mobile")
Study Area and Data Sources • Land Use Cloud Interaction Experiment (LUCIE): Dual mobile radiosondes launched every 3 hours during the day and photographs taken at 6: 00 am and 12: 00 pm local time

Study Area and Data Sources • Photographic observations of cloud base height

Goals for the first year • Validate cloud base height estimation algorithms - How often can this technique be used - Check validity of different assumptions - Determine sources of errors - Compare against ground based observations • Explore other techniques for estimating cloud base height - Use Lifting Condensation Level (LCL) from global and regional models as a surrogate for cloud base height?

How often can cloud base be estimated?

Is the effective radius constant? Edge Interior

Is the constant liquid water content assumption valid?

Cloud top height determined using MODIS profile

Comparison of MODIS pressure level heights against LUCIE observations

Comparison of MODIS thermodynamic profiles against LUCIE observations

Cloud base determined using MODIS profile, compared to photo observations

Comparison of cloud base heights, estimated using temperature profile from the MODIS and RAMS model

Cloud base height estimates from other sources?

Combination of satellite and model?

Conclusions • During dry season cloud base height may be estimated using MODIS data more that 50 % of the time. • Constant effective radius assumption may be valid for orographic clouds • Use of MODIS temperature profiles for estimating cloud top height result in significant errors. • Remedied using temperature profiles from numerical models • With corrections, RMS errors of 200 -300 m is encountered in cloud base height estimations.

Conclusions • Combining frequency of occurrence of clouds derived from satellite data with cloud base height information from numerical models appears to be the most promising approach

Future work • Further validation! • Create detailed TMCF maps for two regions, Costa Rica and Hawaii, using different techniques • Evaluation of the product by regional experts
- Slides: 31