
Biodiversity Accounting Levels 0 1 and 2 http
Biodiversity Accounting (Levels 0, 1 and 2) http: //www. unescap. org/our-work/statistics
Structure: Biodiversity Accounting 1. Learning objectives 2. Level 0 – Overview (10 m) • Summary • Links to related training materials 3. Level 1 (Compilers) • Concepts • Group exercise and discussion (30 m) 4. Level 2 (Data providers) • Data options, examples & issues (15 m) • Group exercise and discussion (15 m) 5. Closing discussion (10 m) 2 SEEA-EEA: Biodiversity accounting http: //www. unescap. org/our-work/statistics
SEEA-EEA Training Levels 1 and 2 • Learning objectives • Level 0: • Provide an overview of Biodiversity Accounting • Level 1: • Understand the basic concepts of measuring biodiversity • Learn the steps of compiling a Biodiversity Account • Level 2: • Understand the data options and sources • Understand the important conceptual issues • Be aware of how other countries have approached measuring Biodiversity 3 SEEA-EEA: Biodiversity accounting http: //www. unescap. org/our-work/statistics
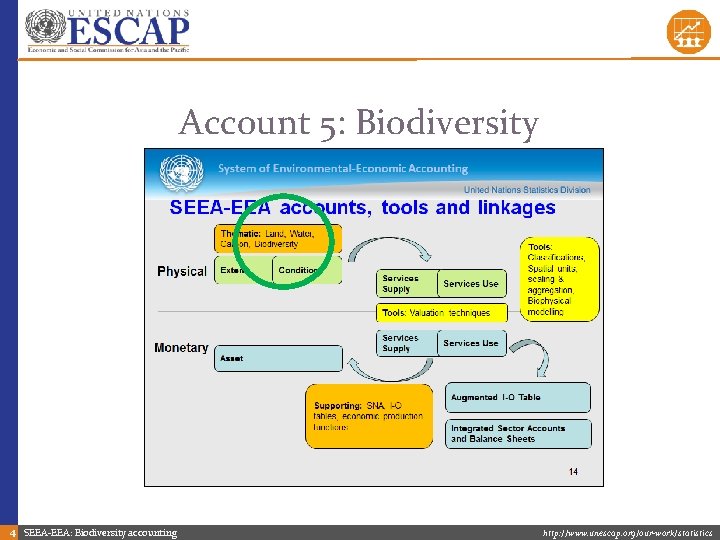
Account 5: Biodiversity 4 SEEA-EEA: Biodiversity accounting http: //www. unescap. org/our-work/statistics
Review of Level 0: Biodiversity Accounting 5 SEEA-EEA: Biodiversity accounting http: //www. unescap. org/our-work/statistics
Level 0: Account 5: Biodiversity • What do Biodiversity Accounts contain? • Biodiversity information linked to areas of ecosystems (from Extent Account) • Spatially detailed information on key species: • • Abundance Richness Conservation status Other characteristics (e. g. , health) • Spatially detailed summary statistics (index) on species diversity (used in Condition Account) 6 SEEA-EEA: Biodiversity accounting http: //www. unescap. org/our-work/statistics
Level 0: Account 5: Biodiversity • Why would you create Biodiversity Accounts? • To compare trends in biodiversity with economic and social activity in a spatially explicit manner • To link biodiversity information with other SEEA accounts (Condition, Services Supply) • To meet global commitments under the Convention on Biological Diversity’s Strategic Plan for Biodiversity (2011 -2020) • To support sustainable development 7 SEEA-EEA: Biodiversity accounting http: //www. unescap. org/our-work/statistics
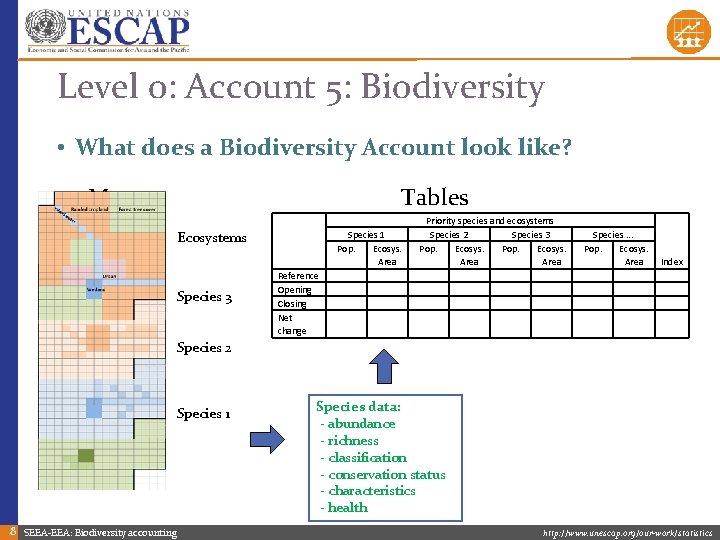
Level 0: Account 5: Biodiversity • What does a Biodiversity Account look like? Maps Tables Ecosystems Species 3 Species 1 Pop. Ecosys. Area Priority species and ecosystems Species 2 Species 3 Pop. Ecosys. Area Species. . . Pop. Ecosys. Area Index Reference Opening Closing Net change Species 2 Species 1 8 SEEA-EEA: Biodiversity accounting Species data: - abundance - richness - classification - conservation status - characteristics - health http: //www. unescap. org/our-work/statistics
Level 0: Account 5: Biodiversity • What do you need to produce a Biodiversity Account? • The key policy questions & goal of the Biodiversity Account • List of key or priority species • List of data sources (e. g. , national, global) supported by a dialogue with data providers to ascertain data availability. • Expertise to mobilise data and plug data gaps: • • Species measurement Biophysical modelling, GIS Indicator development Statistical analysis 9 SEEA-EEA: Biodiversity accounting http: //www. unescap. org/our-work/statistics
Level 0: Account 5: Biodiversity • What do you need to produce a Biodiversity Account? • Information on key or priority species • • Species classifications (family, genus) Species measures (ranges, richness, population counts over time) Characteristics (e. g. , habitat, specialist/generalist, health) Conservation status • Extent Account or some form of spatial infrastructure for ecosystems (Spatial units) 10 SEEA-EEA: Biodiversity accounting http: //www. unescap. org/our-work/statistics
Level 1: Biodiversity Accounting 11 SEEA-EEA: Biodiversity accounting http: //www. unescap. org/our-work/statistics
Level 1: Account 5: Biodiversity • Learning objectives • Level 1: • Understand the basic concepts of measuring biodiversity • Understand the steps of compiling a Biodiversity Account 12 SEEA-EEA: Biodiversity accounting http: //www. unescap. org/our-work/statistics
Level 1: Account 5: Biodiversity • Biodiversity in the SEEA-EEA “Biological diversity means the variability among living organisms from all sources including, inter alia, terrestrial, marine and other aquatic ecosystems and the ecological complexes of which they are part; this includes diversity within species, between species and of ecosystems” (CBD, 1992) 13 SEEA-EEA: Biodiversity accounting http: //www. unescap. org/our-work/statistics
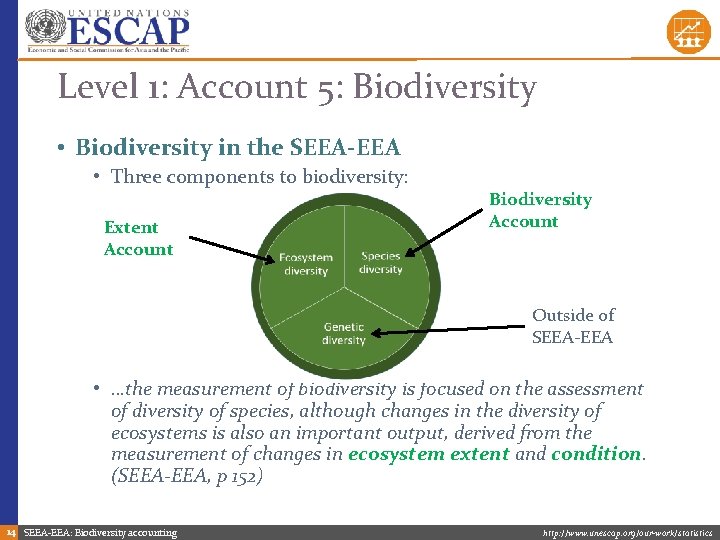
Level 1: Account 5: Biodiversity • Biodiversity in the SEEA-EEA • Three components to biodiversity: Extent Account Biodiversity Account Outside of SEEA-EEA • …the measurement of biodiversity is focused on the assessment of diversity of species, although changes in the diversity of ecosystems is also an important output, derived from the measurement of changes in ecosystem extent and condition. (SEEA-EEA, p 152) 14 SEEA-EEA: Biodiversity accounting http: //www. unescap. org/our-work/statistics
Level 1: Account 5: Biodiversity • How do we measure biodiversity for inclusion in ecosystem accounts? • Ecosystem diversity (mainly Extent Account): • Heterogeneity of ecosystems found in an area (e. g. , number and extent of ecosystem types within a landscape) • Species diversity (Biodiversity Account): • Species richness: number of species within a given sample, area or community • Species abundance: total number of individuals of a species in an area, community or population • The dissimilarity between richness and abundance between areas 15 SEEA-EEA: Biodiversity accounting http: //www. unescap. org/our-work/statistics
Level 1: Account 5: Biodiversity • Which measure of species biodiversity to use? • Species abundance is more sensitive than species richness • Use species richness when abundance data is not available • Other useful measures • Species characteristics: health of biodiversity (e. g. , disease prevalence) • Conservation status: extinction risk, a combination of distribution, population trends and threats (*use IUCN’s Red List methodology) 16 SEEA-EEA: Biodiversity accounting http: //www. unescap. org/our-work/statistics
Level 1: Account 5: Biodiversity • How do we select species to prioritise? • species that directly deliver particular ecosystem services (e. g. , pollinators) • economically important species (e. g. , game species related to tourism) • culturally important species (e. g. , sacred plants/animals) • ecologically important species (e. g. , keystone species) • endemic species • threatened species that face risk of extinction in the wild • species selected should represent different taxonomic and trophic groups (e. g. , mammals, birds etc. ) 17 SEEA-EEA: Biodiversity accounting http: //www. unescap. org/our-work/statistics
Level 1: Account 5: Biodiversity • How do we select species to prioritise? • Taxonomic groups: refers to the units of a rank that designates an organism to particular rank based on shared characteristics. 5 ranks: Kingdom, e. g. , animals Phylum, e. g. , vertebrates Class, e. g. , mammals, birds, amphibians. . . Order, e. g. , carnivores Family, e. g. , cats Genus, e. g. , panthers Species, e. g. , lions • Trophic groups: refers to the level an organism occupies in a food chain: Producers, i. e. , plants Consumers, i. e. , animals that eat plants (herbivores) or other animals (carnivores) Decomposers, i. e. , organisms that break down dead plants and animals 18 SEEA-EEA: Biodiversity accounting http: //www. unescap. org/our-work/statistics
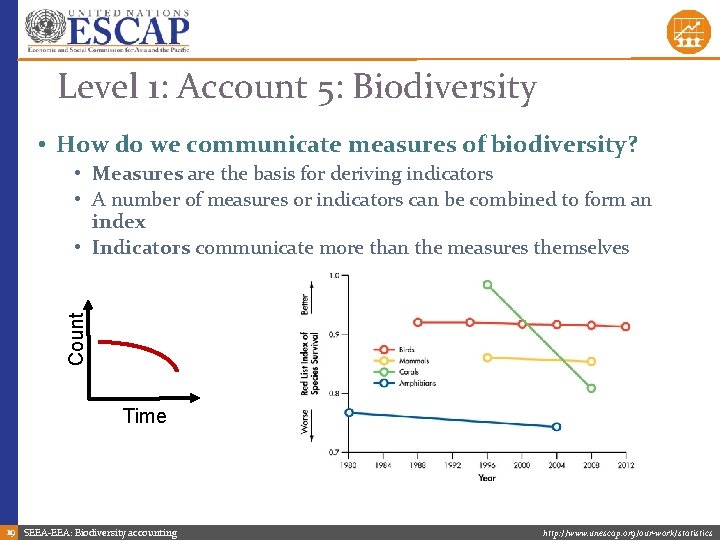
Level 1: Account 5: Biodiversity • How do we communicate measures of biodiversity? Count • Measures are the basis for deriving indicators • A number of measures or indicators can be combined to form an index • Indicators communicate more than the measures themselves Time 19 SEEA-EEA: Biodiversity accounting http: //www. unescap. org/our-work/statistics
Level 1: Account 5: Biodiversity • How do we use data and information in Biodiversity Accounts? • Measures • Main data in the biodiversity account • Opening and closing measures of species richness, abundance or other information for priority species • May be supplemented with information on the sources of additions (e. g. , births) and reductions (e. g. , migrations or deaths) • Indicators • Output indicators captured from Biodiversity Accounts can link information on biodiversity to the ecosystem condition account (or progress to policy goals). • Constructing an index from relevant information in the biodiversity account can generate a biodiversity output indicator for the Ecosystem Condition Account. 20 SEEA-EEA: Biodiversity accounting http: //www. unescap. org/our-work/statistics
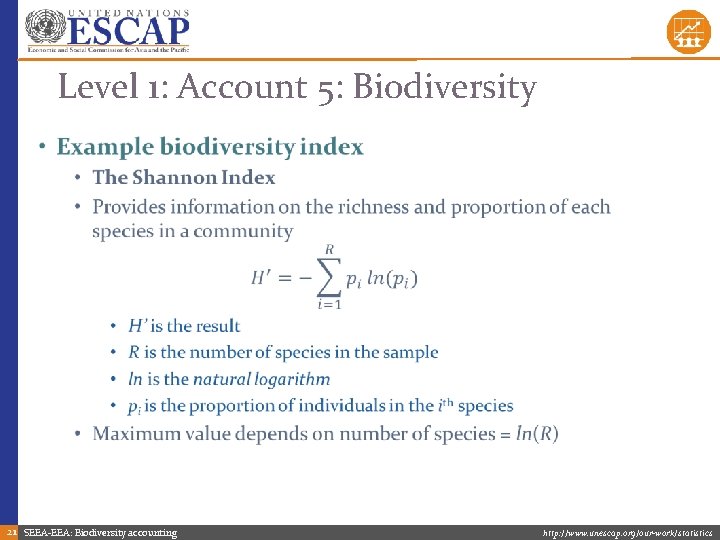
Level 1: Account 5: Biodiversity • 21 SEEA-EEA: Biodiversity accounting http: //www. unescap. org/our-work/statistics
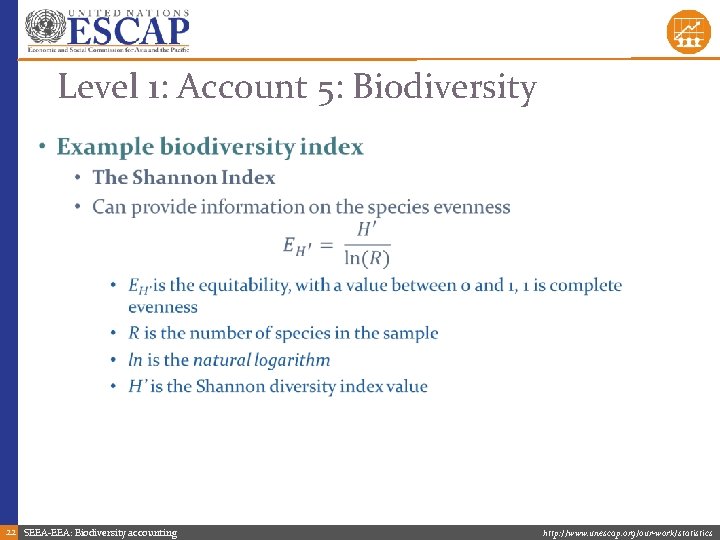
Level 1: Account 5: Biodiversity • 22 SEEA-EEA: Biodiversity accounting http: //www. unescap. org/our-work/statistics
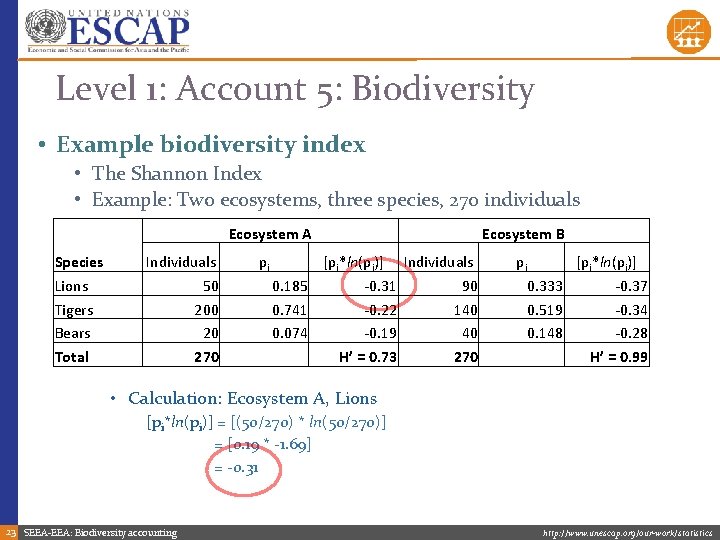
Level 1: Account 5: Biodiversity • Example biodiversity index • The Shannon Index • Example: Two ecosystems, three species, 270 individuals Ecosystem A Species Lions Tigers Bears Total Individuals 50 20 270 pi [pi*ln(pi)] Individuals 0. 185 -0. 31 90 0. 741 -0. 22 140 0. 074 -0. 19 40 H’ = 0. 73 270 Ecosystem B pi [pi*ln(pi)] 0. 333 -0. 37 0. 519 -0. 34 0. 148 -0. 28 H’ = 0. 99 • Calculation: Ecosystem A, Lions [pi*ln(pi)] = [(50/270) * ln(50/270)] = [0. 19 * -1. 69] = -0. 31 23 SEEA-EEA: Biodiversity accounting http: //www. unescap. org/our-work/statistics
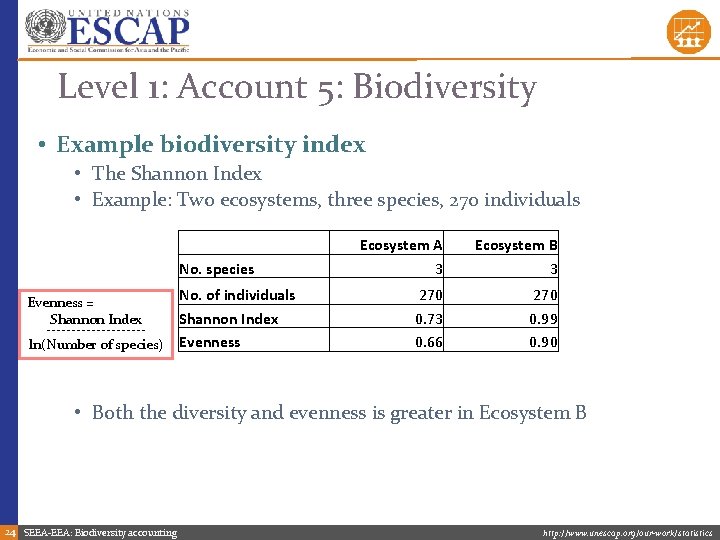
Level 1: Account 5: Biodiversity • Example biodiversity index • The Shannon Index • Example: Two ecosystems, three species, 270 individuals No. species No. of individuals Evenness = Shannon Index ----------ln(Number of species) Evenness Ecosystem A 3 Ecosystem B 3 270 0. 73 0. 66 270 0. 99 0. 90 • Both the diversity and evenness is greater in Ecosystem B 24 SEEA-EEA: Biodiversity accounting http: //www. unescap. org/our-work/statistics
Level 1: Account 5: Biodiversity • Compilation Group Exercise (30 m) • Situation: • EUs defined in Spatial Units • Have population counts for three key species • Need to calculate Shannon Index for three Forest EUs • Objective (Groups of 3 -5): 1. 2. 3. 4. Decide which three species you will prioritise and why Record species population data in appropriate cells in Species Table for each Forested EU Using formulas provided, calculate a Shannon index and the species evenness for each forested EU Record this in the Summary Table 25 SEEA-EEA: Biodiversity accounting http: //www. unescap. org/our-work/statistics
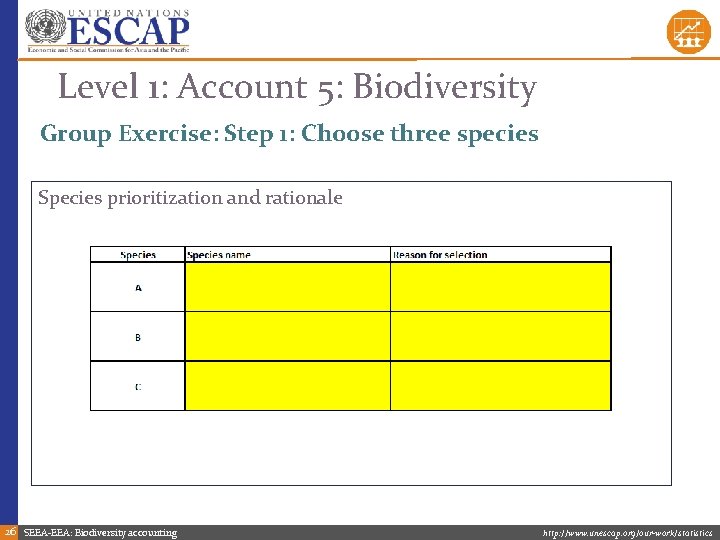
Level 1: Account 5: Biodiversity Group Exercise: Step 1: Choose three species Species prioritization and rationale 26 SEEA-EEA: Biodiversity accounting http: //www. unescap. org/our-work/statistics
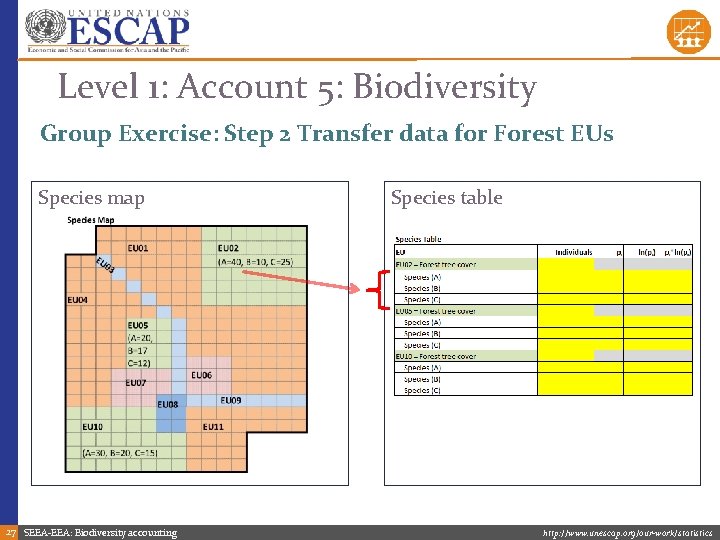
Level 1: Account 5: Biodiversity Group Exercise: Step 2 Transfer data for Forest EUs Species map 27 SEEA-EEA: Biodiversity accounting Species table http: //www. unescap. org/our-work/statistics
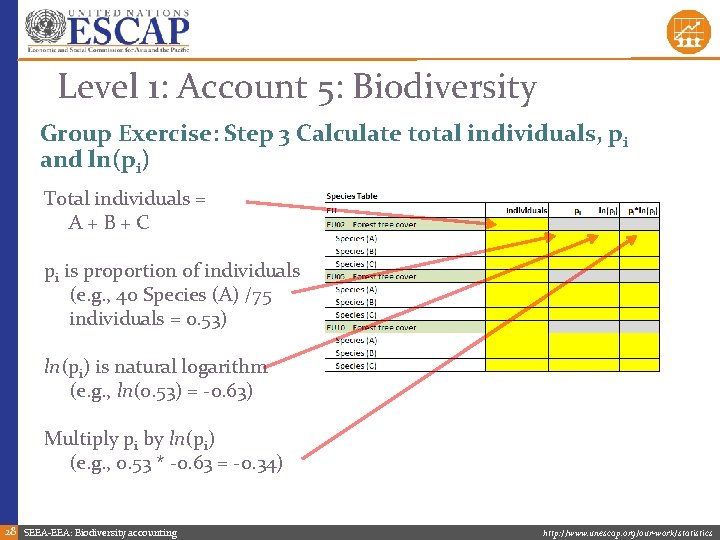
Level 1: Account 5: Biodiversity Group Exercise: Step 3 Calculate total individuals, pi and ln(pi) Total individuals = A + B + C pi is proportion of individuals (e. g. , 40 Species (A) /75 individuals = 0. 53) ln(pi) is natural logarithm (e. g. , ln(0. 53) = -0. 63) Multiply pi by ln(pi) (e. g. , 0. 53 * -0. 63 = -0. 34) 28 SEEA-EEA: Biodiversity accounting http: //www. unescap. org/our-work/statistics
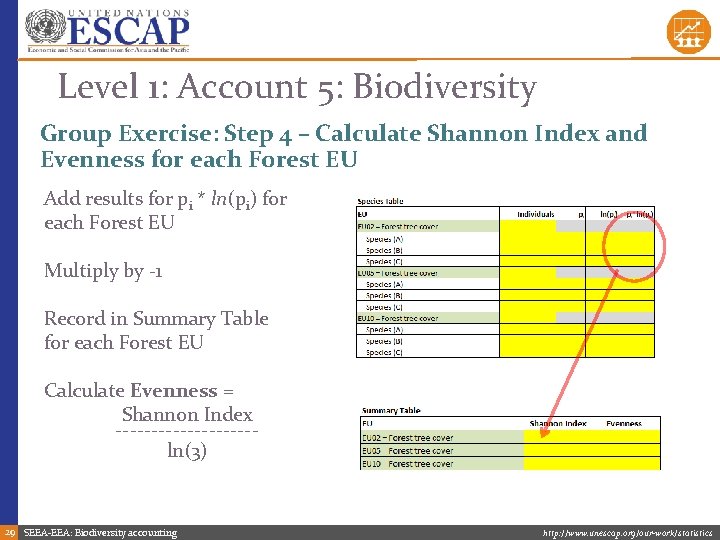
Level 1: Account 5: Biodiversity Group Exercise: Step 4 – Calculate Shannon Index and Evenness for each Forest EU Add results for pi * ln(pi) for each Forest EU Multiply by -1 Record in Summary Table for each Forest EU Calculate Evenness = Shannon Index ----------ln(3) 29 SEEA-EEA: Biodiversity accounting http: //www. unescap. org/our-work/statistics
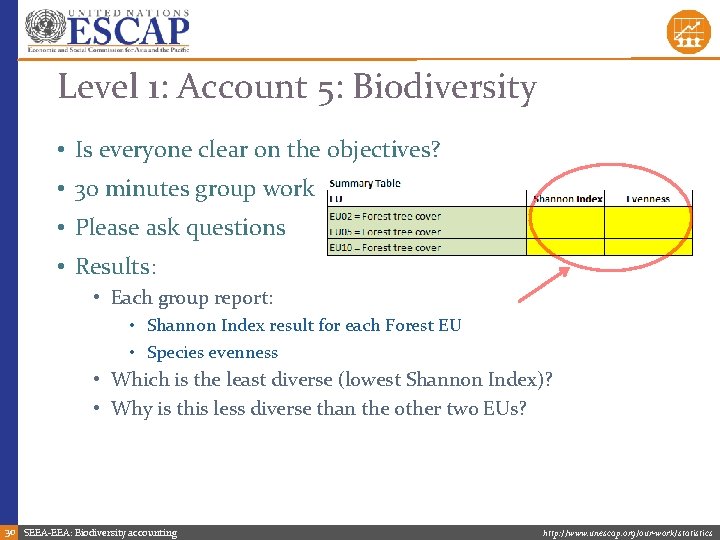
Level 1: Account 5: Biodiversity • Is everyone clear on the objectives? • 30 minutes group work • Please ask questions • Results: • Each group report: • Shannon Index result for each Forest EU • Species evenness • Which is the least diverse (lowest Shannon Index)? • Why is this less diverse than the other two EUs? 30 SEEA-EEA: Biodiversity accounting http: //www. unescap. org/our-work/statistics
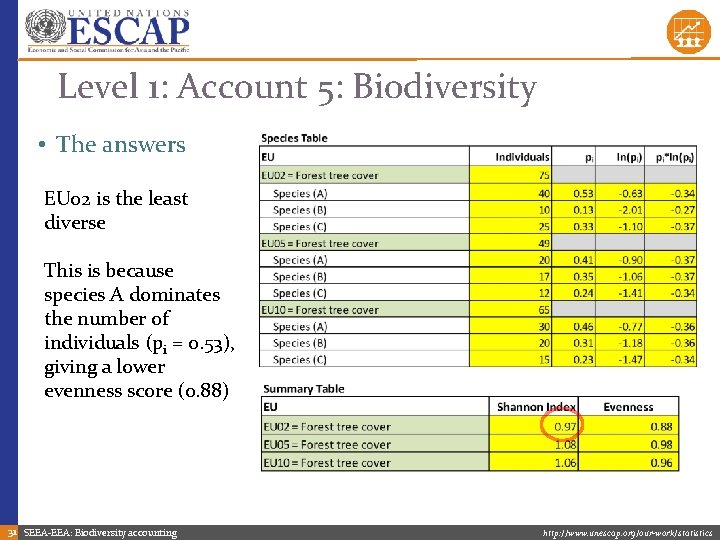
Level 1: Account 5: Biodiversity • The answers EU 02 is the least diverse This is because species A dominates the number of individuals (pi = 0. 53), giving a lower evenness score (0. 88) 31 SEEA-EEA: Biodiversity accounting http: //www. unescap. org/our-work/statistics
Level 2: Biodiversity Accounting 32 SEEA-EEA: Biodiversity accounting http: //www. unescap. org/our-work/statistics
Level 2: Account 5: Biodiversity • Learning objectives • • Understand information uses Understand the data options and sources Understand the important conceptual issues Be aware of how other countries have approached measuring Biodiversity 33 SEEA-EEA: Biodiversity accounting http: //www. unescap. org/our-work/statistics
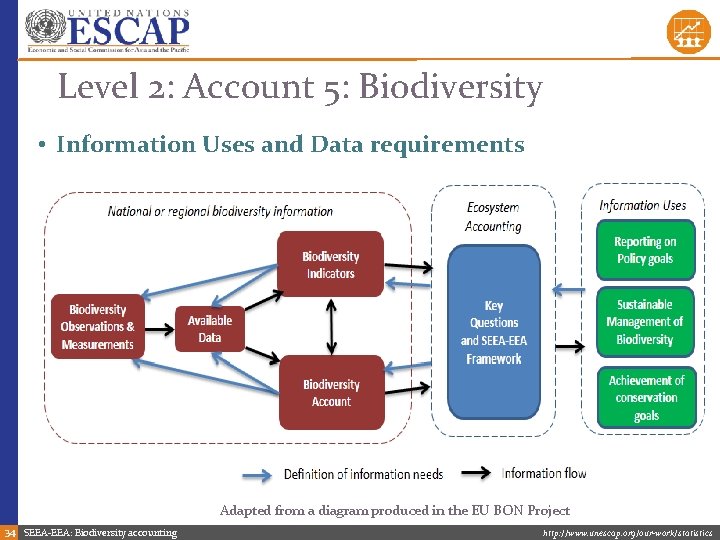
Level 2: Account 5: Biodiversity • Information Uses and Data requirements Adapted from a diagram produced in the EU BON Project 34 SEEA-EEA: Biodiversity accounting http: //www. unescap. org/our-work/statistics
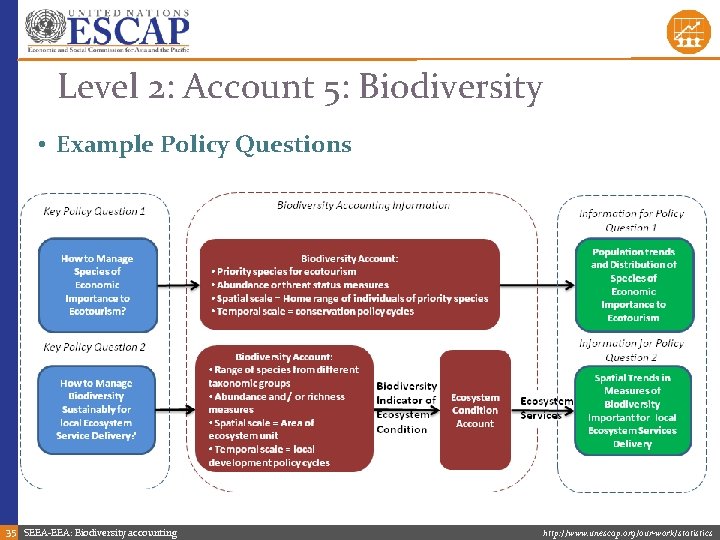
Level 2: Account 5: Biodiversity • Example Policy Questions 35 SEEA-EEA: Biodiversity accounting http: //www. unescap. org/our-work/statistics
Level 2: Account 5: Biodiversity • Data options and sources • Conduct an inventory of existing species diversity information, including: • • National and sub-national monitoring schemes National Red List Governmental Agencies, NGOs, universities and museums Reporting to regional processes and international conventions • Ecosystem diversity • Some information captured by Extent Account • Land cover, vegetation maps (spatially-detailed) • River system maps (e. g. , linearly delineated by Strahler stream order) • Marine habitat maps (spatially delineated on basis of Bathymetry and others characteristics) 36 SEEA-EEA: Biodiversity accounting http: //www. unescap. org/our-work/statistics
Level 2: Account 5: Biodiversity • Format of Biodiversity Data in Biodiversity Accounts • Measures • This includes raw, on the ground data (e. g. , species abundance or richness for different taxonomic groups). • Relative Measures • This compares the measure to a reference condition. • Normalized around 1 or 100 • Sources: minimal human disturbance (SEEA), ecological sustainability (NNI), first accounting period (accrual, Living Planet Index) or aspirational. • Headline output indicator(s) • Index of all relevant biodiversity data in account • May need more than one (e. g. , one for ecosystem condition, one conservation goals) • Will need expert ecological knowledge 37 SEEA-EEA: Biodiversity accounting http: //www. unescap. org/our-work/statistics
Level 2: Account 5: Biodiversity • Plugging Species Diversity Data Gaps • Develop national species monitoring programme • Estimation approaches • • • Human drivers based models (e. g. , Alkemade, 2009) Statistical habitat suitability models (Phillips, 2006) Expert judgement (e. g. , BII - Scholes and Biggs, 2005) Species-area curve (Brooks et al. , 2002). Issues: Species may not exist in areas of suitable habitat. Solutions: Validation and calibration of species diversity measures using targeted monitoring programmes • Qualitative Approaches • For example ‘very abundant’, ‘common’, ‘rare’ and ‘very rare’ as broad classes for species abundance. 38 SEEA-EEA: Biodiversity accounting http: //www. unescap. org/our-work/statistics
Level 2: Account 5: Biodiversity • Conceptual issues • Data on species ranges, characteristics often incomplete • Migration and Mobility: e. g. , birds are often recorded where they breed and bears can range over many habitat types • Functional diversity: some species are more important to the functioning of the ecosystem; some overlap in function • Conservation priority species may not be of high importance for ecosystem condition • May need more than one account to answer different policy questions • Invasive species (more information required) • Reference conditions (more information required) • May need more than one indicator to track policy progress and report ecosystem condition • How to aggregate biodiversity measures across ecosystems? 39 SEEA-EEA: Biodiversity accounting http: //www. unescap. org/our-work/statistics
Level 2: Account 5: Biodiversity • Norway`s Nature Index (Certain and Skarpaas, 2011) records for each species in index (of about 300): • • • • Taxonomic group Red list status Presence in region Specificity to habitat Trophic group (primary producer, herbivore, predator, carnivore) Keystone species Generality (specialist or generalist species) Community (indicator refers to population or community), Sub-habitat (description) Ecosystem service (contributing to) Quick response to environmental change Sensitive to which pressure Migrating Multiple major habitats Reference value (i. e. , value of “reference state” chosen) 40 SEEA-EEA: Biodiversity accounting http: //www. unescap. org/our-work/statistics
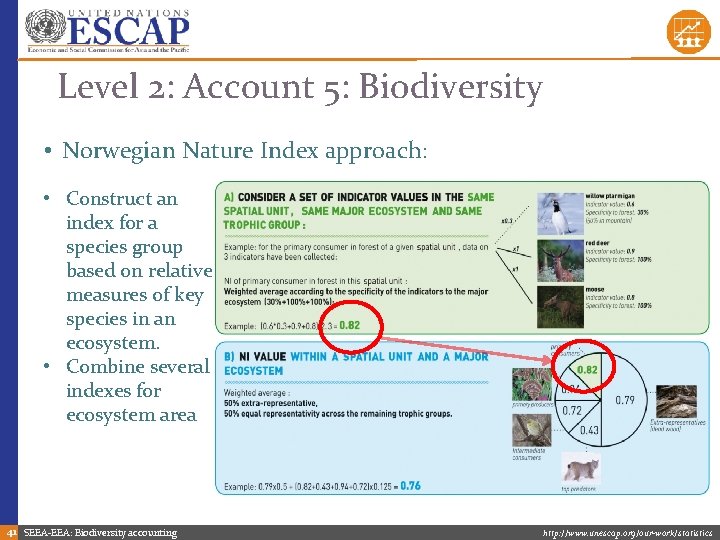
Level 2: Account 5: Biodiversity • Norwegian Nature Index approach: • Construct an index for a species group based on relative measures of key species in an ecosystem. • Combine several indexes for ecosystem area 41 SEEA-EEA: Biodiversity accounting http: //www. unescap. org/our-work/statistics
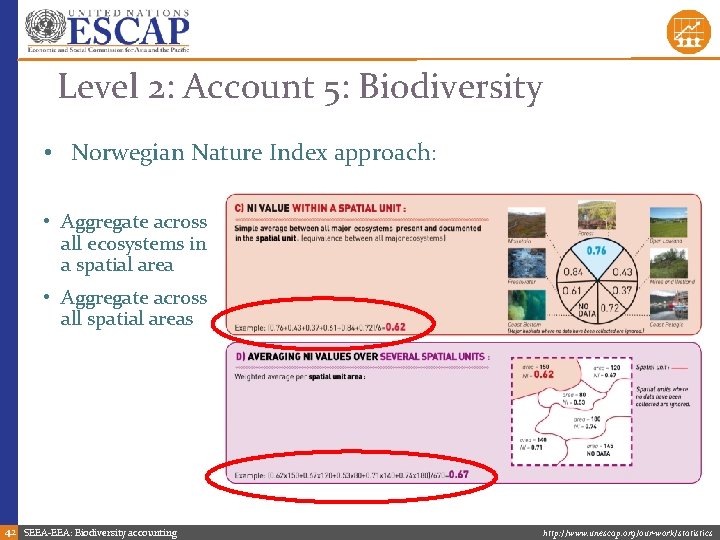
Level 2: Account 5: Biodiversity • Norwegian Nature Index approach: • Aggregate across all ecosystems in a spatial area • Aggregate across all spatial areas 42 SEEA-EEA: Biodiversity accounting http: //www. unescap. org/our-work/statistics
Level 2: Account 5: Biodiversity • IUCN National Red List: • Information relevant to species’ extinction risk is considered from published and grey literature, museum records and specimen databases. Specifically relating to: • • • Species distribution Population trend information Habitat, ecology and life history information Threats to the species Conservation measures currently in place • Supported by national workshops that rely on local species experts to provide validation. • Implemented in many countries: Ecuador, Finland, Norway, Spain, Sri Lanka, Thailand etc. 43 SEEA-EEA: Biodiversity accounting http: //www. unescap. org/our-work/statistics
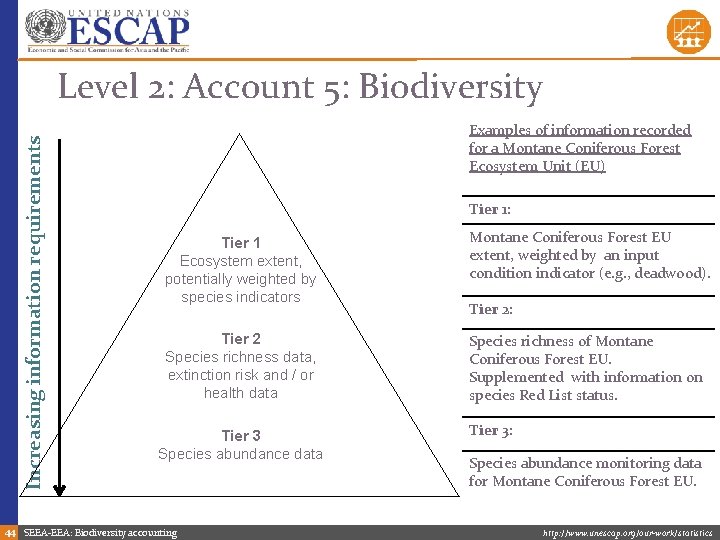
Increasing information requirements Level 2: Account 5: Biodiversity Examples of information recorded for a Montane Coniferous Forest Ecosystem Unit (EU) Tier 1: Tier 1 Ecosystem extent, potentially weighted by species indicators Montane Coniferous Forest EU extent, weighted by an input condition indicator (e. g. , deadwood). Tier 2 Species richness data, extinction risk and / or health data Species richness of Montane Coniferous Forest EU. Supplemented with information on species Red List status. Tier 3 Species abundance data 44 SEEA-EEA: Biodiversity accounting Tier 2: Tier 3: Species abundance monitoring data for Montane Coniferous Forest EU. http: //www. unescap. org/our-work/statistics
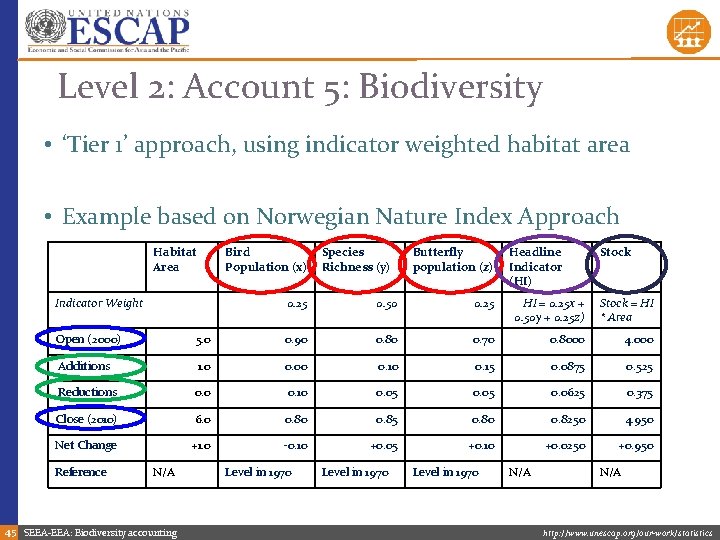
Level 2: Account 5: Biodiversity • ‘Tier 1’ approach, using indicator weighted habitat area • Example based on Norwegian Nature Index Approach Habitat Area Bird Population (x) Indicator Weight Species Richness (y) Butterfly population (z) Headline Indicator (HI) Stock 0. 25 0. 50 0. 25 HI = 0. 25 x + 0. 50 y + 0. 25 z) Stock = HI * Area Open (2000) 5. 0 0. 90 0. 80 0. 70 0. 8000 4. 000 Additions 1. 0 0. 00 0. 15 0. 0875 0. 525 Reductions 0. 0 0. 10 0. 05 0. 0625 0. 375 Close (2010) 6. 0 0. 85 0. 80 0. 8250 4. 950 Net Change +1. 0 -0. 10 +0. 05 +0. 10 +0. 0250 +0. 950 Reference N/A 45 SEEA-EEA: Biodiversity accounting Level in 1970 N/A http: //www. unescap. org/our-work/statistics
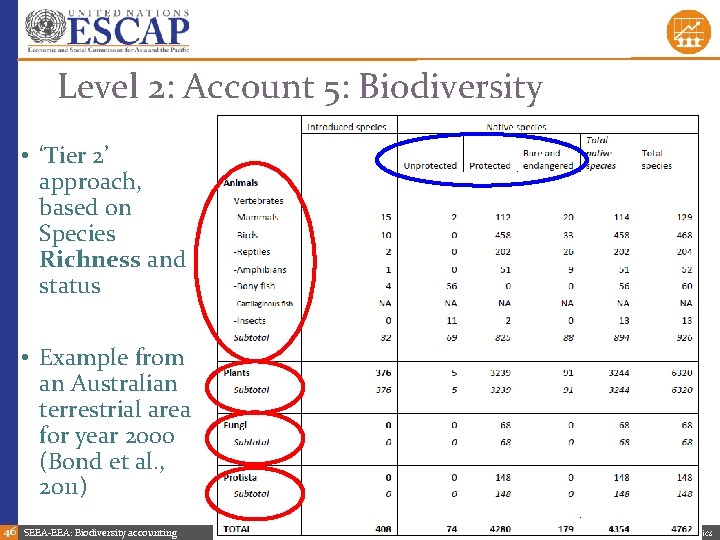
Level 2: Account 5: Biodiversity • ‘Tier 2’ approach, based on Species Richness and status • Example from an Australian terrestrial area for year 2000 (Bond et al. , 2011) 46 SEEA-EEA: Biodiversity accounting http: //www. unescap. org/our-work/statistics
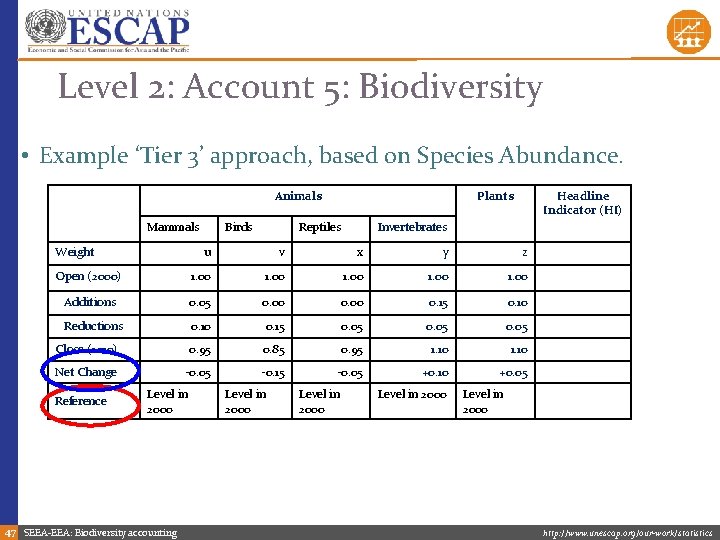
Level 2: Account 5: Biodiversity • Example ‘Tier 3’ approach, based on Species Abundance. Animals Mammals Weight Birds Plants Reptiles Headline Indicator (HI) Invertebrates u v x y z Open (2000) 1. 00 Additions 0. 05 0. 00 0. 15 0. 10 Reductions 0. 10 0. 15 0. 05 Close (2010) 0. 95 0. 85 0. 95 1. 10 Net Change -0. 05 -0. 15 -0. 05 +0. 10 +0. 05 Reference Level in 2000 47 SEEA-EEA: Biodiversity accounting Level in 2000 http: //www. unescap. org/our-work/statistics
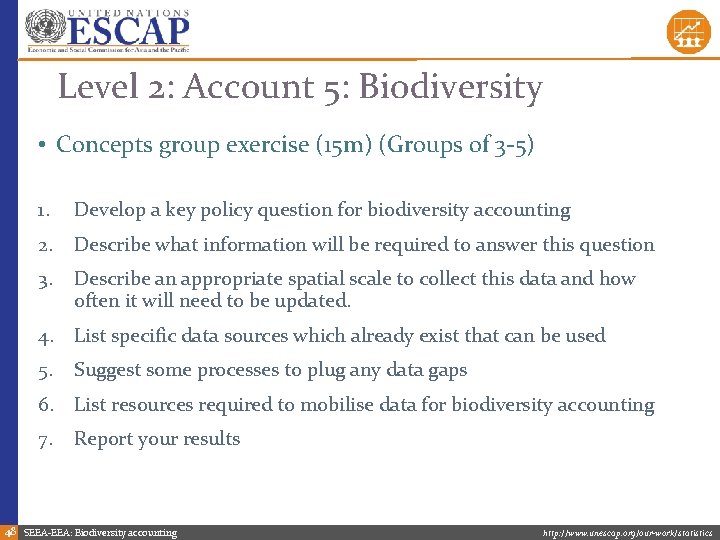
Level 2: Account 5: Biodiversity • Concepts group exercise (15 m) (Groups of 3 -5) 1. Develop a key policy question for biodiversity accounting 2. Describe what information will be required to answer this question 3. Describe an appropriate spatial scale to collect this data and how often it will need to be updated. 4. List specific data sources which already exist that can be used 5. Suggest some processes to plug any data gaps 6. List resources required to mobilise data for biodiversity accounting 7. Report your results 48 SEEA-EEA: Biodiversity accounting http: //www. unescap. org/our-work/statistics
Level 2: Account 5: Biodiversity • Closing Discussion (15 m) • Group reports • • • Key Policy Question Description of Data Required Possible Sources of Data Protocols to Plug Gaps Broad Description of Resources Required • Discussion • Data sources suggested? • Issues with the ways of plugging data gaps suggested? • Anything else important? 49 SEEA-EEA: Biodiversity accounting http: //www. unescap. org/our-work/statistics
Other related training materials • Secretariat for the Convention on Biological Diversity (SCBD) • Quick Start Package (QSP) (Weber, 2014) • Available online at www. ecosystemaccounting. net • Includes free GIS software and tutorials • National Biodiversity Strategies and Action Plans • Training modules at www. cbd. int/nbsap/training/ • World Bank WAVES • SEEA-EEA Technical Guidance (forthcoming) • Detailed supporting document on “Biodiversity and Ecosystem Accounting” by UNEP-WCMC • Statistics Canada: • Measuring Ecosystem Goods and Services Teacher’s Kit 50 SEEA-EEA: Biodiversity accounting http: //www. unescap. org/our-work/statistics
References • Alkemade, R. , van Oorschot, M. , Miles, L. , Nellemann, C. , Bakkenes, M. , & ten Brink, B. (2009). GLOBIO 3: a framework to investigate options for reducing global terrestrial biodiversity loss. Ecosystems, 12(3), 374 -390. • Bond, S. , Mc. Donald, J. , & Vardon, M. (2013) Experimental Biodiversity Accounting in Australia. Paper for 19 th London Group Meeting, London, UK. 12 -14 November 2013. • Brooks, T. M. , R. A. Mittermeier, C. G. Mittermeier, G. A. B. Da Fonseca, A. B. Rylands, W. R. Konstant, P. Flick, J. Pilgrim, S. Oldfield, G. Magin, and C. Hilton-Taylor. 2002. Habitat Loss and Extinction in the Hotspots of Biodiversity Pérdida de Hábitat y Extinciones en Áreas Críticas para la Biodiversidad. Conservation Biology 16: 909 -923. • Certain, G. , Skarpaas, O. , Bjerke, J. -W. , Framstad, E. , Lindholm, M. , Nilsen, J. -E. , … Nybø, S. (2011). The Nature Index: a general framework for synthesizing knowledge on the state of biodiversity. Plo. S One, 6(4), e 18930. • IUCN. (2012 a). Guidelines for Application of IUCN Red List Criteria at Regional and National Levels: Version 4. 0. Gland, Switzerland Cambridge, UK: IUCN. iii + 41 pp. • Phillips, S. J. , Anderson, R. P. , & Schapire, R. E. (2006). Maximum entropy modeling of species geographic distributions. Ecological modelling, 190(3), 231 -259. • Scholes, R. J. , & Biggs, R. (2005). A biodiversity intactness index. Nature, 434(7029), 45 -49. • Weber, J. , 2014. Ecosystem Natural Capital Accounts: A Quick Start Package. 77 (Technical Series). Montreal: Secretariat of the Convention on Biological Diversity. 51 SEEA-EEA: Biodiversity accounting http: //www. unescap. org/our-work/statistics
Acknowledgements • Prepared by: • Michael Bordt • Regional Adviser on Environment Statistics ESCAP Statistics Division bordt@un. org • Adapted from: • WCMC and Michael Bordt • Advancing Natural Capital Accounting, a collaboration between The United Nations Statistics Division (UNSD), United Nations Environment Programme (UNEP) and the Secretariat of the Convention on Biological Diversity (CBD) and is supported by the Government of Norway. • UNEP-WCMC has contributed to the creation of this module. • https: //unstats. un. org/unsd/envaccounting/eea_project/default. asp • Contact: seea@un. org 52 SEEA-EEA: Biodiversity accounting http: //www. unescap. org/our-work/statistics
- Slides: 52