Biochemical tests Preanalytical phase Quantification errors Quantification properties

Biochemical tests Pre-analytical phase Quantification errors Quantification properties Validation/Verification Reference materials Reference values Predictive values Diagnostic effectivity


Laboratory automation and consolidation

Standalone analyzers MASARYK UNIVERSITY Past - Present - Future 4

POCT – way of the future?

POCT ABR, glucometers, coaguchecks, CRP measurement, cardial markers, atherosclerosis markers

What use are laboratory tests • • Screening Diagnosis Monitoring Response to therapy • Hormonal disbalance • Markers of anemie • Markers sepsis • Tumormarkers • Cardial markers • TDM • Renal functions • Liver functions ………
 Analytical phase (proper instrumentation, calibration,")
Doctor Preanalytical phase (patient preparation, sample collection, transport, preparation) Analytical phase (proper instrumentation, calibration, proper dilution…) Post analytical phase (result supervision, comparison to patient history and diagnosis…) Doctor

How much trust do you put to laboratory results? What would you do when you doubt the results validity?
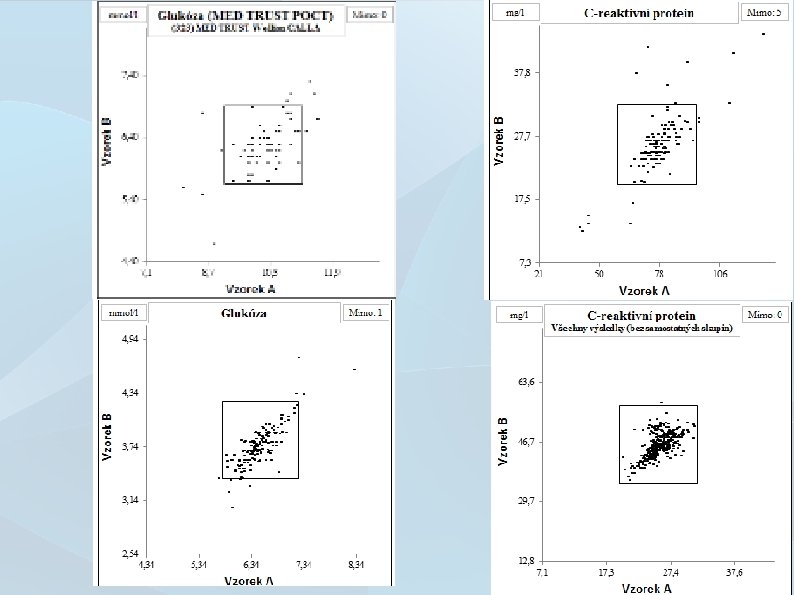

How to standardize lab results? Follow instructions! 11

GIGO => „Garbage in. . . Analytical error Post-analytical error GIGO =>. . . garbage out“ Increasing total error Pre-analytical error

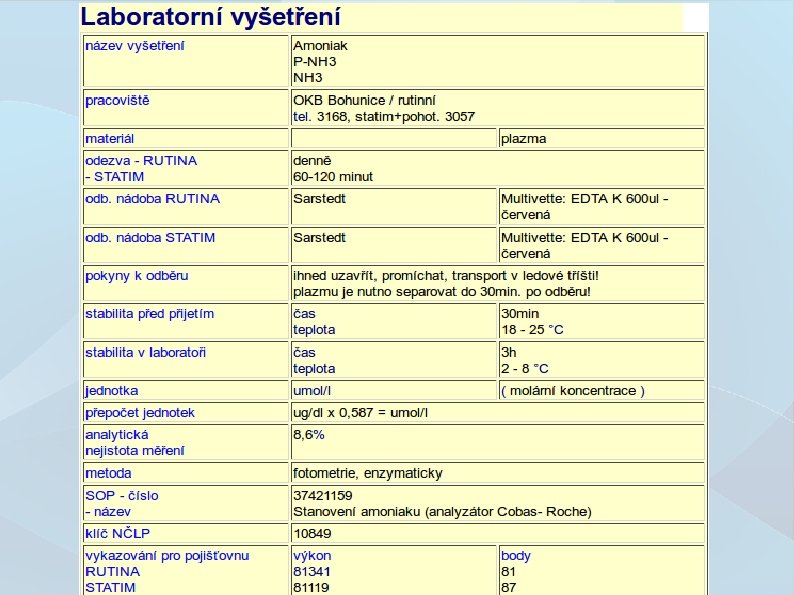
Pre-analytical phase ● ● ● The time period between the physician's indication and the laboratory analysis Proper pre-analytical procedures are necessary for accurate results (46 -68 % of erroneous results are caused by faulty pre-analytics) Instructions are provided by laboratory

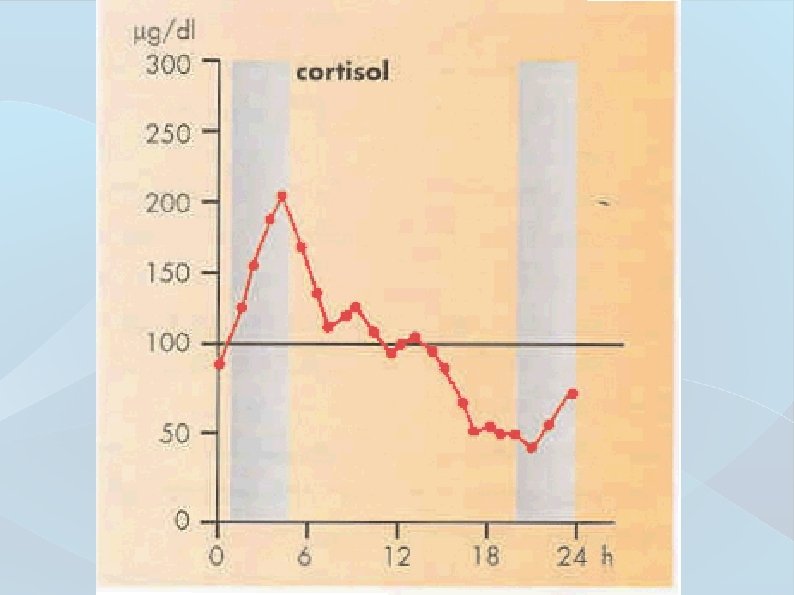
Pre-analytical phase ● ● Biological variability of measured parameters require patients and medical personel to mind several factors before taking the sample: Controlable factors timing / exclusion of medication with interfering properties / diet / physical and psychological stress, smoking, alcohol / patient position during sample taking / sample container ● Uncontrolable factors age, gender, race, gravidity

Pre-analytical phase ● Intra-individual variability Time-dependent parameter changing widening the interval of physiological values ● Inter-individual variability Time-independent parameter value variability in a healthy population (genetic, environmental factors)

Analysis ● ● ● Analysis is a process where values of examined biological material parameters are determined Analyzed parameter is referred to as an analyte determined in a process called quantification Accuracy of analysis is limited by measurement errors, results are limited by value uncertainty

Quantification error ● The term error is understood as a difference between measured value and referent value (not to be confused with a mistake) ● Errors may be divided in groups of random, systematic and gross errors

Gross errors ● ● Caused by faulty methodology, fatigued personnel, analyzer malfunction May be uncovered only through test repeat Such errors register as outliers on plots and may be tested and removed from data sheet Q-test, Grubbs, Cochran C, z-test

Random errors ● ● Unpredictably occurring value offset participating in the total error of quantification. Gaussian distribution with null average value and standard deviation. Size of error can be decreased by higher number of run tests (repeatability). Systematic error ● Error significance Number of measurements

Random errors Low measurement precision High measurement precision

Systematic errors ● ● Predictably occurring value offset participating in the total error of quantification. The cause of a systematic error may be known or not. The error may be compensated by applying a correction factor.

Quantification error - systematic High bias Low bias Total error Bias Reference value Random error Measurements

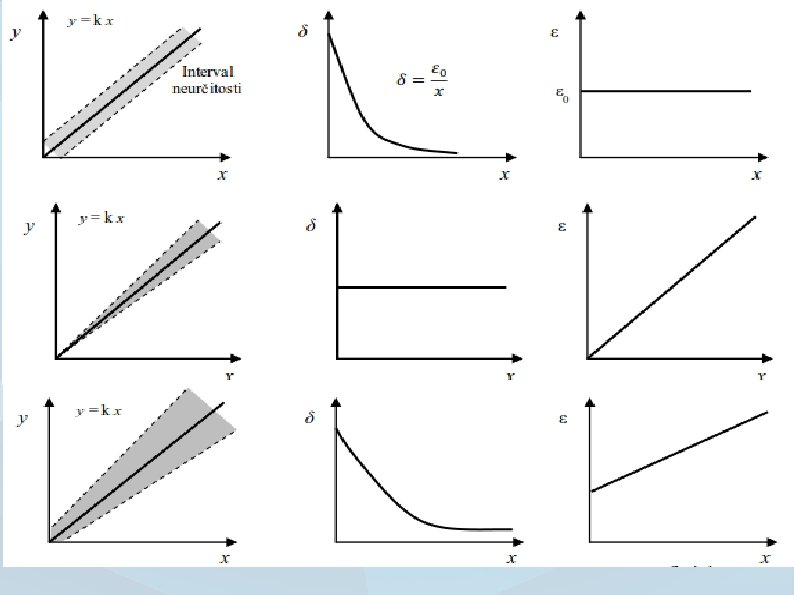
Quantification properties – Result uncertainty Characterizing the distribution of values around the result with normal probability of occurrence Standard deviations or variation coefficients are generally used for standard uncertainty assessment Combined standard uncertainty is calculated after determination of all uncertainty sources – Expanded combined uncertainty is calculated from combined standard uncertainty (k=2) Uc = k. uc (k=2 for 95% probability range)
 The minimal amount of analyte in")
Quantification properties – Limit of detection (Lo. D) The minimal amount of analyte in sample to register a significant signal (3 s) – Limit of quantification (Lo. Q) The minimal amount of analyte in sample that can be quantified with appointed result uncertainty (10 s) – Working range Range of analyte concentrations between the minimal and maximal limits of quantification
 Total quantification error World class Good Excelent Border")
Allowed bias (% target value TEa) Total quantification error World class Good Excelent Border Bad Operation point Allowed imprecision (s, % of target value TEa)

Validation/Verification ● Adopting new method of quantification requires either validation or verification – Validation is a process of method authentication and checking if the parameters qualify for it's designed use Precision, trueness, Lo. D, Lo. Q, selectivity, specificity, working range, linearity, robustness, repeatability reproducibility – Verification is a process of values proofing stated in validation, and the methods specifications meet its requirements

Reference materials & calibrations ● ● Comparison of results with referent materials values for the assessment of quantification trueness Calibration materials are derived from materials with higher specification called traceability via hierarchy of referent materials

Reference values

Reference values ● ● May be obtained by analysis of healthy population with high standard specification of individuals – such population is called reference population Literature, data from quantification assay supplier, consensus of experts

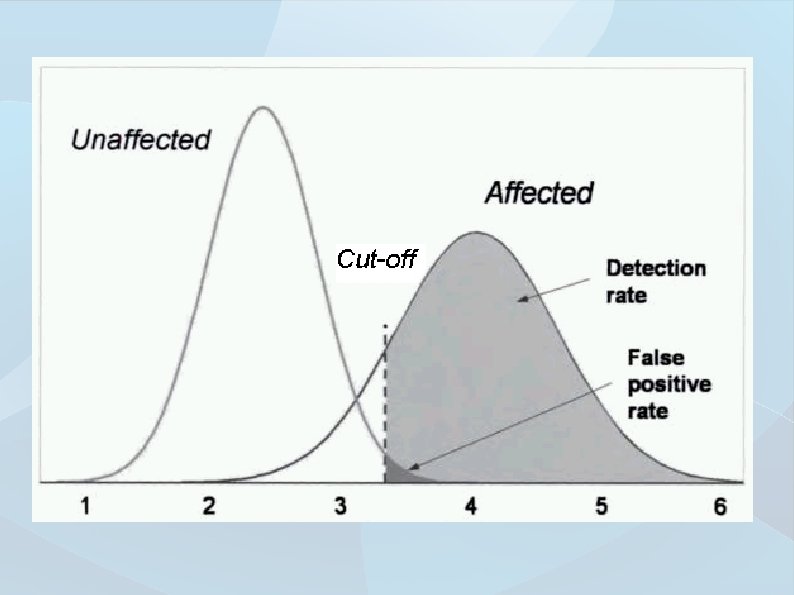
Healthy population Ill patients TN TP Ideal method

Quantification diagnostic effectivity – Specificity Measure of avoiding cross-reactivity in negative samples Healthy with negative test Diagnostic specificity All healthy Valued especially in tests verifying the final diagnosis and with serious diseases (intervention seriously damages patient) Study sample Disease Healthy Positive test TP FP Negative test FN TN Total TP FN FP TN Total TP + FN + TN

Quantification diagnostic effectivity – Sensitivity Measure of detecting low analyte concentrations in positive samples ill with positive test Diagnostic sensitivity All ill patients Valued especially in screening tests for early disease detection Study sample Disease Healthy Positive test TP FP Negative test FN TN Total TP FN FP TN Total TP + FN + TN
 ● ● Graphical evaluatoin of test dicriminatory capabilities The")
ROC (Receiver operating characteristic plot) ● ● Graphical evaluatoin of test dicriminatory capabilities The y axis comprises of the test sensitivity and x axis comprises of unspecificity for all cut-off values
 • AUC quantifies diagnostic effectivity of the test •")
ROC (Receiver operating characteristic plot) • AUC quantifies diagnostic effectivity of the test • sensitivity, specificity, positive and negative predictive values,

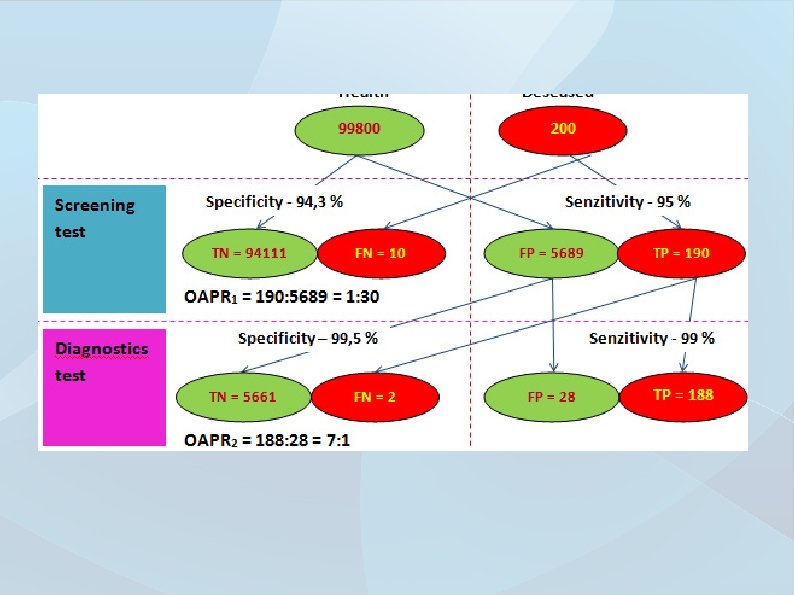
Predictive values ● Positive predictive value Probability that positive test means ill individual Ill with positive test All with positive test ● TP TP FP Negative predictive value Probability that negative test means healthy individual TN Healthy with negative test All with negative test TN FN

Predictive values ● Prevalence Rate of representation among population ● Ill TP + FN The whole sample TP + FN + FP + TN Odds ratio Ratio of positive to negative tests, assesses the test information yield TP x TN FP x FN

Interpretation of laboratory results must go hand in hande with the clinical state of the patient When suspicious of erroneous results, contact the laboratory, measurements may be repeated from the sample or you can perform new sample collection Be mindful of proper preanalytics – „Trash in -> Trash out“ Always incorporate POCT systems in cooperation with laboratory Don‘t forget about the false positive/false negative areas for tests. Reference values and cut-offs are not everything)

Thank you for attention
- Slides: 45