
Bio 301 Overview of Topics Intro Bioprocessing Biotechnology

Bio 301 Overview of Topics Intro Bioprocessing – Biotechnology: Make money from bioprocesses Inputs are of lower value than outputs (products) Computer based learning activities (CBLA) are on http: //sphinx. murdoch. edu. au/units/extern/BIO 301/teach/index. htm 1
2

3
4

5
6
7
Lecture overview L 1 -3 Lecture 1: Intro, study guide, what is a bioreactor, Learning by interacting Lecture 2: What is diffusion, how can we predict the behaviour of a randomly moving molecule? moving dots, entropy, driving force, equilibrium, rate of diffusion, first order kinetics, k. La Lecture 3: oxygen transfer rate, k. La value. Graphical method of determining the k. La. Mathematical (2 point) determination of k. LA Calculation and prediction of oxygen transfer as function of DO. Oxygen transfer efficiency. Bacterial OUR, DO. steady state 8
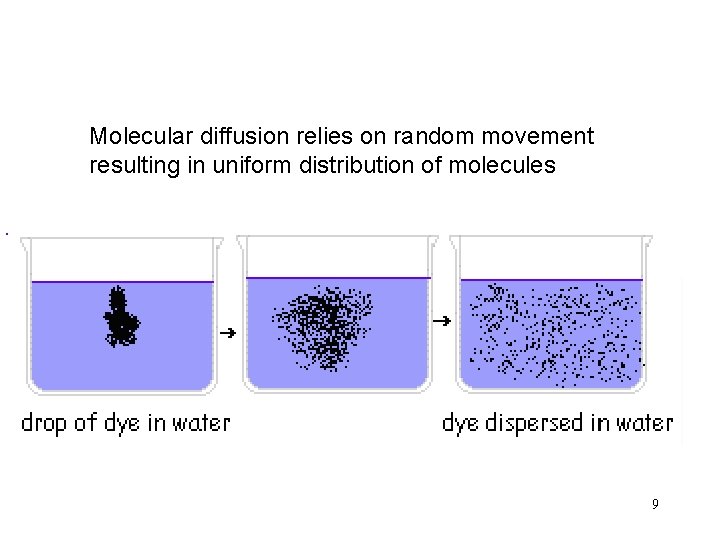
Molecular diffusion relies on random movement resulting in uniform distribution of molecules 9

Oxygen Transfer Rate (OTR) Overview Diffusion, how does it work, how can we predict it? Diffusion is random …. and yet predictable. A simple model simulation can show that although the diffusion movement is random, it can be precisely predicted for large number of molecules (e. g. Fick’s law of diffusion) 10

Oxygen Transfer Rate (OTR) Low OTR (diffusion, convection) High OTR Transfer by diffusion is extremely slow and depends on surface area Wind Air In • • • Oxygen transfer by convection (turbulences) is more efficient • Bioreactors combine maximum convection with maximum diffusion • Course bubbles cause more convection, fine bubbles more diffusion 11 How soluble is oxygen?
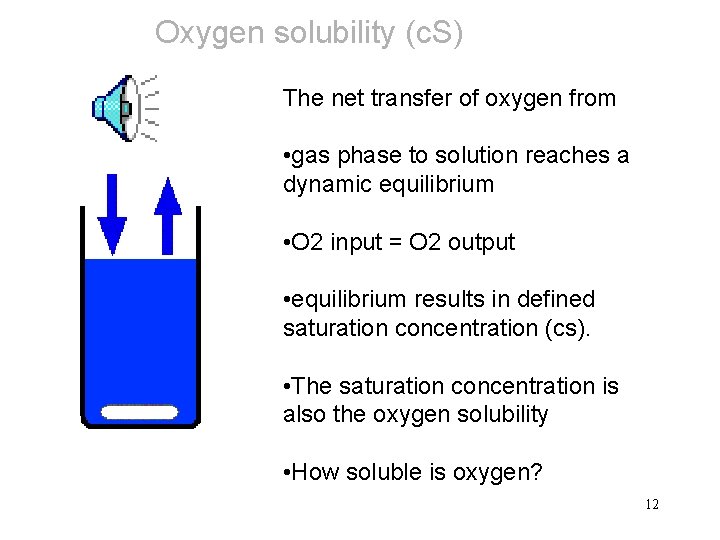
Oxygen solubility (c. S) The net transfer of oxygen from • gas phase to solution reaches a dynamic equilibrium • O 2 input = O 2 output • equilibrium results in defined saturation concentration (cs). • The saturation concentration is also the oxygen solubility • How soluble is oxygen? 12

Oxygen solubility (c. S) Oxygen is not very polar poorly soluble in water. Oxygen Solubility is described by Henry’s Law which applies to all gases p = k*c. S p = partial pressure of oxygen k = constant depending on gas type, solution and temperature c. S = concentration of oxygen dissolved in water • Meaning: The amount of oxygen which dissolves in water is proportional to the amount of oxygen molecules present per volume of the gas phase. • Partial pressure ~ number of O 2 molecules per volume of gas increases with O 2 concentration in gas increases with total gas pressure How to calculate partial pressure? (refer to CBLA) 13
Oxygen solubility (c. S) Examples of using the proportionality between partial pressure of oxygen in the atmosphere and the saturation concentration c. S: p = k*c. S • • p = partial pressure of oxygen k = constant depending on gas type, solution and temperature c. S = concentration of oxygen dissolved in water If the reactor is operated under 2 times atmospheric pressure (200 k. Pa instead of 100 k. Pa air pressure), the new saturation concentration will be abou 16 mg/L instead of 8 mg/L. If air (partial pressure = 0. 21* 100 k. Pa) is replaced by pure oxygen atmosphere (partial pressure 100 k. Pa) the oxygen saturation concentration is about 40 mg/L (more precise 8*100/21) instead of 8 mg/L. How to calculate partial pressure? (refer to CBLA) 14

Oxygen solubility (c. S) Oxygen Saturation Concentration cs (mg/L) Effect of temperature cs = 468 (31. 6 + T) Temperature (°C) Oxygen solubility decreases with increasing temperature. Overall: oxygen is poorly soluble (8 mg/: at room temp. ) More important than solubility is oxygen supply rate (oxygen transfer rate OTR). 15
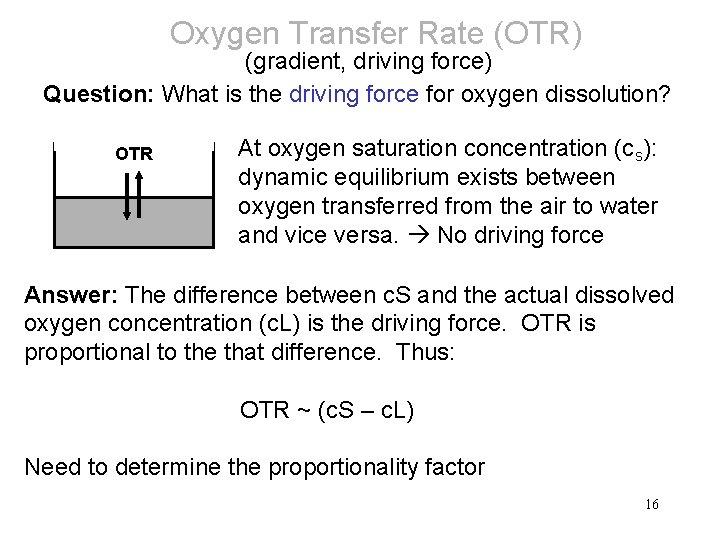
Oxygen Transfer Rate (OTR) (gradient, driving force) Question: What is the driving force for oxygen dissolution? OTR At oxygen saturation concentration (cs): dynamic equilibrium exists between oxygen transferred from the air to water and vice versa. No driving force Answer: The difference between c. S and the actual dissolved oxygen concentration (c. L) is the driving force. OTR is proportional to the that difference. Thus: OTR ~ (c. S – c. L) Need to determine the proportionality factor 16
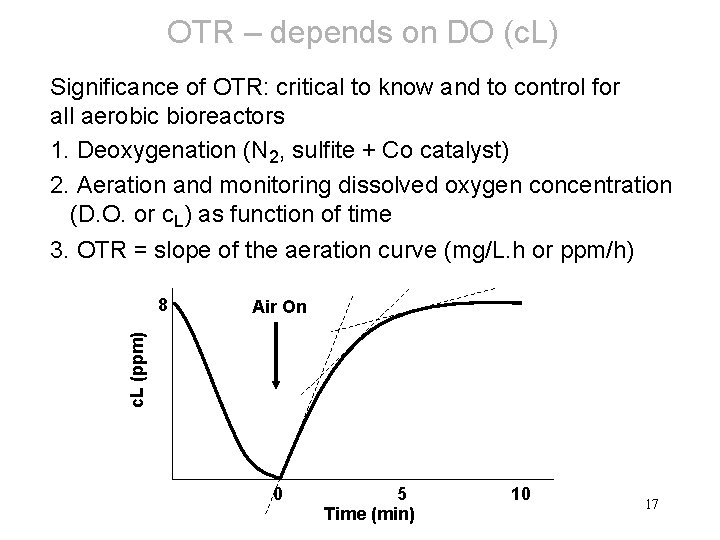
OTR – depends on DO (c. L) Significance of OTR: critical to know and to control for all aerobic bioreactors 1. Deoxygenation (N 2, sulfite + Co catalyst) 2. Aeration and monitoring dissolved oxygen concentration (D. O. or c. L) as function of time 3. OTR = slope of the aeration curve (mg/L. h or ppm/h) Air On c. L (ppm) 8 0 5 Time (min) 10 17
OTR – depends on DO (c. L) 4. Observation: OTR decreases over time (and with incr. c. L) 5. OTR is not a good measure of aeration capacity of a bioreactor 6. OTR is highest at c. L = zero (Standard OTR) 7. OTR is zero at oxygen saturation concentrations (cs) 8. OTR is negatively correlated to c. L 9. OTR is correlated to the saturation deficit (cs - c. L), which is the driving force for oxygen transfer 9. The factor of correlation is the volumetric mass transfer coefficient k. La OTR = k. La (cs - c. L) Mg/L/h h-1 mg/L 18
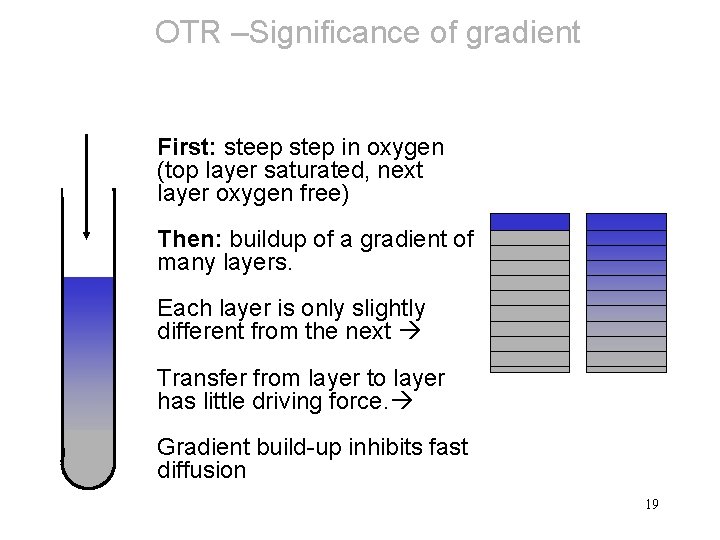
OTR –Significance of gradient First: steep step in oxygen (top layer saturated, next layer oxygen free) Then: buildup of a gradient of many layers. Each layer is only slightly different from the next Transfer from layer to layer has little driving force. Gradient build-up inhibits fast diffusion 19
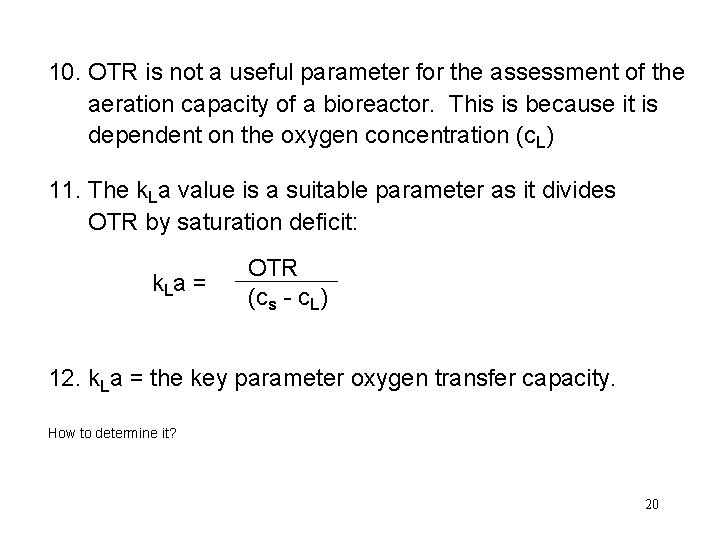
10. OTR is not a useful parameter for the assessment of the aeration capacity of a bioreactor. This is because it is dependent on the oxygen concentration (c. L) 11. The k. La value is a suitable parameter as it divides OTR by saturation deficit: k. La = OTR (cs - c. L) 12. k. La = the key parameter oxygen transfer capacity. How to determine it? 20
Lec 2 summary: Oxygen is poorly soluble depending mainly on • partial pressure in headspace • Temperature OTR is driven and proportional to driving force (c. S-c. L) k. La is the proportionality factor (first order kinetics) k. La describes the performance of a bioreactor to provide Oxygen to microbes Next lecture: quantify k. LA 21
Lec 3 outlook: • Aeration curve • Quantify OTR at a given point of an aeration curve • Quick estimate of k. La • Graphical determination of k. La • Mathematical determination of k. La • Run computer simulation to obtain data • Oxygen transfer efficiency (OTE) • OTR proportional to cs-c. L • OTR inverse proportional to c. L 22
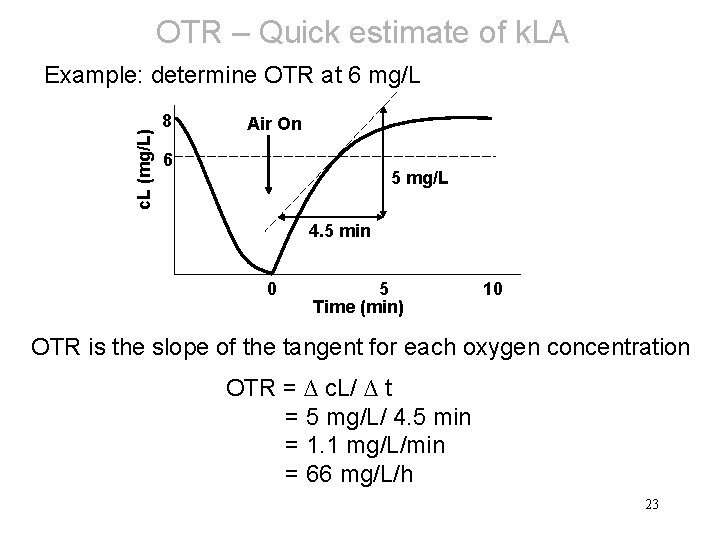
OTR – Quick estimate of k. LA c. L (mg/L) Example: determine OTR at 6 mg/L 8 Air On 6 5 mg/L 4. 5 min 0 5 Time (min) 10 OTR is the slope of the tangent for each oxygen concentration OTR = ∆ c. L/ ∆ t = 5 mg/L/ 4. 5 min = 1. 1 mg/L/min = 66 mg/L/h 23
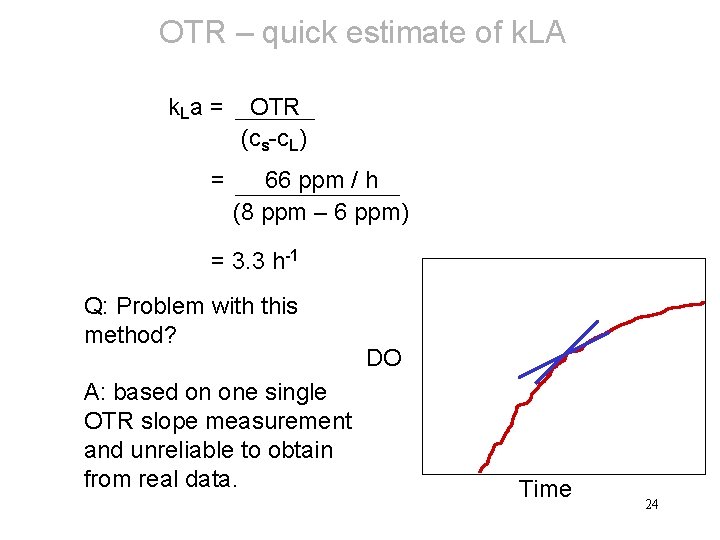
OTR – quick estimate of k. LA k. La = = OTR (cs-c. L) 66 ppm / h (8 ppm – 6 ppm) = 3. 3 h-1 Q: Problem with this method? A: based on one single OTR slope measurement and unreliable to obtain from real data. DO Time 24
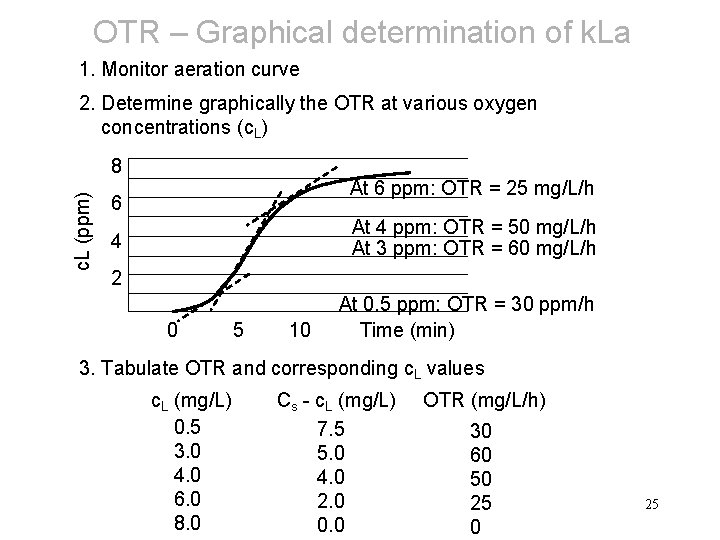
OTR – Graphical determination of k. La 1. Monitor aeration curve 2. Determine graphically the OTR at various oxygen concentrations (c. L) c. L (ppm) 8 At 6 ppm: OTR = 25 mg/L/h 6 At 4 ppm: OTR = 50 mg/L/h At 3 ppm: OTR = 60 mg/L/h 4 2 0 5 10 At 0. 5 ppm: OTR = 30 ppm/h Time (min) 3. Tabulate OTR and corresponding c. L values c. L (mg/L) 0. 5 3. 0 4. 0 6. 0 8. 0 Cs - c. L (mg/L) 7. 5 5. 0 4. 0 2. 0 0. 0 OTR (mg/L/h) 30 60 50 25

OTR – Graphical determination of k. La 4. Plot OTR values as a function of cs - c. L. Standard OTR (mg/L/h) 100 cs 50 0 0 2 4 6 cs- c. L (mg/L) k. La = 70 mg/L/h 6 mg/L = 12 h-1 8 5. A linear correlation exists between k. La and the saturation deficit (cs - c. L) which is the driving force of the reaction. 6. The slope of the plot OTR versus cs - c. L is the k. La value. 7. The standard OTR (max OTR) can be read from the intercept with the cs line. (Standard OTR = 100 ppm/h) 26
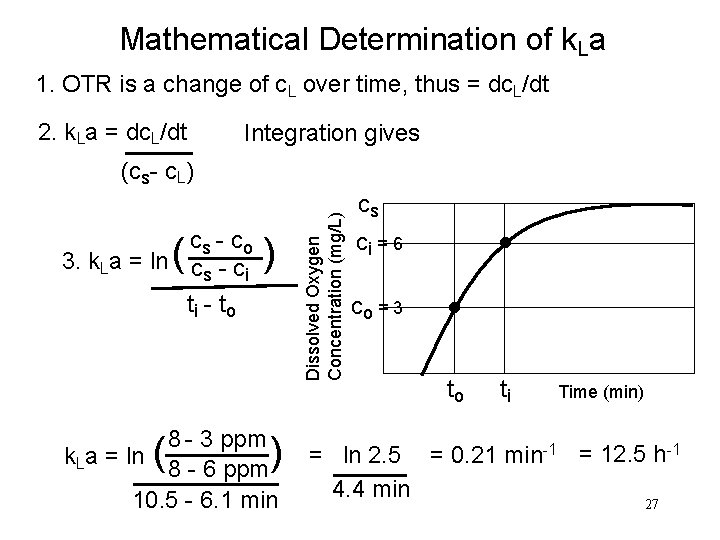
Mathematical Determination of k. La 1. OTR is a change of c. L over time, thus = dc. L/dt 2. k. La = dc. L/dt Integration gives cs - co 3. k. La = ln c - c s i ti - t o ( ) 8 - 3 ppm k. La = ln 8 - 6 ppm 10. 5 - 6. 1 min ( ) Dissolved Oxygen Concentration (mg/L) (cs- c. L) cs • ci = 6 co = 3 • to ti Time (min) = ln 2. 5 = 0. 21 min-1 = 12. 5 h-1 4. 4 min 27
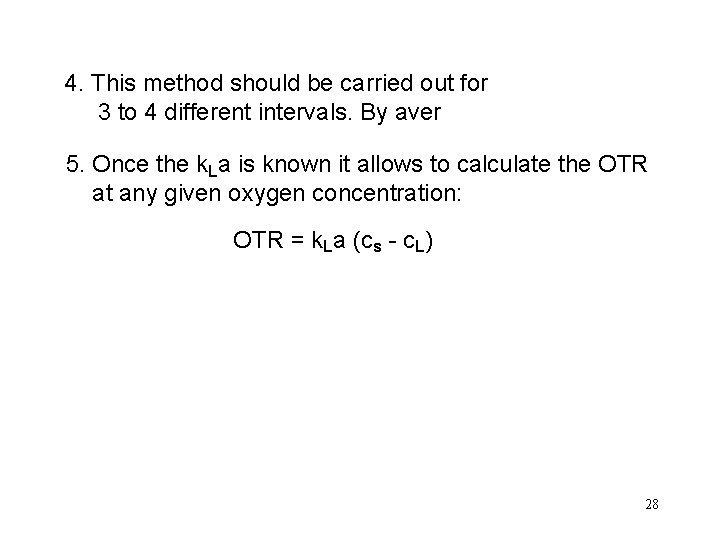
4. This method should be carried out for 3 to 4 different intervals. By aver 5. Once the k. La is known it allows to calculate the OTR at any given oxygen concentration: OTR = k. La (cs - c. L) 28
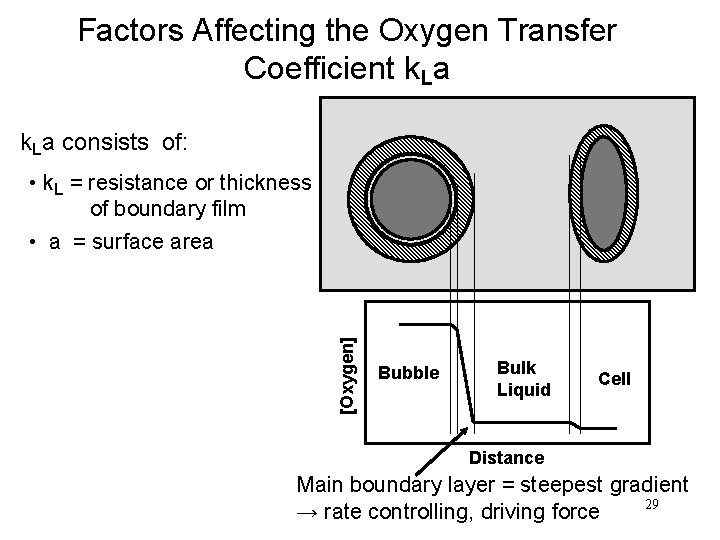
Factors Affecting the Oxygen Transfer Coefficient k. La consists of: [Oxygen] • k. L = resistance or thickness of boundary film • a = surface area Bubble Bulk Liquid Cell Distance Main boundary layer = steepest gradient 29 → rate controlling, driving force
Effect of Fluid Composition on OTR The transfer across this boundary layer increases with: 1) ↓ thickness of the film, thus ↑ degree of shearing (turbulence) 2) ↑ surface area 3) ↓ surface tension 4) ↓ viscosity (best in pure water) 5) ↓ salinity 6) ↓ concentration of chemicals or particles 7) detergents? 8) ↑ emulsifiers, oils, “oxygen vectors” 30
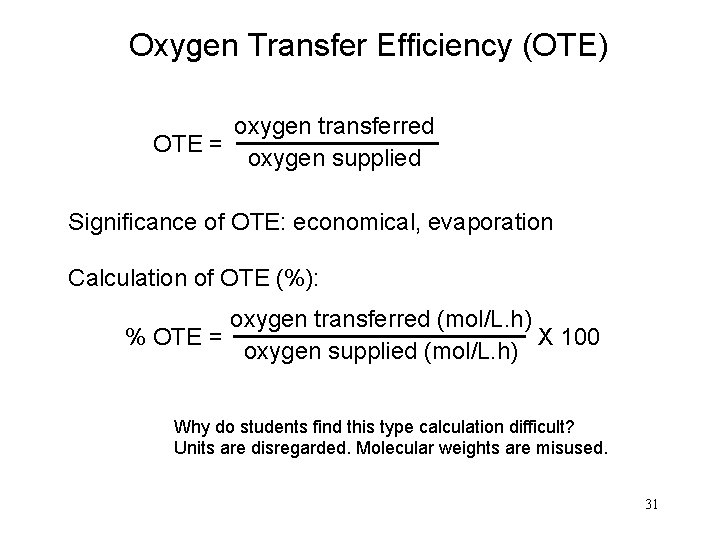
Oxygen Transfer Efficiency (OTE) oxygen transferred OTE = oxygen supplied Significance of OTE: economical, evaporation Calculation of OTE (%): oxygen transferred (mol/L. h) X 100 % OTE = oxygen supplied (mol/L. h) Why do students find this type calculation difficult? Units are disregarded. Molecular weights are misused. 31

Oxygen Transfer Efficiency (OTE) A bioreactor ( 3 m 3) is aerated with 200 L/min airflow. If the OTR is constant (100 mg/L/h) determine the %OTE. 1. Convert the airflow into an oxygen flow in mmol/L/h 200 L air /min = 12000 L air/h (x 60) = 2520 L O 2/h (x 21%) = 102. 9 mol O 2/h (÷ 24. 5 L/mol) = 34. 3 mmol O 2/L. h (÷ 3000 L) 2. OTR 100 mg/L. h = 3. 1 mmol O 2/L. h % OTE = 3. 1 (mmol/L. h) 34. 3 (mol/L. h) = 9% (÷ 32 g/mol) X 100 32
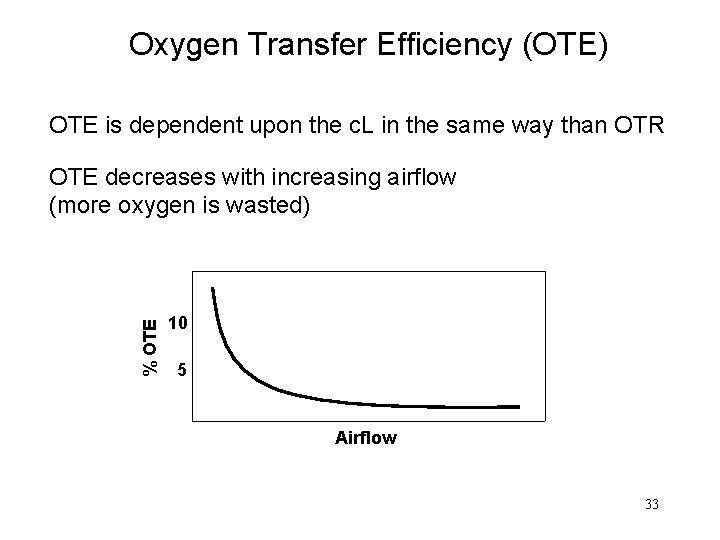
Oxygen Transfer Efficiency (OTE) OTE is dependent upon the c. L in the same way than OTR % OTE decreases with increasing airflow (more oxygen is wasted) 10 5 Airflow 33
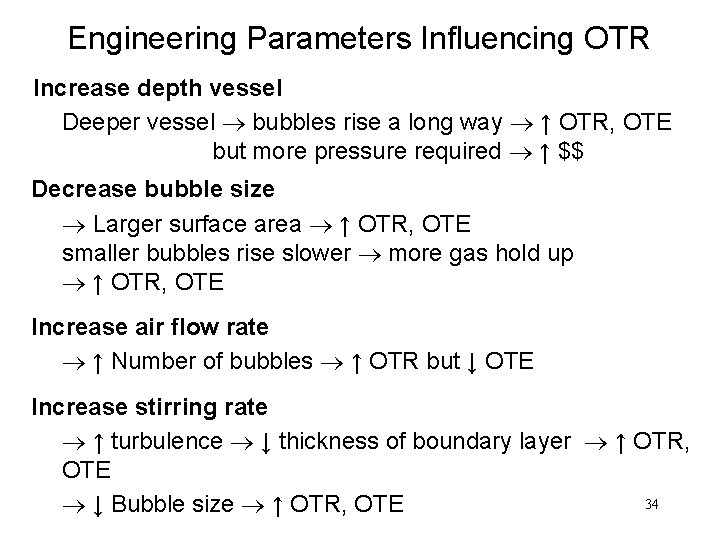
Engineering Parameters Influencing OTR Increase depth vessel Deeper vessel bubbles rise a long way ↑ OTR, OTE but more pressure required ↑ $$ Decrease bubble size Larger surface area ↑ OTR, OTE smaller bubbles rise slower more gas hold up ↑ OTR, OTE Increase air flow rate ↑ Number of bubbles ↑ OTR but ↓ OTE Increase stirring rate ↑ turbulence ↓ thickness of boundary layer ↑ OTR, OTE 34 ↓ Bubble size ↑ OTR, OTE
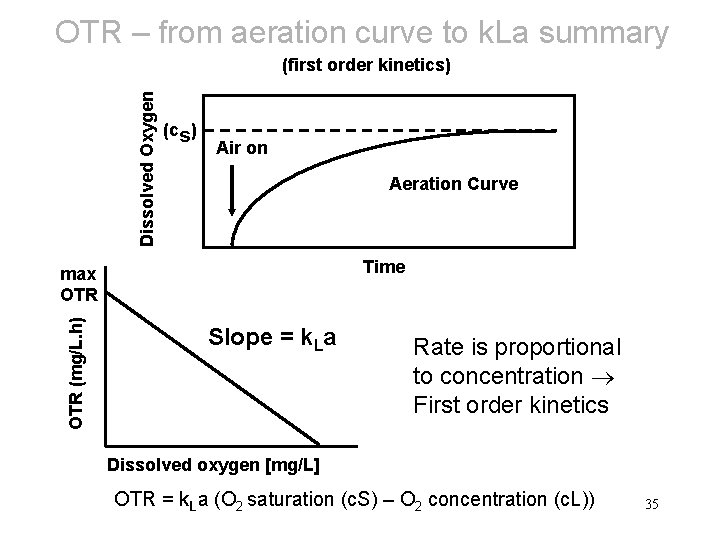
OTR – from aeration curve to k. La summary Dissolved Oxygen (first order kinetics) (cs) Air on Aeration Curve Time OTR (mg/L. h) max OTR Slope = k. La Rate is proportional to concentration First order kinetics Dissolved oxygen [mg/L] OTR = k. La (O 2 saturation (c. S) – O 2 concentration (c. L)) 35
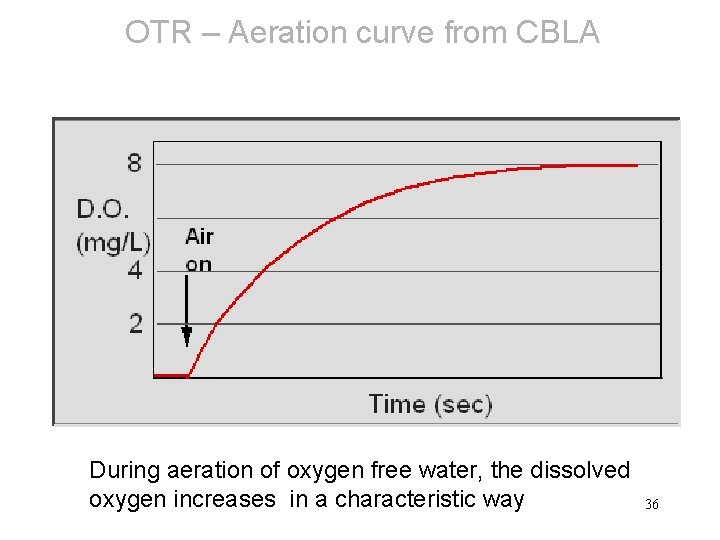
OTR – Aeration curve from CBLA During aeration of oxygen free water, the dissolved oxygen increases in a characteristic way 36
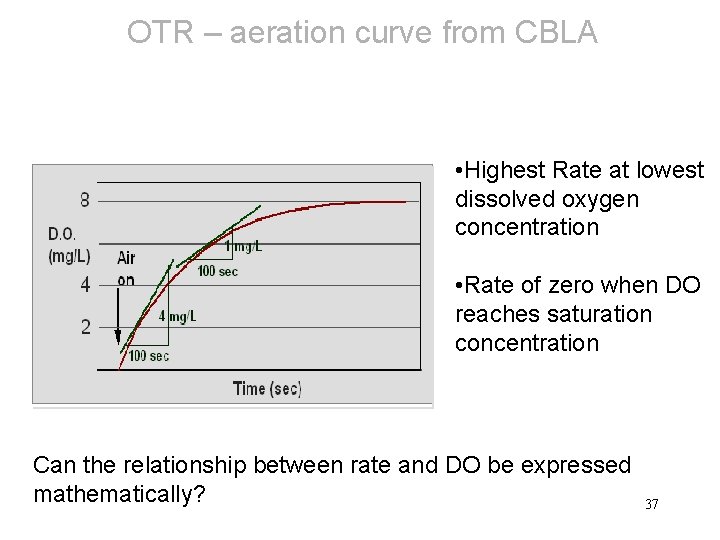
OTR – aeration curve from CBLA • Highest Rate at lowest dissolved oxygen concentration • Rate of zero when DO reaches saturation concentration Can the relationship between rate and DO be expressed mathematically? 37
- Slides: 37