Binomial Models Dr SanLin Chung Department of Finance

Binomial Models Dr. San-Lin Chung Department of Finance National Taiwan University

In this lecture, I will cover the following topics: 1. Brief Review of Binomial Model 2. Extensions of the binomial models in the literature 3. Fast and accurate binomial option models 4. Binomial models for pricing exotic options 5. Binomial models for other distributions or processes

1. Brief Review of Binomial Trees • Binomial trees are frequently used to approximate the movements in the price of a stock or other asset • In each small interval of time the stock price is assumed to move up by a proportional amount u or to move down by a proportional amount d

The main idea of binomial option pricing theory is pricing by arbitrage. If one can formulate a portfolio to replicate the payoff of an option, then the option price should equal to the price of the replicating portfolio if the market has no arbitrage opportunity. Binomial model is a complete market model, i. e. options can be replicated using stock and riskfree bond (two states next period, two assets). On the other hand, trinomial model is not a complete market model.
 • A derivative lasts for time T and")
Generalization (Figure 10. 2, page 202) • A derivative lasts for time T and is dependent on a stock S 0 ƒ S 0 u ƒu S 0 d ƒd
 • Consider the portfolio that is long shares and short 1 derivative")
Generalization (continued) • Consider the portfolio that is long shares and short 1 derivative S 0 u – ƒu S 0– f S 0 d – ƒd • The portfolio is riskless when S 0 u – ƒu = S 0 d – ƒd or
 • Value of the portfolio at time T is S 0 u")
Generalization (continued) • Value of the portfolio at time T is S 0 u – ƒu • Value of the portfolio today is (S 0 u – ƒu )e–r. T • Another expression for the portfolio value today is S 0 – f • Hence ƒ = S 0 – (S 0 u – ƒu )e–r. T
 • Substituting for we obtain ƒ = [ p ƒu + (1")
Generalization (continued) • Substituting for we obtain ƒ = [ p ƒu + (1 – p )ƒd ]e–r. T where
![Risk-Neutral Valuation • ƒ = [ p ƒu + (1 – p )ƒd ]e-r.](http://slidetodoc.com/presentation_image_h/ea88ea80ae802451fe2c4657a9b3b28e/image-9.jpg "Risk-Neutral Valuation • ƒ = [ p ƒu + (1 – p )ƒd ]e-r.")
Risk-Neutral Valuation • ƒ = [ p ƒu + (1 – p )ƒd ]e-r. T • The variables p and (1 – p ) can be interpreted as the risk-neutral probabilities of up and down movements • The value of a derivative is its expected payoff in a risk-neutral world discounted at the risk-free rate S 0 ƒ ) p (1 – p S 0 u ƒu S 0 d ƒd

Irrelevance of Stock’s Expected Return When we are valuing an option in terms of the underlying stock the expected return on the stock is irrelevant
 S 1 – p Su p Sd")
Movements in Time dt (Figure 18. 1) S 1 – p Su p Sd

Tree Parameters for a Nondividend Paying Stock • We choose the tree parameters p, u, and d so that the tree gives correct values for the mean & standard deviation of the stock price changes in a risk-neutral world er dt = pu + (1– p )d 2 dt = pu 2 + (1– p )d 2 – [pu + (1– p )d ]2 • A further condition often imposed is u = 1/ d
")
2. Tree Parameters for a Nondividend Paying Stock (Equations 18. 4 to 18. 7) When dt is small, a solution to the equations is
 S 0 u S 0 d S 0")
The Complete Tree (Figure 18. 2) S 0 u S 0 d S 0 u 2 S 0 d 2 S 0 u 3 S 0 u 4 S 0 u 2 S 0 d 3 S 0 d 2 S 0 d 4

Backwards Induction • We know the value of the option at the final nodes • We work back through the tree using risk-neutral valuation to calculate the value of the option at each node, testing for early exercise when appropriate

Example: Put Option S 0 = 50; X = 50; r =10%; = 40%; T = 5 months = 0. 4167; dt = 1 month = 0. 0833 The parameters imply u = 1. 1224; d = 0. 8909; a = 1. 0084; p = 0. 5076
 Figure 18. 3")
Example (continued) Figure 18. 3

Trees and Dividend Yields • When a stock price pays continuous dividends at rate q we construct the tree in the same way but set a = e(r – q )dt • As with Black-Scholes: – For options on stock indices, q equals the dividend yield on the index – For options on a foreign currency, q equals the foreign risk-free rate – For options on futures contracts q = r

Binomial Tree for Dividend Paying Stock • Procedure: – Draw the tree for the stock price less the present value of the dividends – Create a new tree by adding the present value of the dividends at each node • This ensures that the tree recombines and makes assumptions similar to those when the Black. Scholes model is used
 There have been many extensions of the CRR model. The")
II. Literature Review (1/5) There have been many extensions of the CRR model. The extensions can be classified into five directions. The first direction consists in modifying the lattice to improve the accuracy and computational efficiency. Boyle (1988) Breen (1991) Broadie and Detemple (1996) Figlewski and Gao (1999) Heston and Zhou (2000)
 The second branch of the binomial OPM literature has incorporated")
II. Literature Review (2/5) The second branch of the binomial OPM literature has incorporated multiple random assets. Boyle (1988) Boyle, Evnine, and Gibbs (1989) Madan, Milne, and Shefrin (1989) He (1990) Ho, Stapleton, and Subrahmanyam (1995) Chen, Chung, and Yang (2002)
 The third direction of extensions consists in showing the convergence")
II. Literature Review (3/5) The third direction of extensions consists in showing the convergence property of the binomial OPM. Cox, Ross, and Rubinstein (1979) Amin and Khanna (1994) He (1990) Nelson and Ramaswamy (1990)
 The fourth direction of the literature generalizes the binomial model")
II. Literature Review (4/5) The fourth direction of the literature generalizes the binomial model to price options under stochastic volatility and/or stochastic interest rates. Stochastic interest rate: Black, Derman, and Toy (1990), Nelson and Ramaswamy (1990), Hull and White (1994), and others. Stochastic volatility: Amin (1991) and Ho, Stapleton, and Subrahmanyam (1995) Ritchken and Trevor (1999)
 The fifth extension of the CRR model focus on adjusting")
II. Literature Review (5/5) The fifth extension of the CRR model focus on adjusting the standard multiplicative-binomial model to price exotic options, especially path -dependent options. Asian options: Hull and White (1993) and Dai and Lyuu (2002). Barrier options: Boyle and Lau(1994), Ritchken (1995), Boyle and Tian (1999), and others.
 Instead of setting u")
3. Alternative Binomial Tree 3. 1 Jarrow and Rudd (1982) Instead of setting u = 1/d we can set each of the 2 probabilities to 0. 5 and
 Su pu S pm S pd Sd")
3. 2 Trinomial Tree (Page 409) Su pu S pm S pd Sd

3. 3 Adaptive Mesh Model • This is a way of grafting a high resolution tree on to a low resolution tree • We need high resolution in the region of the tree close to the strike price and option maturity
 method is proposed")
3. 4 BBS and BBSR The Binomial Black & Scholes (BBS) method is proposed by Broadie and Detemple (1996). The BBS method is identical to the CRR method, except that at the time step just before option maturity the Black and Scholes formula replaces at all the nodes.
(1/3) The second method was put forward by Tian(1999) termed “flexible")
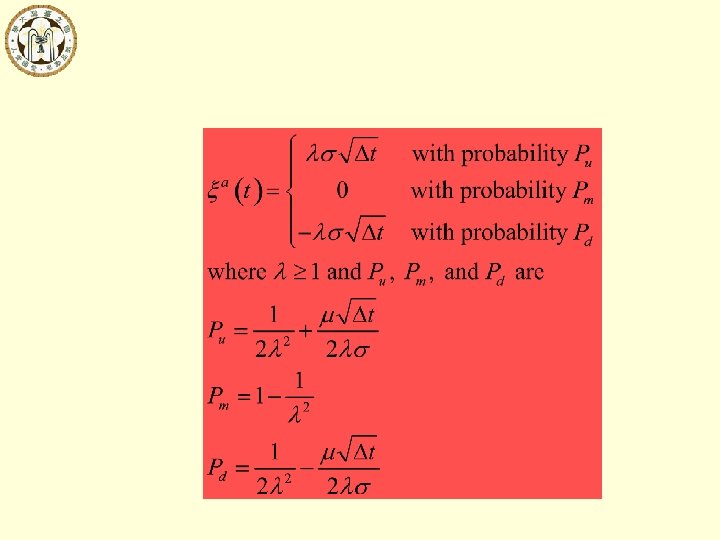
3. 5 Tian (1999)(1/3) The second method was put forward by Tian(1999) termed “flexible binomial model”. To construct the so-called flexible binomial model, the following specification is proposed: where λ is an arbitrary constant, called the “tilt parameter”. It is an extra degree of freedom over the standard binomial model. In order to have “nonnegative probability”, the tilt parameter must satisfy the inequality (8) after jumps, u and d, are redefined.
 show that the accuracy or rate of convergence")
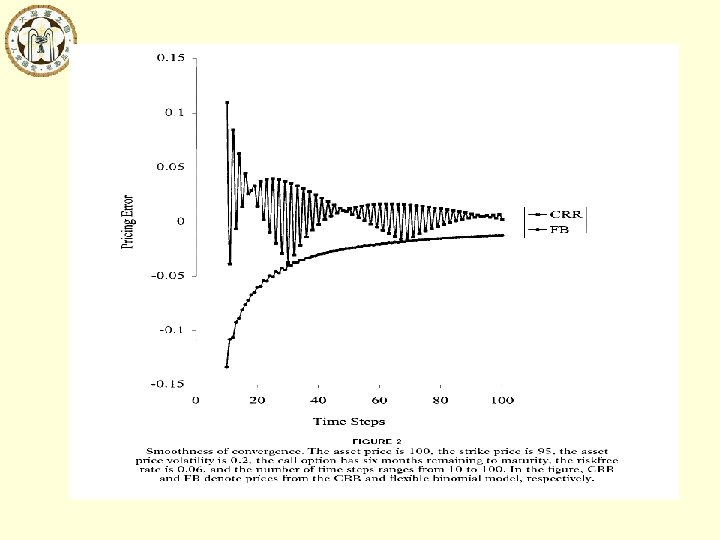
3. 6 Heston and Zhou (2000) show that the accuracy or rate of convergence of binomial method depend, crucially on the smoothness of the payoff function. They have given an approach that is to smooth the payoff function. Intuitively, if the payoff function at singular points can be smoothing, the binomial recursion might be more accurate. Hence they let G(x) be the smoothed one; where g(x) is the actual payoff function.
")
3. 7 Leisen and Reimer (1996)
")
3. 7 Leisen and Reimer (1996)
")
3. 8 WAND (2002, JFM)
 WAND (2002) showed that the binomial option pricing errors")
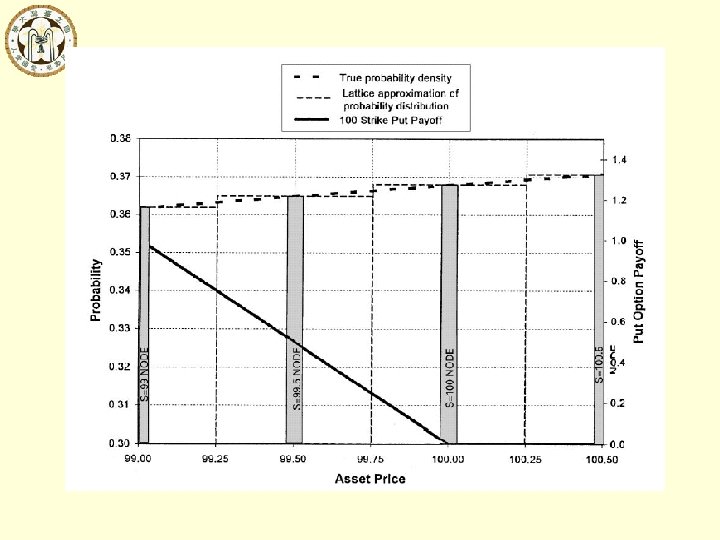
3. 8 WAND (2002, JFM) WAND (2002) showed that the binomial option pricing errors are related to the node positioning and they defined a ratio for node positioning.
 The relationship between the errors and node positioning.")
3. 8 WAND (2002, JFM) The relationship between the errors and node positioning.

3. 9 GCRR model Theorem 1. follows: In the GCRR model, the three parameters are as where is a stretch parameter which determines the shape of the binomial tree. Moreover, when , i. e. , the number of time steps n grows to infinity, the GCRR binomial prices will converge to the Black-Scholes formulae for European options. • Obviously the CRR model is a special case of our GCRR model when. • We can easily allocate the strike price at one of the final nodes.

3. 9 GCRR model Various Types of GCRR models:

4. Binomial models for exotic options Topics: 1. Path dependent options using trees • Lookback options • Barrier options 2. Options where there are two stochastic variables (exchange option, maximum option, etc. )

Path Dependence: The Traditional View • Backwards induction works well for American options. It cannot be used for path-dependent options • Monte Carlo simulation works well for path-dependent options; it cannot be used for American options

Extension of Backwards Induction • Backwards induction can be used for some path-dependent options • We will first illustrate the methodology using lookback options and then show it can be used for Asian options
 • Consider an American lookback put on a stock where")
Lookback Example (Page 462) • Consider an American lookback put on a stock where S = 50, = 40%, r = 10%, dt = 1 month & the life of the option is 3 months • Payoff is Smax-ST • We can value the deal by considering all possible values of the maximum stock price at each node (This example is presented to illustrate the methodology. A more efficient ways of handling American lookbacks is in Section 20. 6. )
 S 0 =")
Example: An American Lookback Put Option (Figure 20. 2, page 463) S 0 = 50, = 40%, r = 10%, dt = 1 month, 0. 00 62. 99 50. 00 5. 47 70. 70 56. 12 62. 99 3. 36 56. 12 62. 99 56. 12 4. 68 50. 00 6. 87 0. 00 44. 55 50. 00 6. 38 A 56. 12 50. 00 6. 12 2. 66 36. 69 50. 00 10. 31 44. 55 56. 12 50. 00 11. 57 5. 45 35. 36 50. 00 14. 64

Why the Approach Works This approach works for lookback options because • The payoff depends on just 1 function of the path followed by the stock price. (We will refer to this as a “path function”) • The value of the path function at a node can be calculated from the stock price at the node & from the value of the function at the immediately preceding node • The number of different values of the path function at a node does not grow too fast as we increase the number of time steps on the tree

Extensions of the Approach • The approach can be extended so that there are no limits on the number of alternative values of the path function at a node • The basic idea is that it is not necessary to consider every possible value of the path function • It is sufficient to consider a relatively small number of representative values of the function at each node

Working Forward • First work forwards through the tree calculating the max and min values of the “path function” at each node • Next choose representative values of the path function that span the range between the min and the max – Simplest approach: choose the min, the max, and N equally spaced values between the min and max

Backwards Induction • We work backwards through the tree in the usual way carrying out calculations for each of the alternative values of the path function that are considered at a node • When we require the value of the derivative at a node for a value of the path function that is not explicitly considered at that node, we use linear or quadratic interpolation

Part of Tree to Calculate Value of an Option on the Arithmetic Average Y 0. 5056 S = 54. 68 Average S Option Price 47. 99 7. 575 51. 12 8. 101 54. 26 8. 635 57. 39 9. 178 S = 50. 00 Average S Option Price 46. 65 5. 642 49. 04 5. 923 51. 44 6. 206 53. 83 6. 492 X S = 45. 72 0. 4944 S=50, X=50, =40%, r=10%, T=1 yr, dt=0. 05 yr. We are at time 4 dt Z Average S Option Price 43. 88 3. 430 46. 75 3. 750 49. 61 4. 079 52. 48 4. 416
")
Part of Tree to Calculate Value of an Option on the Arithmetic Average (continued) Consider Node X when the average of 5 observations is 51. 44 Node Y: If this is reached, the average becomes 51. 98. The option price is interpolated as 8. 247 Node Z: If this is reached, the average becomes 50. 49. The option price is interpolated as 4. 182 Node X: value is (0. 5056× 8. 247 + 0. 4944× 4. 182)e– 0. 1× 0. 05 = 6. 206
")
A More Efficient Approach for Lookbacks (Section 20. 6, page 465)
 • When trees are used")
Using Trees with Barriers (Section 20. 7, page 467) • When trees are used to value options with barriers, convergence tends to be slow • The slow convergence arises from the fact that the barrier is inaccurately specified by the tree

True Barrier vs Tree Barrier for a Knockout Option: The Binomial Tree Case Barrier assumed by tree True barrier

True Barrier vs Tree Barrier for a Knockout Option: The Trinomial Tree Case Barrier assumed by tree True barrier
")
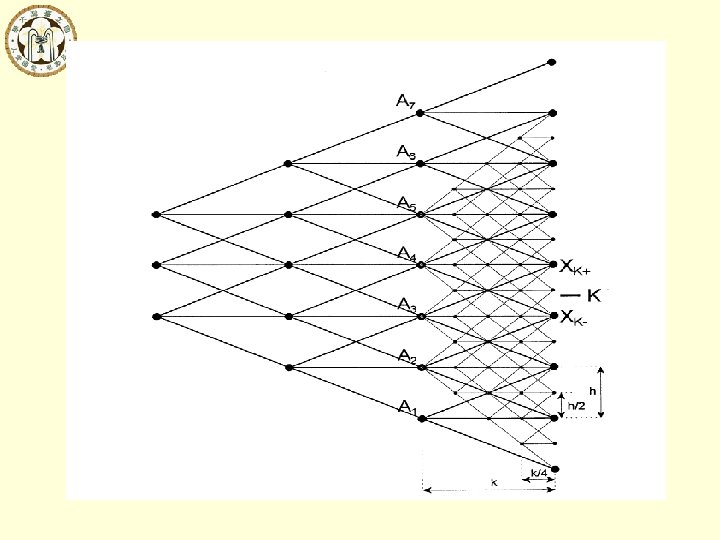
Bumping Up Against the Barrier with the Binomial Method, JD, Boyle and Lau (1994)
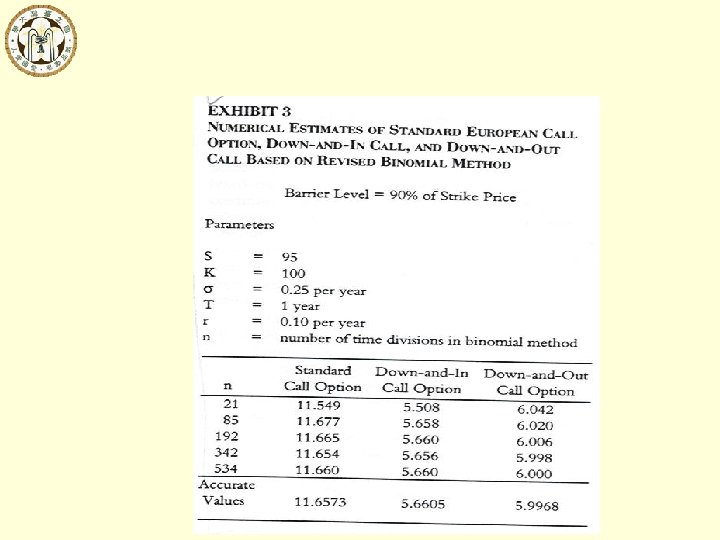
 1 21. 38 2 85. 52 3 192. 42 4 342. 08")
m F(m) 1 21. 38 2 85. 52 3 192. 42 4 342. 08 5 534. 51
")
On Pricing Barrier Options, JD, Ritchken (1995)
 • Time varying barrier • Double barriers")
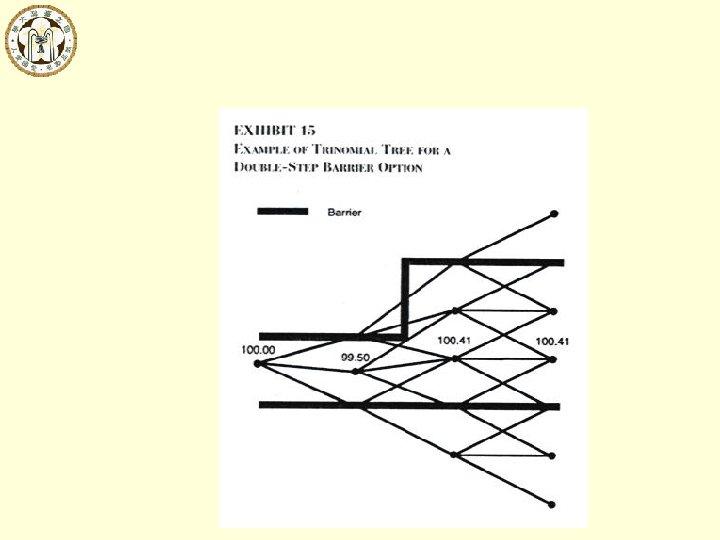
Complex Barrier Options Cheuk and Vorst (1996) • Time varying barrier • Double barriers

Alternative Solutions to the Problem • Ensure that nodes always lie on the barriers • Adjust for the fact that nodes do not lie on the barriers • Use adaptive mesh In all cases a trinomial tree is preferable to a binomial tree

Multi-Asset Case Reference: • • • Boyle, P. P. , J. Evnine, and S. Gibbs, 1989, Numerical Evaluation of Multivariate Contingent Claims, The Review of Financial Studies, 2, 241 -250. Chen, R. R. , S. L. Chung, and T. T. Yang, 2002, Option Pricing in a Multi-Asset, Complete Market Economy, Journal of Financial and Quantitative Analysis, 37, 649666. Ho, T. S. , R. C. Stapleton, and M. G. Subrahmanyam, 1995, Multivariate Binomial Approximations for Asset Prices with Nonstationary Variance and Covariance Characteristics, The Review of Financial Studies, 8, 1125 -1152. Kamrad, B. , and P. Ritchken, 1991, Multinomial Approximating Models for Options with k State Variables, Management Science, 37, 1640 -1652. Madan, D. B. , F. Milne, and H. Shefrin, 1989, The Multinomial Option Pricing Model and Its Brownian and Poisson Limits, The Review of Financial Studies, 2, 251 -265.

Modeling Two Correlated Variables Consider a two-asset case: Under the first approach: Transform variables so that they are not correlated & build the tree in the transformed variables

Modeling Two Correlated Variables We define two new uncorrelated variables: These variables follow the processes: where and are uncorrelated Wiener processes. At each node of the tree, and can be calculated from and using the inverse relationships

Modeling Two Correlated Variables Take the correlation into account by adjusting the position of the nodes:

Modeling Two Correlated Variables Take the correlation into account by adjusting the probabilities

Multi-Asset tree model under complete market economy Chen, R. R. , S. L. Chung, and T. T. Yang, 2002, Option Pricing in a Multi-Asset, Complete-Market Economy, Journal of Financial and Quantitative Analysis, Vol. 37, No. 4, 649 -666. With two uncorrelated Brownian motions with equal variances, the three points, A, B, and C, are best to be “equally” apart from each other. This can be achieved most easily by choosing 3 points, located 120 degrees from each other, on the circumference of a circle, as shown in Exhibit 2.

Multi-Asset tree model under complete market economy To incorporate the correlation between the two Brownian motions, we then rotate the axes, as shown in Exhibit 3.

Multi-Asset tree model under complete market economy Proposition 2 The rotation of the axes is defined as follows: where is the rotation angle of the x-axis counterclockwise and y-axis clockwise. After rotation, we have: • the means and the variances of the rotated ellipse remain unchanged and • the correlation is a function of the rotation degree :

Multi-Asset tree model under complete market economy Finally, for any given time, t, the next period stock prices are:

5. Binomial models for other processes

Time-varying volatility processes
 suggested")
how to construct a recombined binomial/trinomial tree under timevarying volatility? 1. Amin (1991) suggested changing the number of steps (or dt) such that the tree is recombined. 2. Ho, Stapleton, and Subrahmanyam (1995) suggested using two steps to match the conditional and unconditional volatility and unconditional mean. 3. Using the trinomial tree of Boyle (1988) or Ritchken (1995). See next page. Ref : Amin (1995, pp. 39 -40) has a very nice discussion on this issue. Amin, 1995, Option Pricing Trees, Journal of Derivatives, 34 -46.
(1/2) Assume that the underlying asset price follows d. S = r. Sdt")
Amin (1991)(1/2) Assume that the underlying asset price follows d. S = r. Sdt + (t)Sdz then the annual variance of the asset price over the period [0, T] is Let N be the number of time steps desired, then . The time step for each period is denoted as h( t), h(2 t), …, h(n t). Amin let
(2/2) In this case, the tree is recombining because where u( t), u(2")
Amin (1991)(2/2) In this case, the tree is recombining because where u( t), u(2 t), …, u(n t) are size of up movement at each period.
, the asset price, at any given time, can move into three")
Following Boyle (1988), the asset price, at any given time, can move into three possible states, up, down, or middle, in the next period. If S denotes the asset price at time t, then at time t + dt, the prices will be Su, Sd, or Sm. The parameters are defined as follows and where 1, the dispersion parameter, is chosen freely as long as the resulting probabilities are positive. Let i

represent the instantaneous volatility at time ti, then we can set In this case the tree is recombining and the probability of each branch is of course time varying.

To guarantee that the resulting probabilities are positive, we must carefully choose dt and . Roughly speaking, dt must be small enough such that For , as discussed in Boyle (1988), its values must be larger than 1. Denote the maximum and minimum of the instantaneous volatility for the period from time 0 to T as max and min. Then

We can arbitrarily set max as 1. 1 and then all other i will be larger than 1 automatically. Ref : Boyle, P. (1988), A Lattice Framework for Option Pricing with Two State Variables, Journal of Financial and Quantitative Analysis, 23, 1 -12.

Stochastic volatility stochastic interest rate processes

Reference: 1. Hilliard, J. E. , and A. Schwartz, Pricing Options on Traded Assets under Stochastic Interest Rates and Volatility: A Binomial Approach, Journal of Financial Engineering, 6, 281 -305. 2. Hilliard, J. E. , A. L. Schwartz, and A. L. Tucker, 1996, Bivariate Binomial Options Pricing with Generalized Interest Rate Processes, Journal of Financial Research, 14, 585 -602. 3. Nelson, D. B. , and K. Ramaswamy, 1990, Simple Binomial Processes as Diffusion Approximations in Financial Models, Review of Financial Studies, 3, 393 -430. 4. Ritchken, P. , and R. Trevor, 1999, Pricing Option under Generalized GARCH and Stochastic Volatility Processes, Journal of Finance, 54, 377 -402. 5. Hillard, J. E. , and A. Schwartz, 2005, “Pricing European and American Derivatives under a Jump-Diffusion Process: A Bivariate Tree Approach, ” Journal of Financial and Quantitative Analysis, 40, 671 -691. 6. Camara, A. , and S. L. Chung, 2006, Option Pricing for the Transformed-Binomial Class, Journal of Futures Markets, Vol. 26, No. 8, 759 -788.
 proposed a general tree method to approximate diffusion processes. Generally")
Nelson and Ramaswamy (1990) proposed a general tree method to approximate diffusion processes. Generally a binomial or trinomial tree is not recombined because the volatility is not a constant. Nelson and Ramaswamy (1990) suggested a transformation of the variable such that the transformed variable has a constant volatility.
")
Nelson and Ramaswamy (1990)
 For example, under the CEV model:")
Nelson and Ramaswamy (1990) For example, under the CEV model:
 For example, under the CIR model:")
Nelson and Ramaswamy (1990) For example, under the CIR model:

Hilliard-Schwartz: Stochastic Volatility The asset price and return volatility are assumed to follow: d. S = msdt + f(S)h(V)d. Zs d. V = mvdt + b. Vd. Zv (1) Under Q measure ms=S(r - d). First of all, make the following transformation to obtain a unit variance variable Y:
 where")
Next, make the following transformation to obtain a constant variance variable H: (4) where
 where")
Then make another transformation to obtain a unit variance variable Q. (5) where

Binomial tree for Y and trinomial tree for Q Y 2, 2 Y 1, 1 Y 0, 0 Y 2, 0 Y 1, -1 Y 2, -2 Q 2, 2 Q 0, 0 Q 1, 1 Q 2, 1 Q 1, 0 Q 2, 0 Q 1, -1 Q 2, -2 T/n = h : 0 1 2

Option Pricing under GARCH Ritchken, P. , and R. Trevor, 1999, Pricing Option under Generalized GARCH and Stochastic Volatility Processes, Journal of Finance, 54, 377 -402. GARCH model: The main idea is to keep the spanning of the tree flexible, i. e. the size of up or down movements can be adjusted to match the conditional variance.
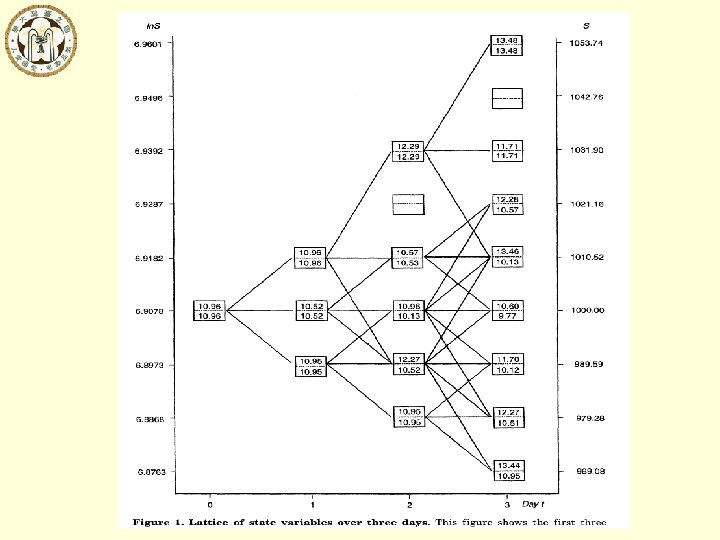

Option Pricing for the Transformed-Binomial Class AntÓnio Câmara 1 and San-Lin Chung 2 January 2004 1 School of Management, University of Michigan-Flint, 3118 William S. White Building, Flint, MI 48502 -1950. Tel: (810) 762 -3268, Fax: (810) 762 -3282, Email: acamara@umflint. edu 2 Department of Finance, The Management School, National Taiwan University, Taipei 106, Taiwan. Tel: 886 -2 -23676909, Fax: 886 -2 -23660764, Email: chungs@mba. ntu. edu. tw.
 binomial option pricing model (OPM)")
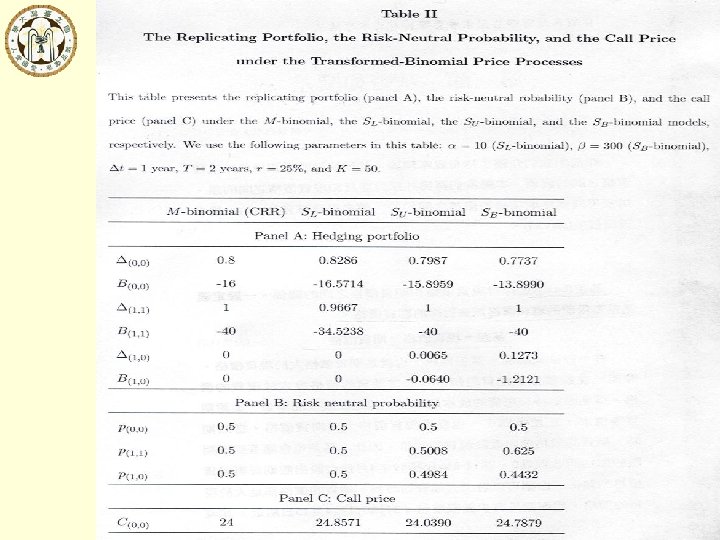
Abstract This paper generalizes the seminal Cox-Ross. Rubinstein (1979) binomial option pricing model (OPM) to all members of the class of transformedbinomial pricing processes. Our investigation addresses issues related with asset pricing modeling, hedging strategies, and option pricing. We derive explicit formulae for (1) replicating or hedging portfolios; (2) risk-neutral transformed-binomial probabilities; (3) limiting transformed-normal distributions; and (4) the value of contingent claims. We also study the properties of the transformedbinomial class of asset pricing rocesses. We illustrate the results of the paper with several examples.
 multiplicative-binomial option pricing model: Cox, Ross, and Rubinstein (1979), Rendlemen and")
I. Introduction (1/7) multiplicative-binomial option pricing model: Cox, Ross, and Rubinstein (1979), Rendlemen and Bartter (1979), and Sharpe (1978) pricing by arbitrage: According to this rule, when there are no arbitrage opportunities, if a portfolio of stocks and bonds replicates the payoffs of an option the option must have the same current price as its replicating portfolio.
 Third, this paper provides a class of distributions that may explain")
I. Introduction (6/7) Third, this paper provides a class of distributions that may explain observed option prices (or implied volatilities).
 model: This M-binomial model assumes that u = 2 and")
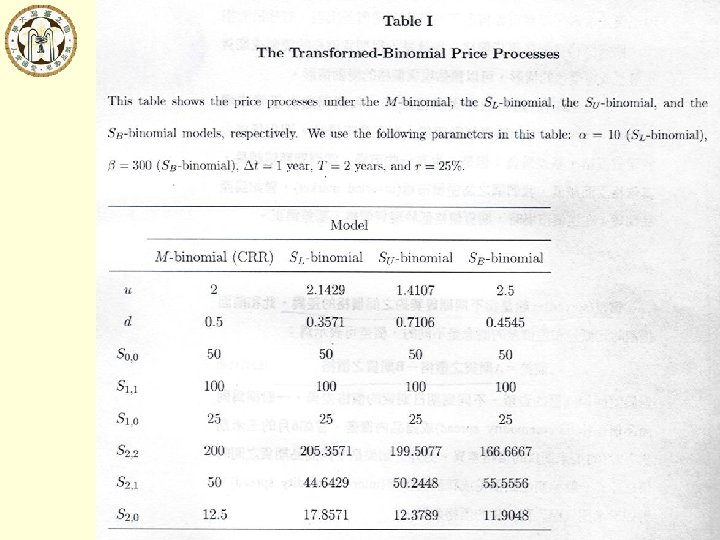
Multiplicative-binomial (hereafter, M-binomial) model: This M-binomial model assumes that u = 2 and d = 0. 5.

The SL-binomial model with a lower bound at maturity: For example, if r = 1. 25 and = 10 then this SLbinomial model assumes that u = 2. 1429 and d = 0. 3571.

The following SU-binomial model: In this SU-binomial model, it is assumed that u = 1. 4107 and d = 0. 7106.

The following SB-binomial model with a threshold : For example, if = 300 then this SB-binomial model assumes that u = 2. 5 and d = 0. 4545.
, the transformation for the SL-binomial is defined as")
The SL-binomial model Following Johnson (1949), the transformation for the SL-binomial is defined as the following in this article:

The SU-binomial model The transformation for the SU-binomial model is defined as:

The SB-binomial model The third example considered in this paper is the SBbinomial model, corresponding to the SB-normal model of Johnson (1949). The transformation for the SBbinomial model is as follows:

This figure shows the convergence pattern resulting from option price calculations with the SL-binomial model. We use the following selection of parameters: S = 100, K = 100, r = 0. 1, = 20, t = 1. 0, = 0. 25.

This figure shows the convergence pattern resulting from option price calculations with the SU-binomial model. We use the following selection of parameters: S = 100, K = 100, r = 0. 1, t = 1. 0, = 0. 25.

This figure shows the convergence pattern resulting from option price calculations with the SB-binomial model. We use the following selection of parameters: S = 100, K =100, r = 0. 1, = 300, t = 1. 0, = 0. 25.
- Slides: 111