BINOMIAL DISTRIBUTIONS Probability Distributions In probability and statistics

BINOMIAL DISTRIBUTIONS

Probability Distributions In probability and statistics, a probability distribution is a mathematical description of a random phenomenon in a way that describes the probabilities of events happening. There are many forms this can take For example: For the random variable “the height of a randomly chosen 15 year old New Zealander” we could represent the probabilities of different heights as…. A table Height Probability 150 – 155 0. 08 155 – 160 0. 08 160 – 165 0. 15 165 – 170 0. 14 170 – 175 0. 16 175 – 180 0. 14 180 – 185 0. 14 185 – 190 0. 08 190 – 195 0. 03 or a histogram Prob.

Statisticians are very keen to model a probability distribution. A common way to do this is to use a mathematical curve. This is similar to a parabola or a cubic, but the area under the entire curve is 1, signifying that the probability of all possible cases is 1 or 100%. Statisticians are keen because if they can find a good model estimate for the distribution, powerful statistical anlyses can quite readily be applied to it.

Conditions of the Binomial Distribution One of the crucial things about the binomial distribution is that there are certain conditions under which it was derived. Checking that these have been met proves a crucial step towards justifying the use of the binomial distribution. The conditions for the use of the Binomial Distribution are: • There a fixed number of trials • There are only 2 possible outcomes • The probability of success in each trial is constant • Each trial is independent

Binomial Example: Chuck-a-luck • A gambling game played at carnivals, played against a banker. • A player pays a dollar to play and rolls 3 dice. • If no 4 s are rolled, the player loses. • Otherwise the player gets back one dollar for every 4 rolled and gets their original dollar back.

4. N

4 N 4 N

4 4 N N 4 N 4 N

Introducing the binomial distribution Can you see a pattern emerging? What could the probabilities be like when you throw four dice?

Formal Definition: Binomial Distribution •

Understanding the formula 4 4 N N 4 N How many pathways through the tree diagram to get to the desired number of ‘successes’ Each pathway through the tree diagram has x successes and… (n-x) failures 4 N 4 N

Understanding the formula What is the likelihood of getting one 4? 4 4 N N 4 N There will be 3 pathways through which there will be one 4 Each pathway through the tree diagram has 1 success and… 2 failures 4 N 4 N

Conditions of the Binomial Distribution There are certain conditions under which the distribution was derived. Checking that these have been met proves a crucial step towards justifying the use of the binomial distribution. The conditions for the use of the Binomial Distribution are: • There a fixed number of trials • There are only 2 possible outcomes • The probability of success in each trial is constant • Each trial is independent

Two Outcomes • When a coin is flipped, the outcome is either a head or a tail; • For convenience, one of the outcomes can be labeled "success" and the other outcome "failure. "

Two Outcomes • When a magician guesses the card selected from a deck, the magician can either be correct or incorrect; • Again for convenience, one of the outcomes can be labeled "success" and the other outcome "failure. "

Two Outcomes • When a baby is born, the baby is either born in the month of March or is not. • One of the outcomes can be labeled "success" and the other outcome "failure. "

Two Outcomes • In each of these examples, an event has two mutually exclusive possible outcomes. • One of the outcomes can be labeled "success" and the other outcome "failure. "

Don’t get hung up on the word success, sometimes in a medical analysis you might think of contracting a disease as “success”.

Chuck a Luck • 3 dice rolled- how many 4 s? • Does it meet the criteria of the Binomial?

Experiment • The experiment consists of fixed trials. We rolled 3 dice • Each trial can result in just two possible outcomes – ‘ 4’ or not a 4 on each dice • The probability of success is constant – 1/6 on every trial (each dice). • The trials are independent; that is, getting a ‘ 4’ on one trial does not affect whether we get a ‘ 4’ on other dice.

Do these situations meet the conditions of the Binomial distribution? • At Mt Eden Foodtown, 60% of customers pay by credit card. Find the probability that in a randomly selected sample of ten customers • Exactly two pay by credit card • Fixed number of trials: 10 customers to pay • Two outcomes: Pay by credit card or don’t • Probability remains constant: 60% (established over a large number of transactions) • Independence: Randomly selected customers

Solution • Number of ways of picking 2 out of 10 customers

Solution • Number of ways of picking 2 out of 10 customers

Solution • Number of ways of picking 2 out of 10 customers

Write out the answer in long form • At Mt Eden Foodtown, 60% of customers pay by credit card. Find the probability that in a randomly selected sample of ten customers • More than seven pay by credit card

Write out the answer in long form • At Mt Eden Foodtown, 60% of customers pay by credit card. Find the probability that in a randomly selected sample of ten customers • More than seven pay by credit card

Write out the answer in long form • At Mt Eden Foodtown, 60% of customers pay by credit card. Find the probability that in a randomly selected sample of ten customers • More than seven pay by credit card

• If a binomial experiment has seven trials in which the probability of success is 0. 64 • What is the probability of at least five successes? • Wait, does that mean: • {5, 6, 7, 8, 9, …. } • Or • {6, 7, 8, 9, . . ) getting endpoints right is crucial in a discrete distribution

Constraints Creating constraints is the process of converting sentences about constraining factors into inequaltites. Wording to keep in mind (x=number of ponies) She has at least 20 ponies She has at most 10 ponies She has 5 or more ponies She has 12 or less ponies She has more than 14 ponies She has less than 11 ponies The number of ponies cannot exceed 25 The number of ponies must exceed 22

If a binomial experiment has seven trials in which the probability of success is 0. 64 • What is the probability of at least five successes? • What is the probability at most five successes? • What is the probability of getting exactly five successes? Wouldn’t it be cool if we could do this pressing a few buttons?

Graphics Calculator Binomial Dist. Stats Mode from Calc F 5 Distribution Then F 5 Binomial Dist Finding point dist P(X=#) select Bpd Select Data: Variable For P(X<3), For P(X=3), n : 10 n : 12 p : 0. 15 x: 2 x: 3 For P(X=3) = 0. 1720

BINOMIAL REAL SLOW WORKSHEET

If a binomial experiment has seven trials in which the probability of success is 0. 64 What is the probability of at least five successes? 0. 51 What is the probability at most five successes? 0. 78 What is the probability of getting exactly five successes? 0. 29

• 30% of pupils travel to school by bus. • From a sample of ten pupils chosen at random, find the probability that • Only three travel by bus.

• 30% of pupils travel to school by bus. From a sample of ten pupils chosen at random, find the probability that only three travel by bus. • Fixed trials: 10 pupils • Two outcomes: travel by bus or don’t • Probability remains constant: 0. 30 • Independence: random selection of students

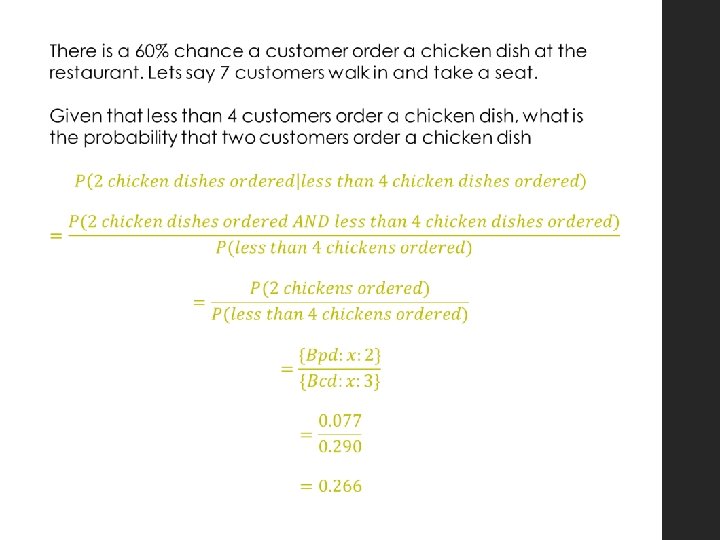
• 30% of pupils travel to school by bus. From a sample of ten pupils chosen at random, find the probability that only three travel by bus. • P(X=3) = {Bpd: x: 3} = 0. 266
 1 – {Bcd: x: 5} = 0. 0188")
n=7, pi=2/5, P(X>=6) 1 – {Bcd: x: 5} = 0. 0188

Expectation and Variance • Mean of the binomial • Variance

A college history class has 75 members. If there is a 12% absentee rate per class meeting, find the mean, variance, and standard deviation of the number of students who will be absent from each class. Mean = _____ Variance = _____ Stand Dev = _____ It is a bit harder than usual to note this is a situation well modelled by a Binomial distribution: • • Fixed number of trials (75 members) Two outcomes (a student is either absent or not) Prob of success remains constant (the absentee rate has probably been arrived through a lot of data, so it is reasonable to apply it to the next randomly chosen student) Independence: has to be assumed as some student being absent does effect the probability of other students being absent (if they decide to go somewhere else together etc. )

Approximately 56% of the people wear seat belts. If 50 people were randomly checked, find the mean, variance, and standard deviation for how many will be wearing seat belts. Mean = _____ Variance = _____ Stand Dev = _____ • Fixed number of trials (50 seat belt checks) • Two outcomes (person is wearing seatbelt or isn’t) • Prob of success remains constant (the prob of wearing seatbelt has probably been arrived through a lot of data, so it is reasonable to apply it to the next randomly chosen person at checkpoint) • Independence: has to be assumed as some people may have influence on other peoples priority when it comes to wearing seat belts n x pi =50 x 0. 56 = 28 people wearing seat belts Variance = 12. 32 (units don’t make sense) Standard deviation = 3. 51 people wearing seat belts

If a chef serves 120 customers tonight, and the probability of a complaint has historically shown to be 0. 5% Find the mean number of complaints tonight 0. 6 Find the standard deviation of the number of complaints 0. 77 The same chef bakes 10 soufflés in a day, and he has historically had a record of 91% of his soufflés rising. He would only really have to worry about delaying service to the customer if less than 6 of them rose. What advice would you give him P(X < 6) = 0. 001 There is a negligible chance of that happening (0. 1%) Therefore things can be kept as they are

SOME HARD STUFF

comparing how many times more likely at least 3 strikes out of 4 compared with 0 strikes out of 4 principle: when comparing a ratio, ie. how many times more A is then B, you simply put the quantity of A on the numerator and the quantity of B in the denominator. The answer will tell you how many times more A there is then B Eg. At a party I make a punch which has 3 parts Orange Juice and 2 parts Sparkling water. To find out how many times more Orange Juice compared to Sparkling water we write a fraction with the amount of orange juice in the numerator and the amount of sparkling water in the denominator. ie. there is 1. 5 times more orange juice <numerator> compared to sparkling water <denominator>

Principle: Or how many times more sparkling water there is than orange juice. The amount of sparkling water <numerator> is 0. 6667 times as much as orange juice <denominator> OR there is 33. 33% less sparkling water than orange juice

Comparing how many times more likely at least 3 strikes out of 4 Compared with 0 strikes out of 4 To find out how many times more likely a is compared to b, We find the fraction: So, the question asks how many times more likely 3 strikes out of 4 compared with 0 strikes out of 4. Both probabilities follow a Binomial Distribution. It is 18. 5 times more likely Joe bowls 3 strikes out of 4 compared to 0 strikes out of 4.

The probability that a student is awarded a distinction in the mathematics examination is 0. 05. In a randomly selected group of 50 students, what is the most likely number of students awarded a distinction? • It is usually only necessary to consider the probabilities of values of X close to the mean.

DISCRETE vs CONTINUOUS

Discussion: Discrete data can only take exact values Examples: • The number of cars passing a checkpoint in 30 minutes • The show sizes of students in a class • The number of tomatoes on each plant in a greenhouse • Variables with many repeated values are treated as discrete

Discussion: Continuous data • Continuous data can be given values within a specified range or measured to a specified degree of accuracy. • Examples: • The speed of a vehicle as it passes a checkpoint • The mass of a cooking apple • The time taken by a volunteer to perform a task • Variables with few repeated values are treated as continuous
- Slides: 51