BIJU PM PGT ECONOMICS KV 2 KOCHI WHO

BIJU PM PGT ECONOMICS KV 2 KOCHI

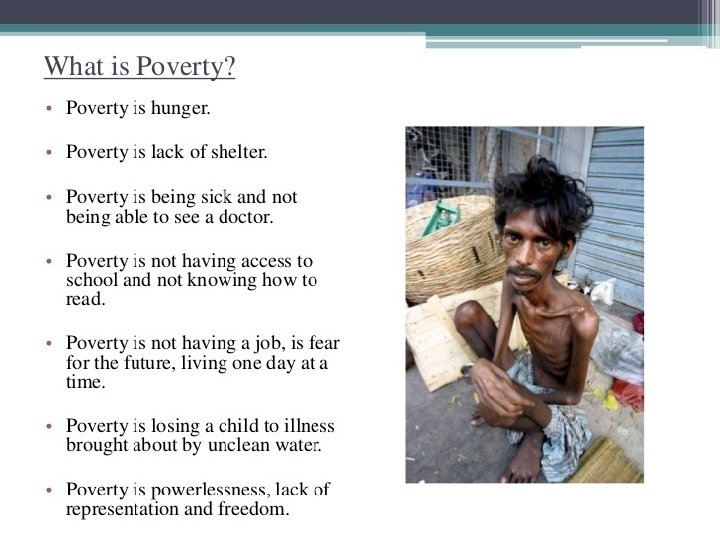
WHO ARE THE POOR?

FOOD D O O F CCLLOOTT H HIIN NG G MINIMUM REQUIREMENTS G G N I S S U U HO HO HEA LTH

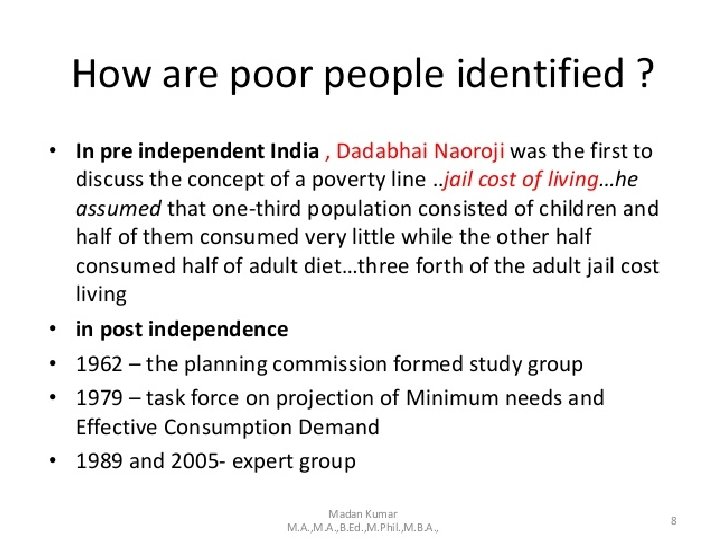
How are poor people Identified Categories of poor people 1. Absolutely poor 2. Very Poor 3. poor 4. Not so poor 5. Middle Class 6. Upper Middle class 7. The Rich 8. The very Rich

Aggregate category of poor People 1. Chronic Poor 2. Transient Poor 3. Never Poor Two categories – always poor, usually poor – BPL people. Eg. Casual workers, landless workers Two kinds- Churning poor & Occasionally poor Churning poor – they move in & out of poverty eg. Small farmer , seasonal workers. Occasionally poor – eg. People who gamble. Eg. Doctors, Lawers, Professionals, etc.

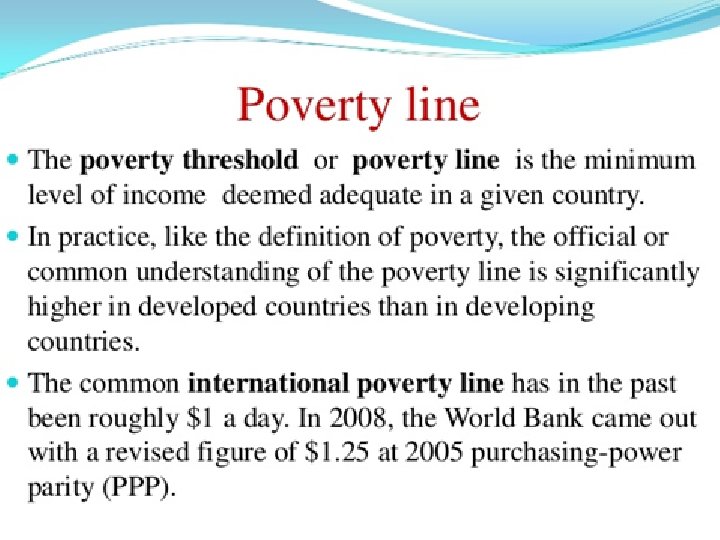
Chart : Three categories of poverty Poverty Line Always poor Usually poor Churning poor Occasionally Never Poor poor Poverty Line : Those who do not get nutrients requirements of 2400 calories person per day for rural area & 2100 calories person per day for urban areas are below the poverty line.
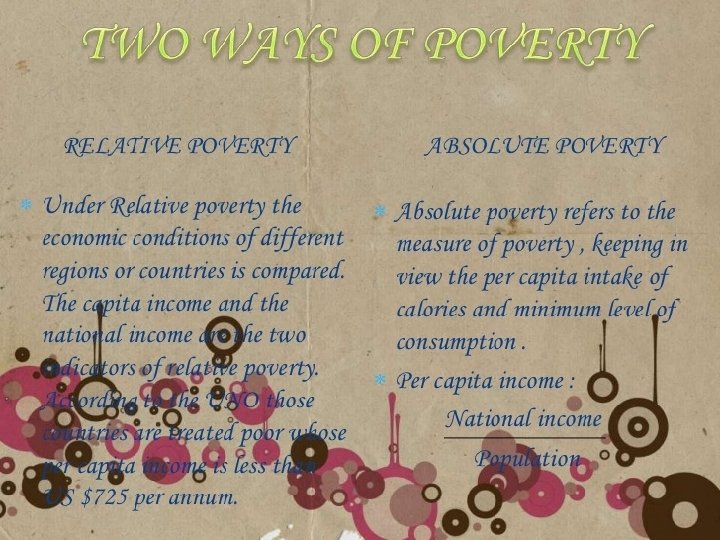

Types of Poverty RELATIVE POVERTY COUNTRIES PER CAPITA INCOME USA $ 34870 JAPAN $ 35993 SWITZERLAND $ 36970 PAKISTAN $ 430 INDIA $330

ABSOLUTE POVERTY Urban areas—more than Rs 459 Rural areas----more than Rs 328 ---------------------------------------------- THE POVERTY LINE --------------------------------------------- Urban areas-----less than Rs 459 Rural areas-------less than Rs 328

Percentage of population below poverty line
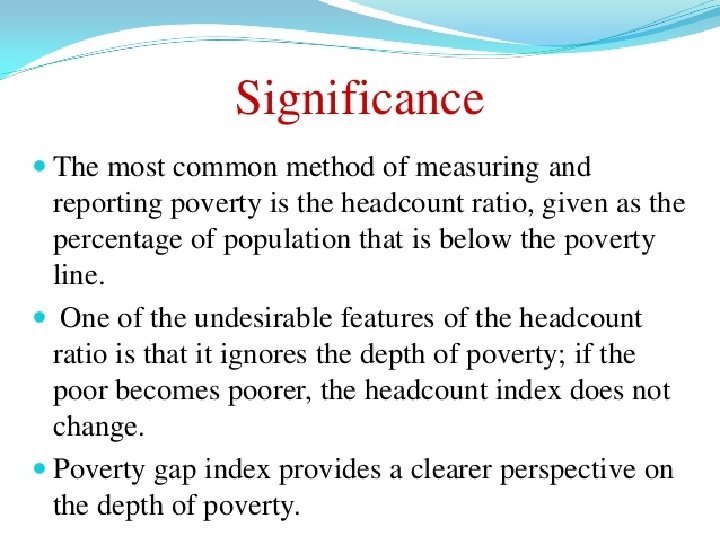

The official data on poverty is made available to the public by the Planning Commission. It is estimated on the basis of consumption expenditure data collected by the National Sample Survey Organisation (NSSO

Ø proportion to the population in India for the years 1973 -2000. In 1973 -74, more than 321 million people were below the poverty line. Ø In 1999 - 2000, this number has come down to about 260 million. In terms of proportion, in 1973 -74, about 55 per cent of the total population was below the poverty line. Ø In 1999 - 2000, it has fallen to 26 per cent. In 1973 -74, more than 80 per cent of the poor resided in rural areas and in 1999 -2000, this has come down to about 75 per cent. Ø This means that more than three-fourth of the poor in India reside in villages.

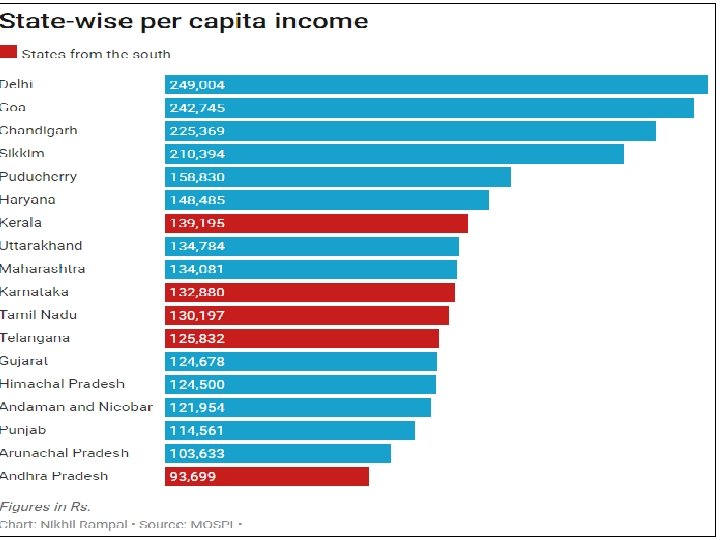
Population BPL in some states

Vicious circle of poverty Under development Low Productivity Capital deficiency Low real Income Low Investment Low Saving

Causes of Poverty 1. Pressure of population 2. Unemployment and underemployment 3. Outdated social institutions 4. Lack of infrastructure 5. Low per capita income 6. Dependence on agriculture

Removal of poverty 1. Modernise agriculture 2. Stabilize price level 3. Provide employment 4. Change in the technique of production 5. Provision of minimum needs of the poor 6. Focus on backward regions 7. Self employment
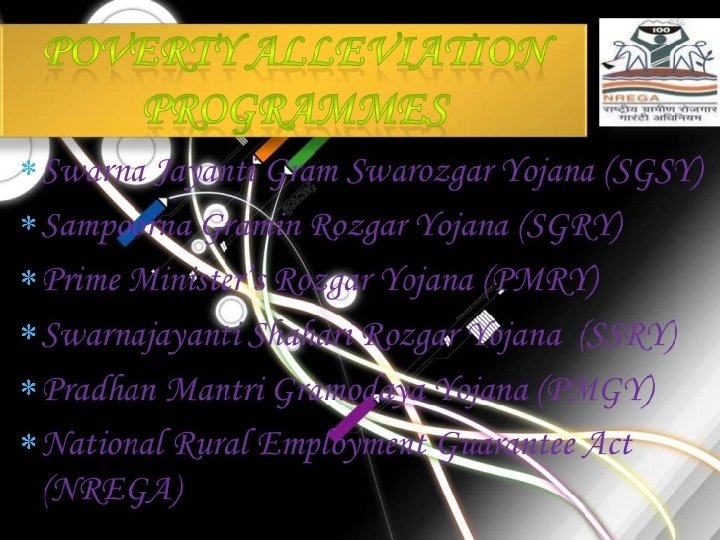

SGSY

SGRY

BIJU PM PGT ECONOMICS KV 2, KOCHI
- Slides: 32