BIJU P M PGT ECONOMICS KV 2 KOCHI

BIJU P M PGT ECONOMICS KV 2, KOCHI

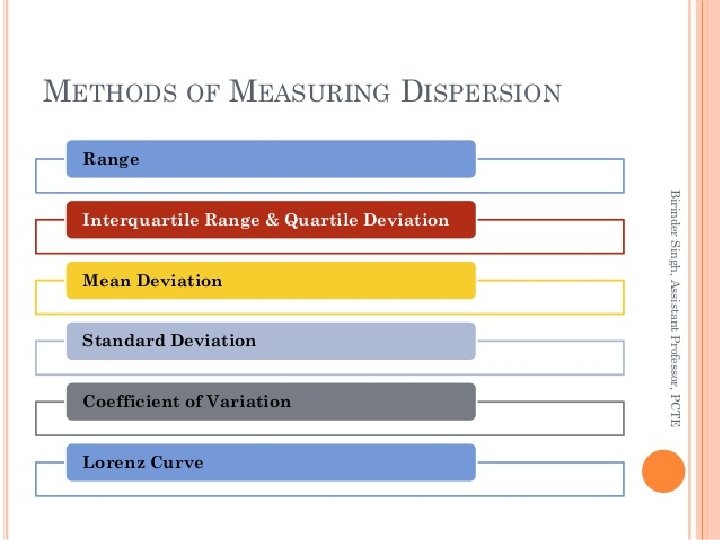
Types of Measures of Dispersion Absolute Measure The measures of dispersion which are expressed in terms of the original units of a series are known as absolute measures. 1. Range 2. Quartile Deviation 3. Mean Deviation 4. Standard deviation Relative Measures of dispersion also known as co - efficient of dispersion are obtained as ratios or percentages. 1. Co-efficient Range 2. Co-efficient Quartile Deviation 3. Co-efficient Mean Deviation 4. Co-efficient Standard deviation
 Range : Range is the simplest of all the measures of dispersion. It")
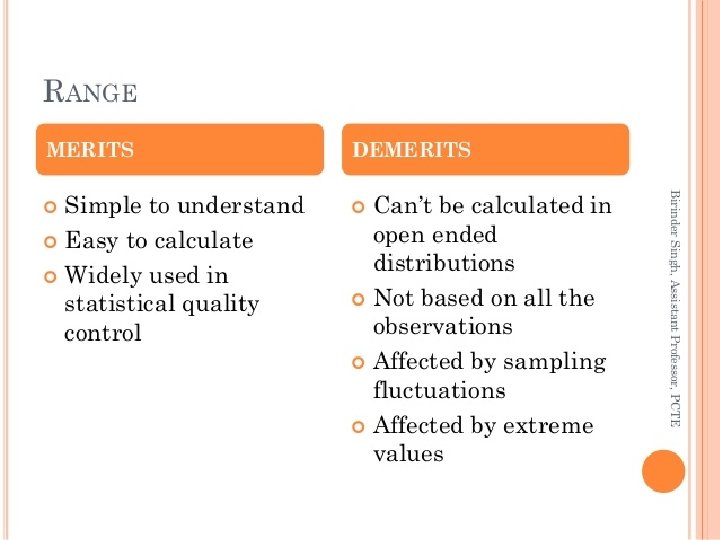
(I) Range : Range is the simplest of all the measures of dispersion. It is defined as the difference between observation i. e. the largest and the smallest value. Range = L – S Co-efficient of Range = Largest item of the series. S =Smallest item or value. L - S _____ L + S

Calculation of Range In Individual Series Example : Calculate the range and its coefficient from the data given below : Marks scored : 100, 160, 200, 165, 170, 180, 140, 150. Solution : R= L - S Therefore : R = 200 – 100 so, Range will be = 100 Co – efficient of Range = 200 - 100 L-S _______ = 200 + 100 L+S = ____ 100 300 = 0. 33 co efficient of Range

Calculation of Range In Discrete Series Example : Calculate the range and its co-efficient from the data given- Marks No. of students 25 4 30 8 35 10 60 6 75 3 Solution : R= L - S Therefore : R = 75 – 25 so, Range will be = 50 Co – efficient of Range = 75 - 25 L-S _______ = 75 + 25 L+S = ____ 50 100 = 0. 5 co efficient of Range

Calculation of Range In continuous Series Example : Calculate the range and its co-efficient from the data given- Wages No. of workers 50 -60 7 60 -70 9 70 -80 18 80 -90 13 90 -100 19 Solution : R= L - S Therefore : R = 100 – 50 so, Range will be = 50 Co – efficient of Range = 100 - 50 L-S _______ = 100 + 50 L+S = ____ 50 150 = 0. 33 co efficient of Range

Calculation of Range In Inclusive Series Size frequency 0. 5 -5. 5 5 5. 5 -10. 5 12 10. 5 -15. 5 20 15. 5 -20. 5 25 29. 5 -25. 5 10 25. 5 -30. 5 5 Example : Calculate the range and its co-efficient from the data given. First of all convert the inclusive series Into exclusive one. Co – efficient of Range = L-S Size Frequency 1 -5 5 6 -10 12 11 -15 20 16 -20 25 21 -25 10 26 -30 5 Therefore : R = 30. 5 – 0. 5 so, Range will be = 30 30. 5 – 0. 5 L-S _______ = 30. 5+ 0. 5 L+S = ___ 30 31 = 0. 97 co efficient of Range
 Inter quartile Range : Inter quartile Range is the difference Between upper quartile")
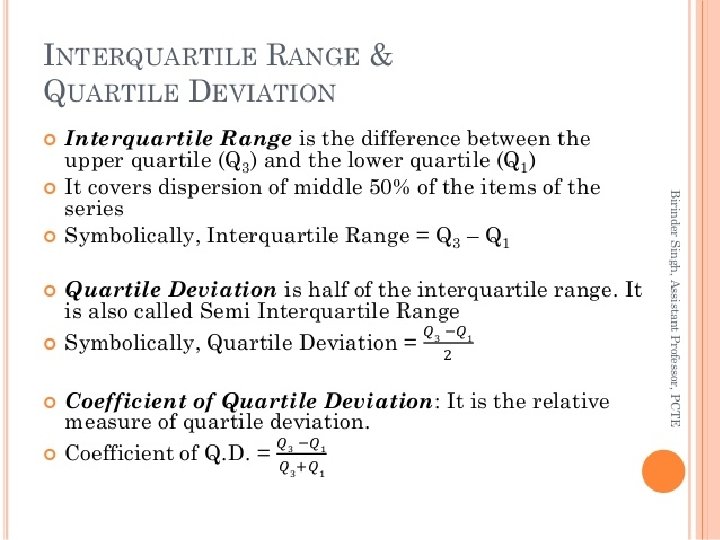
(II) Inter quartile Range : Inter quartile Range is the difference Between upper quartile and lower quartile. Steps : 1. Arrange the data either in a ascending or descending order. 2. Calculate the value of Third quartile ( Q 3 ) 3. Calculate the value of first quartile ( Q 1 ) 4. Apply the following formula : Inter Quartile Range = Q 3 – Q 1 Where Q 3 – Third quartile Or Upper quartile Q 1 – First quartile OR Lower Quartile
 Calculation of Inter quartile Range in Individual Series : Example : calculate Interquartile")
(II) Calculation of Inter quartile Range in Individual Series : Example : calculate Interquartile Range of the following : Marks 10 12 14 16 18 20 22
 Calculation of Inter - quartile Range in Individual Series : Calculation of Q")
(II) Calculation of Inter - quartile Range in Individual Series : Calculation of Q 1 & Q 3 1. Q 1 = size of S. No. Marks 1 10 2 12 Q 1 3 14 4 16 5 18 6 20 Q 3 7 22 N+1 ____ 4 th item th ____ 7+1 4 item = size of 2 th item = 12 Therefore Q 1 = 12 Q 3 = size of N+1 3 ____ 4 7 +1 3 ____ 4 th item = size of 6 th item its value is 20 = Q 3 = 20 Therefore Inter- Quartile Range = Q 3 – Q 1 = 20 – 12 = 8 Ans
 Calculation of Inter - quartile Range in Discrete Series : Example : Find")
(II) Calculation of Inter - quartile Range in Discrete Series : Example : Find out Inter-quartile Range of the following : Size Frequency 7 2 14 3 21 4 28 5 35 3 42 2
 Calculation of Inter - quartile Range in discrete Series : Calculation of Q")
(II) Calculation of Inter - quartile Range in discrete Series : Calculation of Q 1 & Q 3 1. Q 1 = size of Size F C. F 7 2 2 14 3 5 Q 1 21 4 9 28 5 14 35 3 17 Q 3 42 2 19 N+1 ____ 4 ____ 19+1 4 th item = size of 5 th item lies in 5 c. f where Size is =14 Therefore Q 1 = 14 N+1 Q 3 = size of 3 ____ 4 th item +1 = size of 3 19 ____ th item 4 = size of 15 th item it lies in 17 c. f. whose size is 35 = Q 3 = 35 Therefore Inter- Quartile Range = Q 3 – Q 1 = 35 – 14 = 21 Ans
 Calculation of Inter - quartile Range in Continuous Series : Example : Find")
(II) Calculation of Inter - quartile Range in Continuous Series : Example : Find out Inter-quartile Range of the following : Marks No. of students 0 -10 10 10 -20 15 20 -30 20 30 -40 10 40 -50 5

Calculation of Inter - quartile Range in Continuous Series : Solution 1. Q 1 Marks No. of students c. f 0 -10 10 -20 15 25 Q 1 20 -30 20 45 30 -40 10 55 40 -50 5 60 N=60 = size of __ N 4 __ 60 4 th th item = size of 15 th item lies in 25 c. f. whose marks group is 10 – 20 group - Q 1 is 15 i __ (Q 1 – C) Therefore Q 1 = L 1 + f 10 ___ (15 – 10) = Q 1 = 10 + 15 = 10 + 3. 33 = 13. 33

Calculation of Inter - quartile Range in Continuous Series : Solution Marks No. of students 0 -10 10 10 -20 15 20 -30 20 30 -40 10 40 -50 5 N=60 Q 3 = size of 3 __ N 4 th item __ th 60 = size of 3 item 4 = size of 45 th item lies in c. f. 45 whose marks group is c. f 20 – 30 group i __ (Q 3 – C) 10 L 1 + Therefore Q 3 = f 25 10 __ (45 – 25) 45 Q 3 = 20 + 20 55 10 200 ___ 60 = 20 + __ x 20 = 20 + 20 20 = 20 + 10 = 30 Therefore Inter quartile Range = Q 3 – Q 1 = 30 – 13. 33 = 16. 67
 Quartile Deviation OR Semi-Quartile Range Quartile deviation is known as half of difference")
(III) Quartile Deviation OR Semi-Quartile Range Quartile deviation is known as half of difference of third quartile(Q 3) & first quartile(Q 1) Find the value of Third quartile ( Q 3 ) Find the value of first quartile ( Q 1 ) Apply the following formula : Q 3 – Q 1 Quartile Deviation = _______ 2 Q______ 3 - Q 1 Co-efficient of QD : Q 3 + Q 1

Calculation of Quartile Deviation in Individual Series : Example : Calculate quartile Deviation and its coefficient from the following data : Value 120 140 160 180 200 220 240

Calculation of Quartile Deviation in Individual Series : Calculation of Q 1 & Q 3 1. Q 1 = size of S. No. Value 1 120 2 140 Q 1 3 160 4 180 5 200 6 220 Q 3 7 240 N+1 ____ 4 ____ 7+1 4 th item = size of 2 th item = 140 Therefore Q 1 = 140 Q 3 = size of N+1 3 ____ 4 th item 7 +1 3 ____ th item 4 = size of 6 th item its value is 220 = Q 3 = 220 Therefore Q 3 - Q 1 Quartile Deviation = _____ 2 -Q 1 220 -140 _____ Co. eficient of QD = Q 3 = _______ 220 +140 Q 3 +Q 1 = size of 80 = 0. 22 __ = 360

Calculation of Quartile Deviation in Discrete Series : Example : Find out quartile Deviation and its coefficient fro the following data : Wages No. of workers 40 20 50 25 60 15 70 20 80 13 90 6

Calculation of Quartile Deviation in discrete Series : Calculation of Q 1 & Q 3 1. Q 1 = size of wages F (No. of worker) C. F 40 20 20 50 25 45 Q 1 60 15 60 70 20 80 Q 3 80 13 93 90 6 99 C. QD = N+1 ____ 4 ____ 99+1 4 th item = size of 25 th item lies in 45 c. f where Size is =50 Therefore Q 1 = 50 N+1 Q 3 = size of 3 ____ 4 = size of 3 99 ____ +1 4 th item = size of 75 th item it lies in 80 c. f. whose size of item is 70 = Q 3 = 70 Therefore 20 ____ __ = 10 Q 3 _____ –Q 1 = 70 -50 = QD = 2 2 2 Q 3 -Q 1 _____ 70 --50 20 = _____ = 0. 167 Q 3 +Q 1 70+50 120

Calculation of Quartile Deviation in Continuous Series : Example : Calculate Quartile Deviation and its coefficient from the following data: Variable frequency 20 -30 4 30 -40 6 40 -50 8 50 -60 6 60 -70 4

Calculation of Quartile Deviation in Continuous Series : Solution 1. Q 1 Variable F c. f 20 -30 4 4 C 30 -40 6 10 Q 1 40 -50 8 18 50 -60 6 24 60 -70 4 28 N=28 = size of __ N 4 __ 28 4 th th item = size of 7 th item lies in 10 c. f. whose marks group is 30 – 40 group. i __ (Q 1 – C) Therefore Q 1 = L 1 + f 10 ___ (7 – 4) = Q 1 = 30 + 6 10 = 30 + __ X 3 6 = 10 + 5 Q 1 = 35

Calculation of Quartile Deviation in Continuous Series : Solution Variable F 20 -30 4 30 -40 6 40 -50 8 50 -60 6 60 -70 4 N=28 Q 3 = size of 3 __ N 4 th item 28 th = size of 3 __ item 4 = size of 21 th item lies in c. f. 24 whose marks group is c. f 50 – 60 group i 4 __ (Q 3 – C) L 1 + Therefore Q 3 = 10 f 10 18 C __ (21 – 18) = Q 3 = 50 + 6 24 Q 3 = 50 + 10 __ x 3 28 6 = 50+5 = Q 3= 55 55 -35 ____ Q ____ 3 – Q 1 QD = = 2 2 Q 3 –Q 1 55 – 35 20 Co. f. QD. = _____ __ = 0. 22 = = Q 3 +Q 1 55 + 35 90

BIJU P M PGT ECONOMICS KV 2 , KOCHI
- Slides: 30