
BIHAR ANIMAL SCIENCES UNIVERSITY PATNA BIHAR Bihar Veterinary
BIHAR ANIMAL SCIENCES UNIVERSITY, PATNA, BIHAR Bihar Veterinary College, Patna UNIT-I Introduction to Presentation of Data Speaker: Ramesh Kumar Singh Assistant Professor cum Jr. Scientist Division of Animal Genetics and Breeding Bihar Veterinary College, Patna
Introduction • Since most data are available to researchers in a raw format, they must be summarized, organized, and analysed to usefully derive information from them. • Furthermore, each data set needs to be presented in a certain way depending on what it is used for. • Planning how the data will be presented is essential before appropriately processing raw data. • First, a question for which an answer is desired must be clearly defined. • A well-defined question is crucial for the data to be well-understood later. Once a detailed question is ready, the raw data must be prepared before processing.
Data Presentation • Data can be presented in one of the three ways: – as text – in tabular form – in graphical form • Methods of presentation must be determined according to the data format, the method of analysis to be used, and the information to be emphasized.
Text presentation • Text is the main method of conveying information as it is used to explain results and trends, and provide contextual information. • Data are fundamentally presented in paragraphs or sentences. • Text can be used to provide interpretation or emphasize certain data. • If quantitative information to be conveyed consists of one or two numbers, it is more appropriate to use written language than tables or graphs.
Contd… • If more data are to be presented, or other information such as that regarding data trends are to be conveyed, a table or a graph would be more appropriate. • By nature, data take longer to read when presented as texts. • when the main text includes a long list of information, readers and reviewers may have difficulties in understanding the information.
Diagrammatic and Graphic Representation • The classification and tabulation are the devices of presenting the statistical data in neat, concise, systematic and readily comprehensible and intelligible form thus highlighting the salient features. • Diagrammatic and graphic representation is an another important, convincing, appealing and easily understandable form of data presentation which have a number of advantages.
Advantages • Diagrams and graphs are visual aid which present the data in simple and readily comprehensible form. If properly constructed, if highlight hidden fact of data otherwise if might have been lost. • Diagrams are very attractive as they delight the eyes and appeal to mind and leave long lasting impression to mind of people in general. • They are early intelligible • They are highly impressive • They are easily comparable • They consume less time and energy • They are very much helpful in various types of studies.
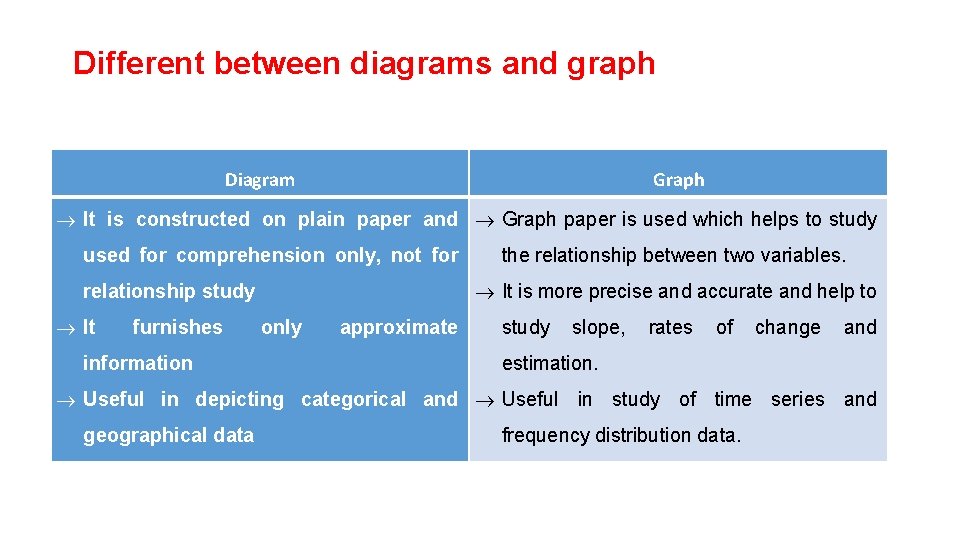
Different between diagrams and graph Diagram Graph It is constructed on plain paper and Graph paper is used which helps to study used for comprehension only, not for It is more precise and accurate and help to relationship study It furnishes information the relationship between two variables. only approximate study slope, rates of change and estimation. Useful in depicting categorical and Useful in study of time series and geographical data frequency distribution data.
General rules for constructing the diagrams Ø It should have neatness in clarity. ØIt should have title & foot note. ØSelection of scale should be appropriate. ØProportion between width and height should be maintained ØDiagram should be selected with almost care. ØIt should have source note and number ØIt should have index also. ØIt should be simple.
Types of diagram – it is of following types (1) One dimensional Eq. Line diagram & Bar diagram (2) Two dimensional Eq. Rectangles, Squares, Pie-chart (3) Three dimensional Eq. Cubes, Spheres, Cylinder etc. (4) Pictograms (5) Cartograms
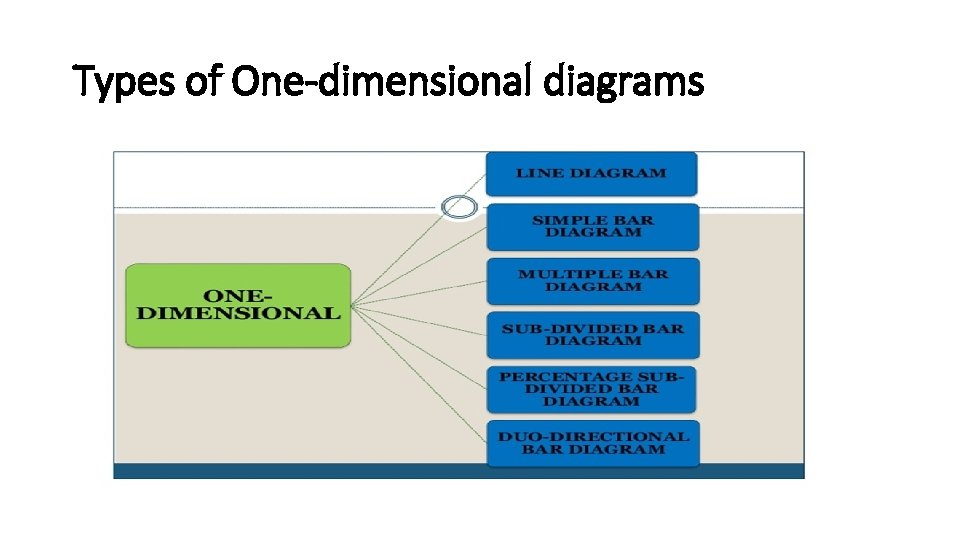
Types of One-dimensional diagrams

Thanking You
- Slides: 12