Big Data Enables Student Retention Student Success SAP

Big Data Enables Student Retention: Student Success & SAP HANA CON F IDEN TIAL James David Hardison, DMD, MBA Vince Kellen, Ph. D. Industry Principal, Higher Education Senior Vice Provost Academic Plann Analytics and Technologies

Key Learning Objectives Introduction SAP HANA Overview Applications of HANA in Higher Education

© 2013 SAP AG. All rights reserved. 3

What if you could… ? ? ? Manage Large Data Volumes Cost Effectively Have Immediate Answers to Any Question Always Have Current & Complete Information © 2013 SAP AG. All rights reserved. 4

Why Is This So Hard? 30 Year-Old Database Design Principles Slow Disks & CPUs I/O Bottleneck Expensive Memory Optimized for Transactions BI is an Afterthought © 2013 SAP AG. All rights reserved. 5

© 2013 SAP AG. All rights reserved. 6

Key Learning Objectives Introduction SAP HANA Overview Applications of HANA in Higher Education
 A next-generation platform. . . that can process")
SAP HANA (High Performance ANalytic Appliance) A next-generation platform. . . that can process and analyze … structured and unstructured data … providing insight into the lowest level of detail … with a quick time to value … and the ability to ask more questions to drive informed decisions. © 2013 SAP AG. All rights reserved. 8

More than just a database… Real-time analytics Real-time apps SAP HANA Info Composer & Modeling Studio Application Services Text Search Planning and Calculation Engine Predictive & Business Libraries R & Hadoop Integration Columnar Storage In-memory Database Row Storage Spatial Engine SAP Business Suite © 2013 SAP AG. All rights reserved. Third-party systems 9

Key Learning Objectives Introduction SAP HANA Overview Applications of HANA in Higher Education

HANA for Higher Education through University Alliances § SAP donates licenses to more than 1300 universities and provides materials for professors § 1. 2 M Students educated on HANA § Students can access online courses and SAP Certifications § Members can take part in our competitions and contests, send students to our Innojams, Codejams and Design Thinking events, get involved with our Co-Innovation projects or research and the development of new SAP solutions © 2013 SAP AG. All rights reserved. 11

What is the difference between how did students do and how are they doing? © 2013 SAP AG. All rights reserved. © SAP AG 2010. All rights reserved. / Page 12 12

Newton’s First Law of Motion An object at rest stays at rest, and an object in motion stays in motion with the same speed and in the same direction unless acted upon by an unbalanced force. Application: Students at risk are not likely to change their behavior (their trajectory) without intervention. © 2013 SAP AG. All rights reserved. 13

Newton’s Second Law of Motion The acceleration of an object as produced by a net force is directly proportional to the magnitude of the net force, in the same direction as the net force, and inversely proportional to the mass of the object. Application: The earlier intervention occurs, the easier it should be. © 2013 SAP AG. All rights reserved. 14

We need a change "If you always do what you always did, you will always get what you always got. " - Tony Robbins - Moms Mabley (other sources cite Henry Ford and Mark Twain) © 2013 SAP AG. All rights reserved. 15
 Vince Kellen, Ph. D.")
Using Fast Analytics to Help Improve Student Retention (and more) Vince Kellen, Ph. D. Senior Vice Provost Academic Planning, Analytics and Technologies University of Kentucky vkellen@uky. edu October, 2013

What we have done and what we would like to do n First steps over the past year • Mobile micro-surveys: Learning from the learner • Student enrollment, retention, demographics, performance, K-Score, facilities utilization, instructor workload and more • High speed, in-memory analytics architectural differences • Open data and organizational considerations n Coming down the road? • Micro-segmentation tool to enhance user and IT productivity, develop personalized mobile student interaction/intervention • Models for learner technographics, psychographics, in addition to behaviors, performance, background • Advanced way-finding for streaming content like lecture capture • Content metadata extraction and learner knowledge discovery • Real-time measures of concept engagement and mastery • Real-time learner recommendations and support engine • Use graphing algorithms to perform more sophisticated degree audit what ifs 17

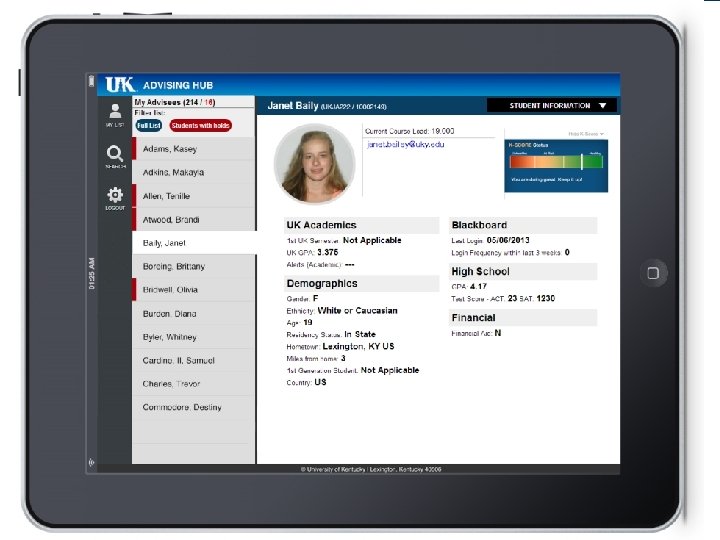
Model Description Enrollment in a class, midterm and final grades, credit hours attempted and earned, instructor teaching the class Student retention and graduation Student demographics and cohort identification (e. g. , John Doe is in the 2009 entering first-year student cohort) Student demographics Demographics, such as age, high school GPA, entrance test scores (SAT, ACT) and subcomponent scores. Also, in a secure location, additional personally identifiable demographic details such as name, address, email, etc. Student performance Present the enrollment data in such a way as to easily show the student’s performance for each term, including credit hours earned, term GPA, cumulative GPA for that term, etc. Student academic career Keep a list of the majors and minors for each student and degrees awarded. Also, include details on students who transfer in and out, including transfer institution, credit hours transferred in, etc. Productivity The room utilization model contains every building, every potential classroom and lets users analyze the room capacity and enrollments for the class or event in the room at five minute intervals. The faculty stats per term model pulls together the number of students and sections taught per term and will contain other important data such as research expenditures per term and grant proposals submitted and won. Micro-surveys Capture questions and answers from the My UK Mobile micro-survey feature Student involvement Interaction history with various applications including the learning management system, clickers, course capture and playback, academic alerts. Provide the basis for calculating the student’s K-Score. 18

19

20

21

22

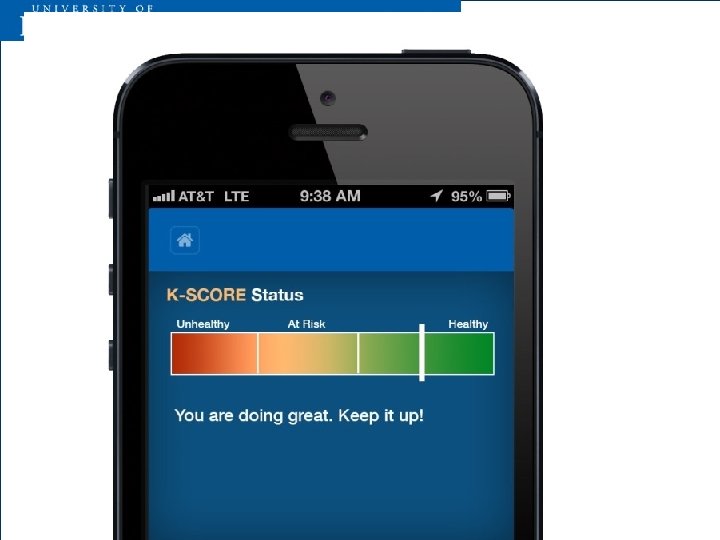
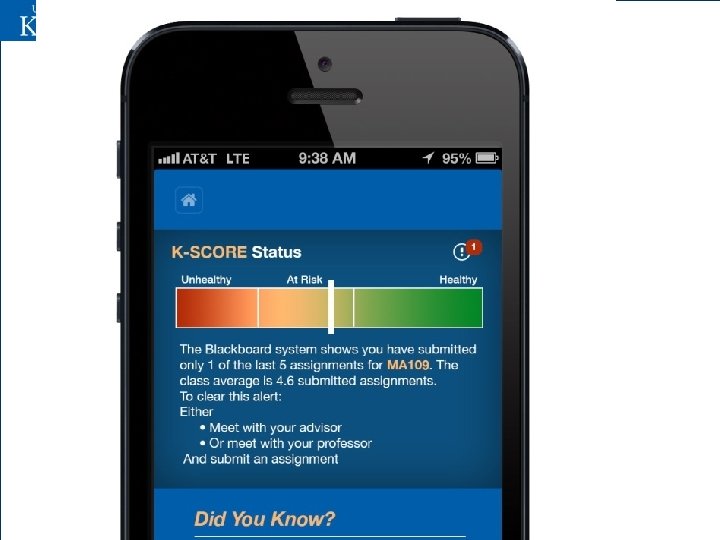
Academic Health Notifications: View in student mobile app

26

WAKE UP! GET TO CLASS! n Who sets alarms for themselves? n Why not automatically set alarms for students around their schedule? n Why not have automated wake-up calls? n Why not suggest wake up times based on class attendance? n Why not consider manipulation of reminders as a form of engagement? n Can we ascertain student prospective memory capability and personalize based on it? 28

Déjà vu? MOOCs Large lectures PHI 698 ? ? ? http: //www. thelongtail. com/conceptual. jpg 29

Taxonomy? Automatic metadata? Automatic atomic metadata? n Let learners navigate an audio/visual stream n Let the system learn what are top terms. Let the system map terms to concepts. Let instructional designers lightly ‘bump’ the taxonomy, post production n Record student engagement with specific terms / concepts See http: //p. uky. edu n Deliver personalized messages to students 30

31

University of Kentucky

Class slides take a central position. The audio/video and slide content is synchronized.

The note pad allows recording and sharing of notes.

Personalized recommendations are a guide thru the material. Feedback on engagement and mastery assist in gauging understanding. Resources and tutors are also provided if a little assistance is needed.

A lecture concept map helps to put the lecture in a visual context. The map is generated from analysis of the text and ‘bumped’ into shape by a course designer or instructor. Concepts can be rated to collect perception of usefulness and improve future versions. Jump to the media segment by clicking on the tag. Test knowledge with small quizzes – ace the quizzes and you’re in good shape!

A one-stop-shop for searching. Keywords from the video, slides, trends, notes and conversations will appear.

Key questions • Can the audio and slides be reliably transcribed into ‘useful’ text? • Can a concept map be derived automatically from the text generated or easily edited by an instructor? • How easy will it be for designers-instructors to create a quiz and place it in the right location in the video? • Can we personalize the recommendations to reflect prior knowledge, student ability and individual differences in information processing? • Can the interface support real-time integration with analytic backends (e. g. , HANA)? This is just one conceptualization. What other interface designs exist today? How effective are they?

University of Kentucky

Organizational considerations n Integrated IR and BI teams. Added three Ph. D. level data scientists. Had some turnover. n Translated all old architectures to HANA and retiring old IR data warehouse. Making everything ‘automatic’ like IPEDS cohort determinations, enrollment reporting. Moving as much as possible to self-service. Agnostic on the front end tools. n Opened data. Many have access. Personal data is protected. Established a data community of practice. Used an ‘always beta’ mode of development. Measuring data quality. Providing data quality process improvements to the teams. n Started to raise skill sets in colleges and units. Provide support. Encourage ad-hoc learning opportunities. Help units with job descriptions and selection of talent. 40

Be safe and secure. Respect the acceptable use of information policies and guidelines the university has in place. Please have good passwords and secure your laptop, desktop and other devices appropriately. Treat private student and UK information appropriately Be collegial. University data is a community asset and a community of people steward the data. Use and share the data with the best interests of the university community in mind. Since parts of our data analysis environment is designed to allow for greater transparency, analysis will potentially be able to see other unit data. While we will make private to a unit what absolutely needs to be private, the way the university runs it's business often involves multiple colleges and units at the same time. Don't use your access to take unfair advantage of another unit. Help improve data quality. If you see data that doesn't appear to be correct, let someone know. We have a team of staff dedicated to helping improve data quality. This team can work with colleges and units on any data entry and data management processes that might need to be changed to improve data quality. Be open-minded and inquisitive. Data can be represented in multiple ways at the same time. While the teams are taking great care to enable multiple views of the data to support the community, you might have a valid and unique perspective. In time, we can accommodate more ways of looking at the same data while not interfering with other views or taxonomies. Share. The main benefit from open analytics is the power of a community of analysts learning from each other rather than a few select individuals hoarding knowledge or access. As the community improves its knowledge and skill with the data, the university can improve accordingly.

Personalize learning and support in one architecture • Real-time personalized interactions • • • Target on-demand peer tutoring based on student’s profile Deliver micro-surveys and assessments to capture additional information needed to improve personalization Give students academic health indicators that tell students where they can improve in study, engagement, support, etc. Let students opt their parents in to this information so the family can support the student Tailor and target reminder services, avoid over messaging, enable timing of message delivery based on user temporal proclivities Allow for open personalized learning • • How content gets matched to students is psychologically complex Several theories of how humans learn give many insights Students differ in the following abilities and attributes: visual-object, visualspatial, reasoning, cognitive reflection, need for sensation, need for cognition, various verbal abilities, confidence, persistence, prospective memory, etc. We need an open architecture to promote rapid experimentation, testing and sharing of what works and what doesn’t University of Kentucky

How technology can help in student success High effectiveness MOOC + PT + F 2 F Small F 2 F class MOOC + PT Sc a le vs qu ali ty tra de of f Current MOOC approach Broadcast class Low effectiveness F 2 F = Face-to-face PT = Personalization technology, adaptive learning technology Low volume High volume 43

Questions? 44

Thank you! Please complete an evaluation n James David Hardison, DMD, MBA n Industry Principal, Higher Education n SAP America, Public Services n james. hardison@sap. com Vince Kellen, Ph. D. Senior Vice Provost Academic Planning, Analytics and Technologies University of Kentucky @vkellen
- Slides: 45