BIG DATA Basic Concepts Big Data Big Data

BIG DATA Basic Concepts

Big Data • Big Data defined as “data that becomes large enough that it cannot be processed using conventional methods. ” • Big data refers to datasets whose size is beyond the ability of typical database software tools to capture, store, manage, and analyze Data in many sectors today will range from a few dozen terabytes to multiple petabytes Big Data is data whose scale, diversity, and complexity require new architecture, techniques, algorithms, and analytics to manage it and extract value and hidden knowledge from it

The Model Has Changed… • The Model of Generating/Consuming Data has Changed Old Model: Few companies are generating data, all others are consuming data New Model: all of us are generating data, and all of us are consuming data 3

• The difference between “Old Big Data” and “New Big Data” is accessibility and use it to create value • technologies like Hadoop, for example, make it functionally practical to access a tremendous amount of data, and then extract value from it. • easier and more feasible to retrieve and process information • Allow to store more data, less expensive and faster hardware • ability to do real-time analysis on very complex sets of data and models Example: -insurance companies- able to predict (potentially available customer petabytes worth of data) As people age, what kinds of different services will they need from us?

Is Big Data analytics worth the effort? • Yes, without a doubt Big Data analytics is worth the effort. • It will be a competitive advantage, and it’s likely to play a key role in sorting winners from losers in an ultracompetitive global economy. Comparing traditional analytics to Big Data analytics • The differences in speed, scale, and complexity are tremendous • The universe of questions you can ask the database is extremely small. With Big Data analytics, that universe is vastly larger • The real challenge is identifying or developing most cost-effective and reliable methods for extracting value from all the terabytes and petabytes of data now available

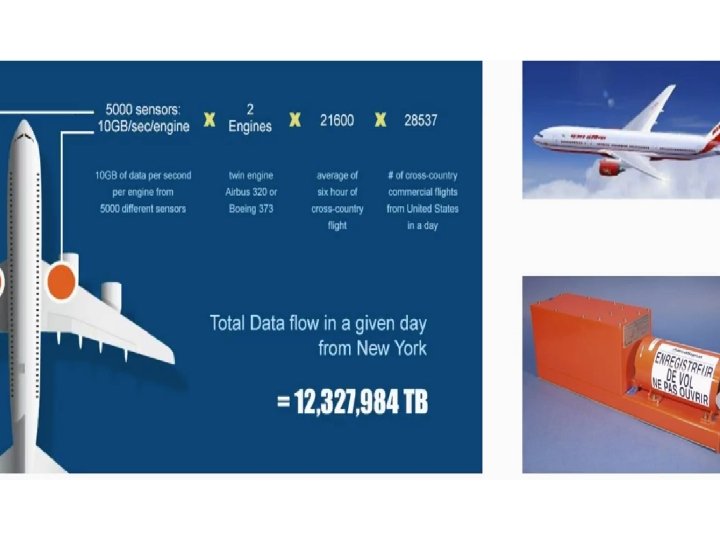
Examples of Big data


3 main dimensions of Big. Data
 Who’s Generating Big Data? Social media and networks (all of us")
1 -Complexity (Volume) Who’s Generating Big Data? Social media and networks (all of us are generating data) Scientific instruments (collecting all sorts of data) Mobile devices (tracking all objects all the time) Sensor technology and networks (measuring all kinds of data) 10

Face. Book in 30 minutes

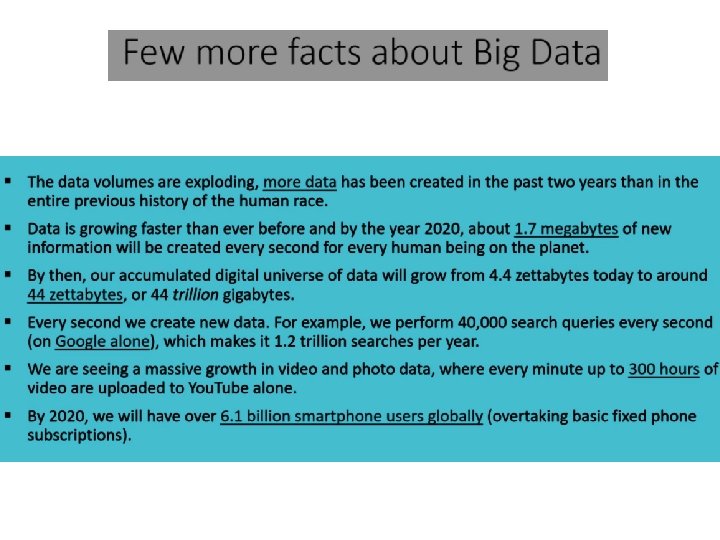
Other examples of big data

Types of data Structured Data They have predefined data model and fit into relational database. (i. e. , character, numeric, floating point, etc. ) Semi-structured data These are data that do not fit into a formal structure of data models. – Semi-structured data is often a combination of different types of data that has some pattern or structure that is not as strictly defined as structured data. – Semi-structured data contain tags that separate semantic elements which includes the capability to enforce hierarchies within the data. Example: XML Unstructured data Do not have a predefined data model and /or do not fit into a relational database. – Oftentimes, text, audio, video, image, geospatial, and Internet data (including click streams and log files) are considered unstructured data.
 is")
Why bother about Unstructured data? - The amount of data (all data, everywhere) is doubling every two years. - The world is becoming more transparent. Everyone is accepting this and people don’t mind parting with data that is considered private. - Most new data is unstructured. Specifically, unstructured data represents almost 95 percent of new data, while structured data represents only 5 percent. - Unstructured data tends to grow exponentially, unlike structured data, which tends to grow in a more linear fashion. - Unstructured data is vastly underutilized.

• The progress and innovation is no longer hindered by the ability to collect data • But, by the ability to manage, analyze, summarize, visualize, and discover knowledge from the collected data in a timely manner and in a scalable fashion
 • Various formats, types, and structures • Text, numerical, images, audio,")
2 -Complexity (Variety) • Various formats, types, and structures • Text, numerical, images, audio, video, sequences, time series, social media data, multi-dim arrays, etc… • Static data vs. streaming data • A single application can be generating/collecting many types of data To extract knowledge all these types of data need to linked together 17
 • Data is begin generated fast and need to")
3 rd Dimension -Speed (Velocity) • Data is begin generated fast and need to be processed fast • Online Data Analytics • Late decisions missing opportunities • Examples – E-Promotions: Based on your current location, your purchase history, what you like send promotions right now for store next to you – Healthcare monitoring: sensors monitoring your activities and body any abnormal measurements require immediate reaction

Analytics • Analytics is the discovery, interpretation, and communication of meaningful patterns in data. Especially valuable in areas rich with recorded information, analytics relies on the simultaneous application of statistics, computer programming and operations research to quantify performance. • Analytics is the systematic use of data and related business insights developed through applied analytical disciplines to drive fact-based decision making for planning, management, measurement and learning.

Why Big Data Analytics? ? Ø Use Big data analytics to drive value for Business enterprise that aligns with their core competencies and creates a competitive advantage for the enterprise Ø Capitalize new technology capabilities and leverage existing technology assets. Ø Enable appropriate organizational change to move towards fact-based decisions, adoption of new technologies, and uniting people from multiple disciplines into a single multidisciplinary team. Ø Deliver fast and superior results by embracing and capitalizing on the ever-increasing rate of change that is occurring in the global market place.

Analytics may be Descriptive Predictive and Prescriptive Descriptive –Post Mortem Analysis-What happened and why (business intelligence and data mining) Eg: Sales and Marketing , Finance Predictive –Futuristic (forecasting) What will happen Prescriptive -Combines Stats, Maths, OR and Computer Science and business rules to make predictions and suggest Decision options and show implications of each decision option

Descriptive analytics • The first stage of business analytics is descriptive analytics • Descriptive analytics answers the questions what happened and why did it happen. • It looks at past performance and understands that performance by mining historical data to look for the reasons behind past success or failure. • Most management reporting - such as sales, marketing, operations, and finance - uses this type of post-mortem analysis.

Predictive analytics • the next phase is predictive analytics. Predictive analytics answers the question what will happen. • This is when historical performance data is combined with rules, algorithms, and occasionally external data to determine the probable future outcome of an event or the likelihood of a situation occurring. • Encompasses statistical techniques for: – Data Modeling – Machine Learning – Data Mining • Analyzing current and historical facts to make predictions about the future An example is optimizing customer relationship management systems They can help an organization to analyze all customer data therefore exposing patterns that predict customer behavior to deliver a personalized experience

• • Prescriptive Analytics Prescriptive analytics is the third and final phase of business analytics which includes descriptive and predictive analytics. Prescriptive analytics automatically synthesizes big data, multiple disciplines of mathematical sciences and computational sciences, and business rules, to make predictions and then suggests decision options to take advantage of the predictions and showing the implications of each decision option. Prescriptive analytics not only anticipates what will happen and when it will happen, but also why it will happen and its effect

Prescriptive Analytics

Analytics Age • The “Analytics Age” has the potential to drive elusive top-line revenue for enterprises by – Reduce operation cost – Increases revenue to net substantial profit margins – The goal of Data Analytics (big and small) is to get actionable insights resulting in smarter decisions and better business outcomes

Advantages Improve Operational Efficiencies Increase Revenues Achieve Competitive Differentiation Reduce risks and costs Sell to microtrends Offer new services Save time Enable self service Seize market share Lower complexity Improve customer experience Incubate new ventures(risk but profit) Enable self service Detect fraud

Sectors benefiting from Big Data technologies: • Government: predict and plan for civil unrest • Health Care: data collection on patients, predict illness and help caregivers make better decisions • Farming: accurately forecast bad weather and crop failures • Science & Research: drive innovation • Enterprises and Businesses: make better business and marketing decision

Example Analytics Application
- Slides: 29