Biet Qad Village Climate 30 Temperature c 25


Biet Qad Village
 25 20 15 10 5 0 1996 1998 2000 2002")
Climate 30 Temperature (°c) 25 20 15 10 5 0 1996 1998 2000 2002 2004 Time (year) 2006 2008 2010 2012
 50 40 30 20 10 0 1995")
Relative Humidity 80 70 60 RH (%) 50 40 30 20 10 0 1995 1997 1999 2001 2003 Time (year) 2005 2007 2009 2011

Evaporation evaporation quantities Evaporation mm/y 2500 2000 1500 1000 500 0 1995 1997 1999 2001 2003 Time (year) 2005 2007 2009 2011

Water Distribution Network �Importance of the system: 1. Save People Time & Effort. 2. Grantee Water Quality.

Design inputs : �Watercad is the programme used in design. � population is Predicted depending on the available space for that village after 30 years and found to be 7000 capita �Water consumption rate is 100 l/c. day but if we take into consideration annual increase of about 1. 5 l/c. day then it is common sense to use 120 l/c. d for design process. �Load is distributed on junctions using Thissen polygon method.

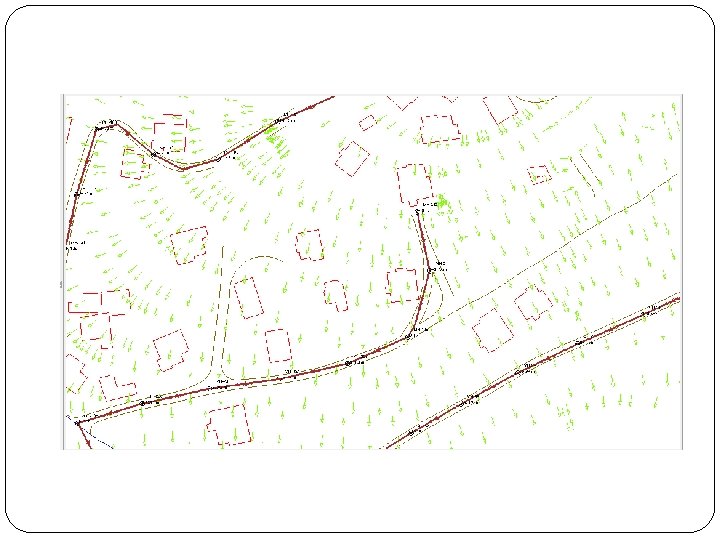
Procedure � Building model procedure 1. Determining the area that we want to serve which can be obtained from the master plan. 2. Importing Auto. CAD files as a separate layers in Water Cad which includes (Buildings, Roads, Contours and Service area) layers. .

Importing layers

3. Start drawing pipes and junctions on the network. 4. Estimating water consumption and population for that village after 30 years. This is found to be 120 and 7000 respectively. 5. Calculating the area of the service area and defining the total daily demand for that area using GIS. 6. Using load builder to assign water demand to the network

7. Using one of watercad features which is called Theissen polygon to distribute this demand on junctions proportionally with area served by each junction.
 standards.")
8. Entering the load pattern values as Palestinian Water Authority (PAW) standards.

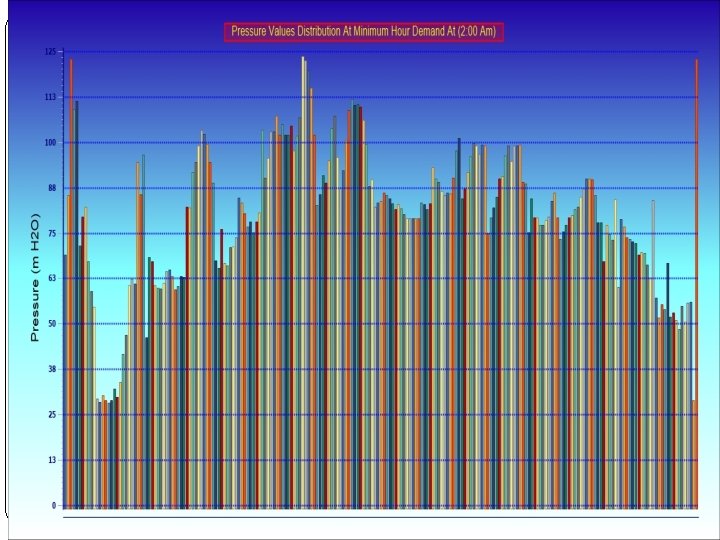
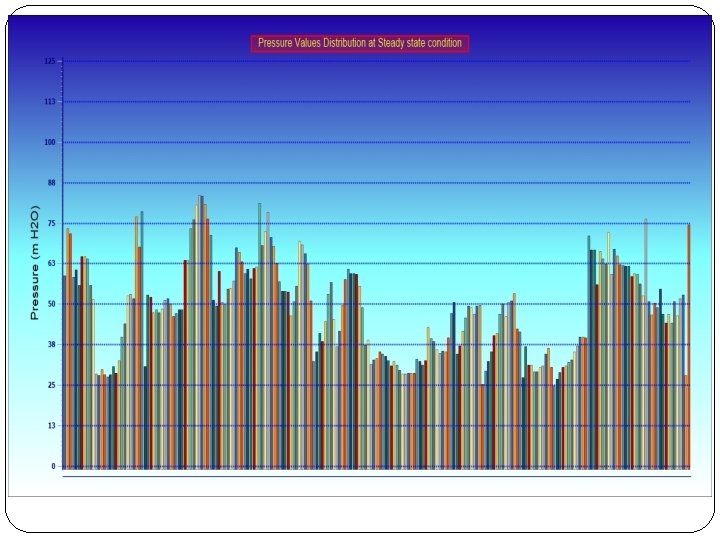
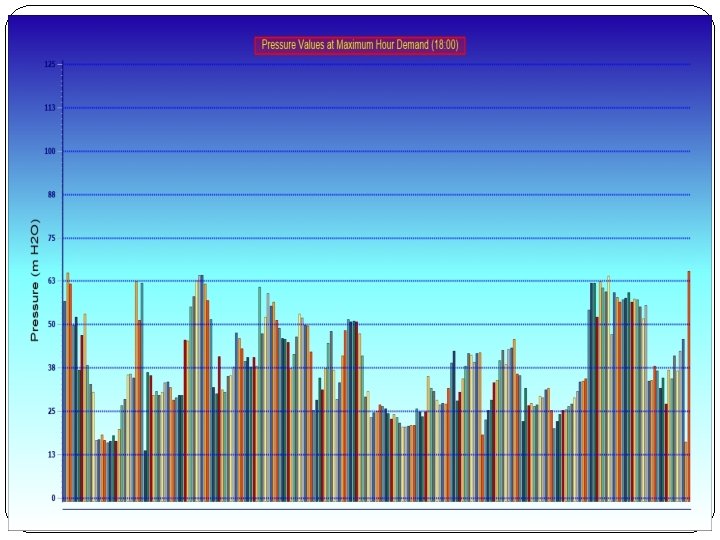
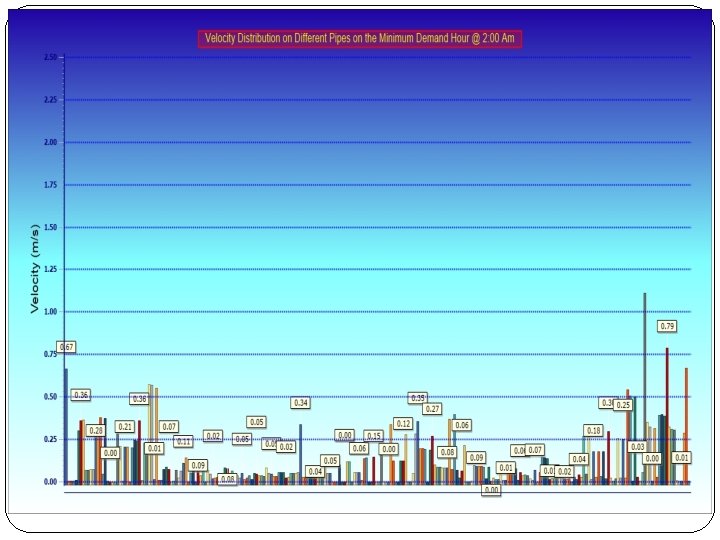
9. Defining the EPS to be the default base calculation option in order to perform dynamic analysis for the network. 10. Run the model and obtaining pressure and velocity values for junctions and pipes respectively. and starts iterations to find the most suitable pipe diameters to get the values of pressure within ranges of (PAW). 11. Start another cycle of iterations to fit pressure values between maximum and minimum day hours using pressure reducing valves.
 were used :")
Four (PRV) were used :
:")
Snapshot For (PRV):

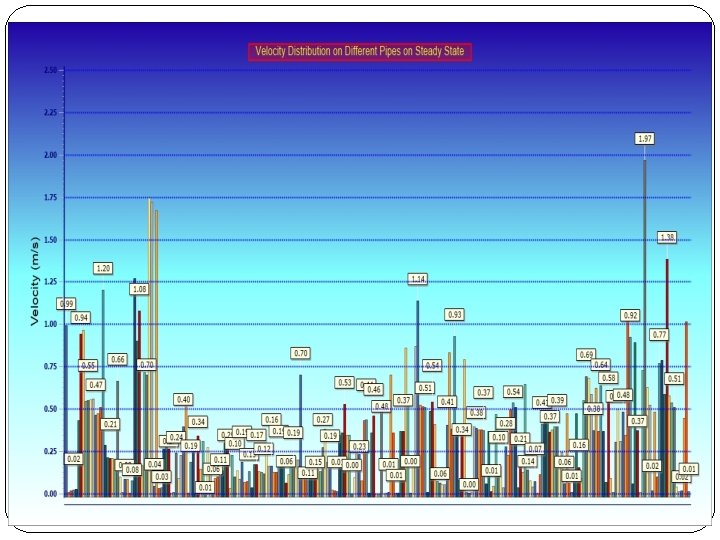
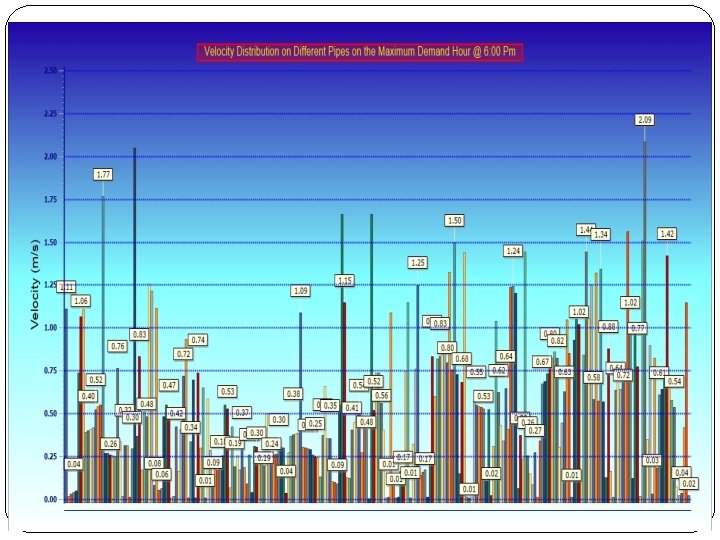
Results
inches")
Pipe Diameters: (only 2, 3, 4 and 6)inches

Sewer Collection System

Building the hydraulic model �Draw the network in the street of the village taken into considerations the slops.

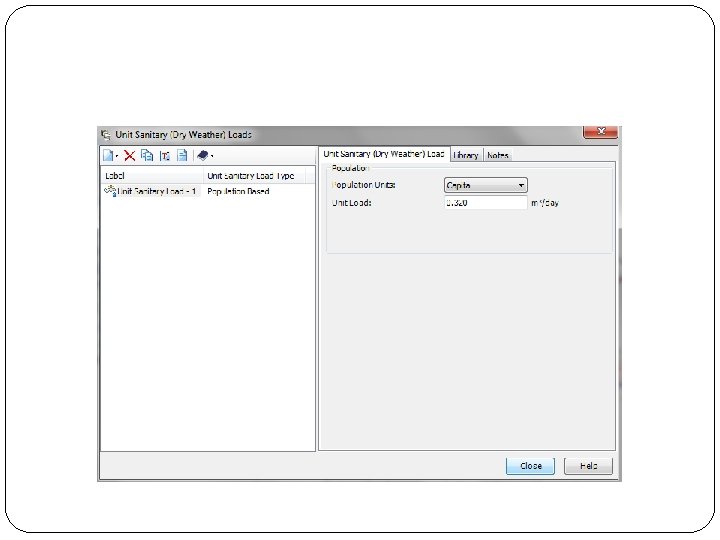
�Inter the elevations of the manholes by using TREX �Determine the water generations person, using this formula unit load = average daily per capita wastewater flow*return flow percentage*max. hourly factor+ infiltrations = 120*0. 8*3+ (120*0. 8)*. 2 =307. 2 and take it as 320 L. c/d

Inter the flow using load. Builder

Select the type of pipes which is PVC.

�Inter the Default Design Constraints which is velocity, cover and slope.
m, and it is used")
The standard cover of pipes between (1. 2 - 4)m, and it is used to protect pips. In other side it is not economic to use more than 4 m.
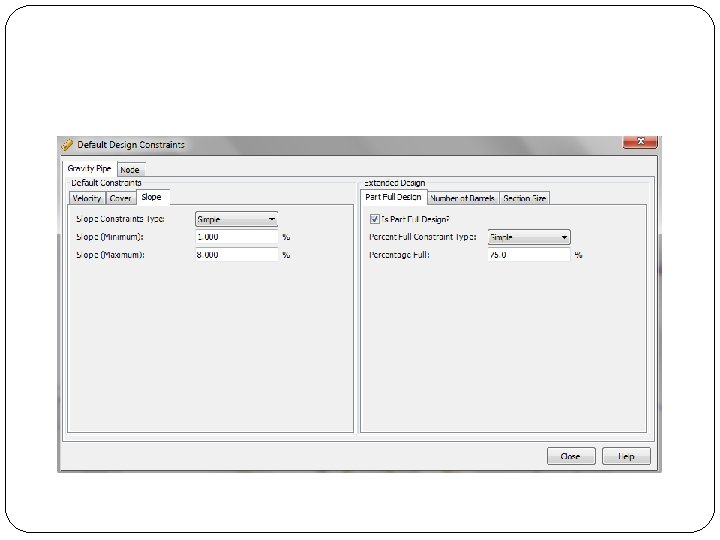
 cover (m) Slope% Minimum 0. 48 1. 2 1 Maximum 1.")
Results Velocity (m/sec) cover (m) Slope% Minimum 0. 48 1. 2 1 Maximum 1. 99 5. 8 8 About 5. 75% of the pipes velocity and found in the beginning of the network less than the minimum constraints. About 15. 1 % not meet the max. cover constraints.
 Flow (m OF 1 165 545. 6 OF 2 160")
Outfall Label Elevation (m) Flow (m OF 1 165 545. 6 OF 2 160 899. 22

Profile �From Autocad

Storm drainage system

Storm Drainage System �Importance of the system.

CIA �The Rational Method equation used to calculate peak storm water runoff rate Q= CIA Where: Q = design discharge (L 3 /T) C = runoff coefficient (dimensionless) I = design rainfall intensity (L/T), and A = watershed drainage area (L 2)

Procedure �Building model procedure 1. Use the GIS program to specify the borders of the total Catchment area. 2. Import DXF extension of the Auto. CAD maps to the Storm. CAD program, and specify the units and the scale.
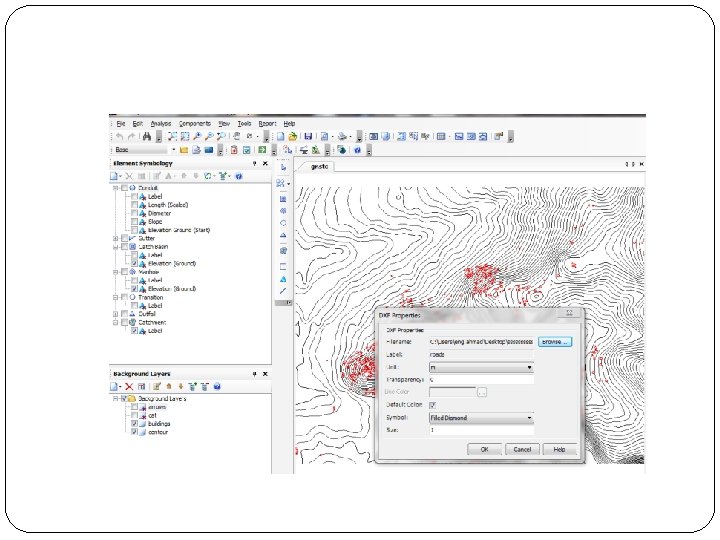

3. Set the maps as background layers, and enter the default design constrains
 curves depending on the information from the Palestinian water authority.")
Produce the Intensity-duration-frequency (IDF) curves depending on the information from the Palestinian water authority. 4.

5. Define the inlets and conduits that will be used in the design processes by entering the available sizes in the market. 6. Define the catch basins by entering the dimensions of each type.
 program to obtain slope arrows, and then enter the")
7. Use (civil 3 D) program to obtain slope arrows, and then enter the arrows as a layer into the Storm. CAD using GIS.

8. Start drawing the conduits, catch basins, and manholes in the appropriate location. 9. Obtain the elevation of manholes and catch basins from the contour map by using (Trex).

10. Use the tables of rational coefficient C to identify the value that represents each catchment area depending on land use and land cover, then use it to calculate the time of concentration. 11. Run the model and analyze the results. 12. Detect errors from the given results and correct them.
 Cover (m) Slope (%) Minimum 0. 6 0. 8 1 Maximum")
Results Velocity (m/s) Cover (m) Slope (%) Minimum 0. 6 0. 8 1 Maximum 6. 5 4. 8 15 • Velocity : the percent of conduits have more than 4. 5 m/s is equal to 3%
")
�Profiles (on Autocad)

Conclusion and Recommendation

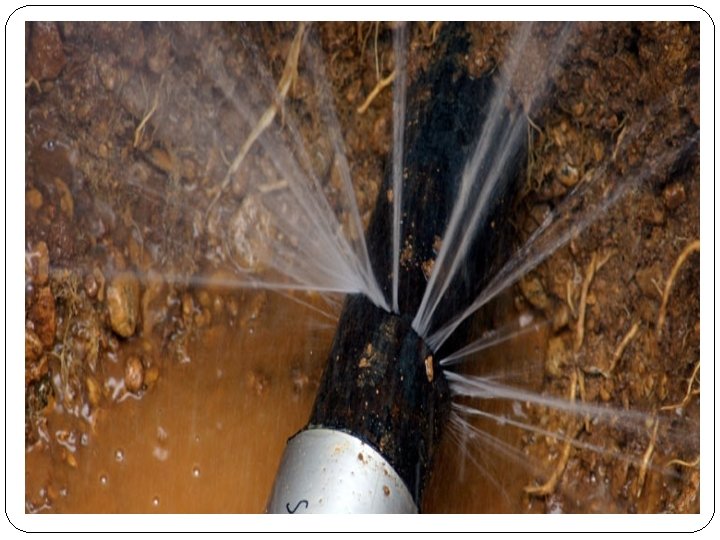
Water Distribution Network �According to our calculation and WDN designing . few of nodes have a pressure below 20 m in the maximum hour demand but these nodes have higher pressure values in other day times so the situation could be accepted since we considering fluctuation in demand through the day. �Network leakage not considered in designing the network. But it should be taken into consideration. Since it has a high value in agricultural areas and it might be reach 50 % of water in the network.

�Head loss in pipes and fittings were neglected. And this is not accurate because it can change values of pressure in different nodes. So we recommend take these values into consideration in the future design.

Sewer Collection System �We face some problems in expected the number and the distributions of people in the future, thus we recommend to build a master plan because it is very useful and helpful.
 curve we use is the curve of Nablus City; since")
Storm Drainage �The (IDF) curve we use is the curve of Nablus City; since there is no one for Jenin City and its villages. So we should modify this curve to reflect the reality of the villa

- Slides: 56