BI 420 Introduction to Bioinformatics Gene Expression Analysis

BI 420 – Introduction to Bioinformatics Gene Expression Analysis Department of Biology, Boston College

Why study gene expression? Which genes are active • at different developmental stages? • in cells of different tissues? • at different time points in the same cell? • cells under different environmental conditions? • between normal and cancerous cells?

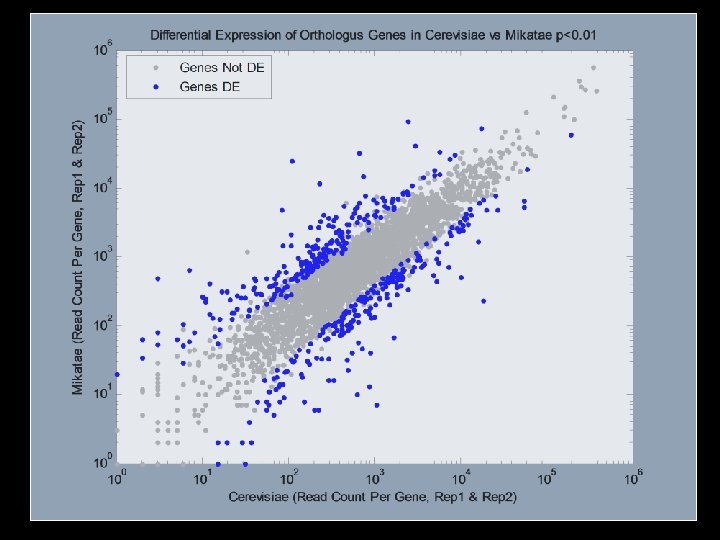
Calling Differential Expression Challenges In Measuring Expression Differential Expression Is the difference in expression between the test and the control greater than the uncertainty in the measurement?

Gene expression naturally bounces around a lot
 • Microarrays (older, cheaper)")
Methods For Measuring Gene Expression (all genes in the cell) • Microarrays (older, cheaper) • Sequenced based measurement RNASeq (replacing microarrays)

Expression microarray movie DNA microarray chip animation: http: //www. bio. davidson. edu/Courses/genomics/chip. html

What are expression microarrays?

Expression microarrays – “physical appearance”

c. DNA preparation

Expression assay

Chip readout – absolute expression and ratio

Chip readout – relative transcription

Chip readout – example

Time course experiments Experiment: measuring gene expression as oxygen gets depleted in yeast grown in a closed container

Time course data

Data analysis – normalization • balance fluorescent intensities of two dyes • adjust for differences in experimental conditions

Normalization

Log 2 transformation Double or half expression now has the same magnitude

Clustering – intro • Why: if the expression pattern for gene B is similar to gene A, maybe they are involved in the same or related pathway • How: Re-order expression vectors in the data set so that similar patterns are together

Clustering – numerical

Clustering – visual

Hierarchical clustering: pair-wise similarity

Hierarchical clustering: cluster construction

Clustering – large example

Application of microarrays: classification of cancers

RNA Seq

Measuring Gene Expression With RNA Seq |------Annotated Gene------| Genome • ACCCAATTTTCTGAAAATATCCGTGTCTTCCAG • Align reads • Count the number of reads that align uniquely within the regions of annotated genes (Shotgun, Cap-Trap, SAGE)

You get something like this Gene A Gene B Gene C Gene D Gene E Rep 1 5 16 10 3 1504 Rep 2 3 25 15 15 1005 Rep 3 12 35 3 8 1030 *Skewed distribution *Genes bounce around in replicates

Gene Ontology Enrichment • Ontology - An explicit formal specification of how to represent the objects, concepts and other entities • Gene Ontology- structured vocabulary used to describe aspects of the cell • Arranged in a hierarchy • Someone curates an ontology

Matlab example: Analyzing Gene Expression Profiles

Matlab example: Gene Ontology Enrichment in Microarray Data

Typical Steps in a Gene Expression Experiment • • Isolate RNA from several biological replicates (See slides 3 -4) Microarray – Label – Hybridize to microarray – Image microrray – Normalize data RNA-Seq – Sequence RNA – Align to genome – Count aligned reads – Normalize data between samples Analysis – independent of measurement technique – Call differential gene expression – Clustering – Gene Ontology enrichment
- Slides: 33