BetaCell Classification of Diabetes and the Egregious Eleven

Beta-Cell Classification of Diabetes and the Egregious Eleven: Logic for Newer Algorithms/ Processes of Care The Role of Newer Anti-Diabetes Medications in Reducing CV Risk and Outcomes in Patients with Diabetes: Diabetes Medications May be a Cardiologist’s Best Friend Stan Schwartz MD, FACP Affiliate, Main Line Health System Emeritus, Clinical Associate Professor of Medicine, U of Pa. 6105472000

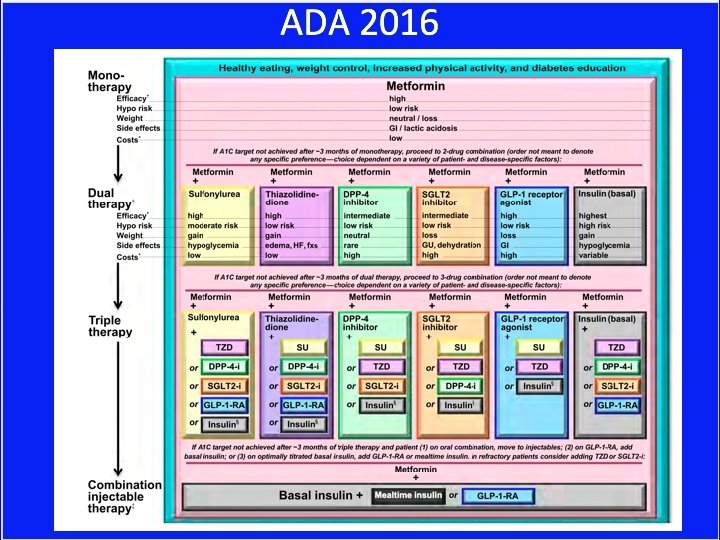
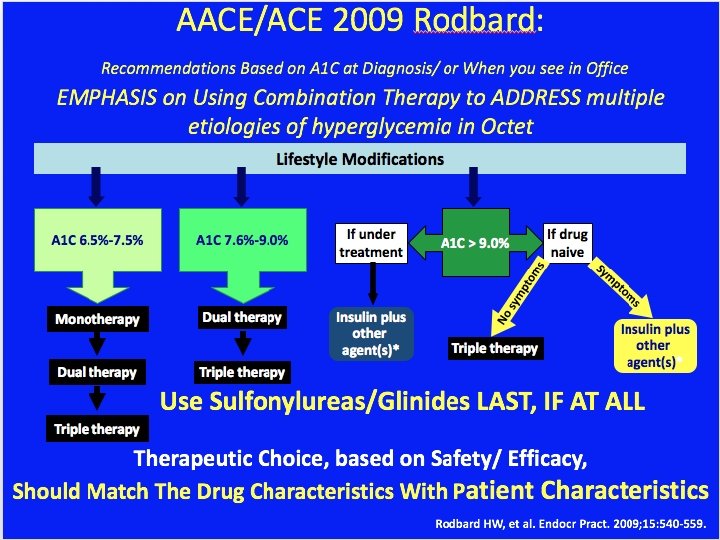
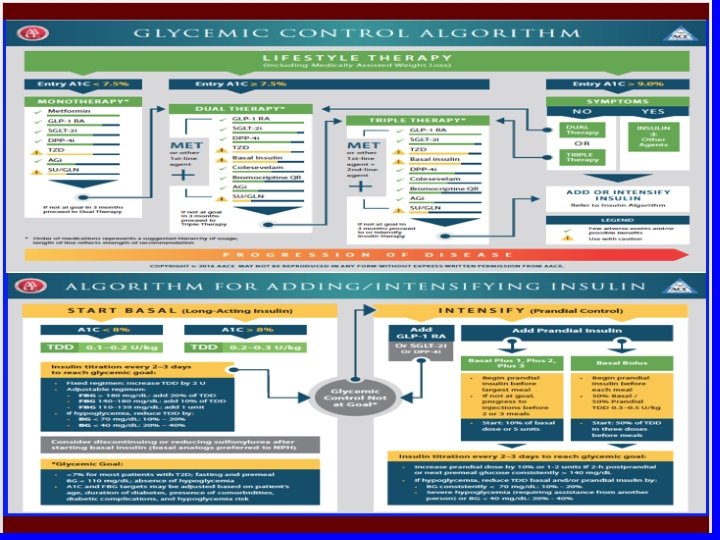
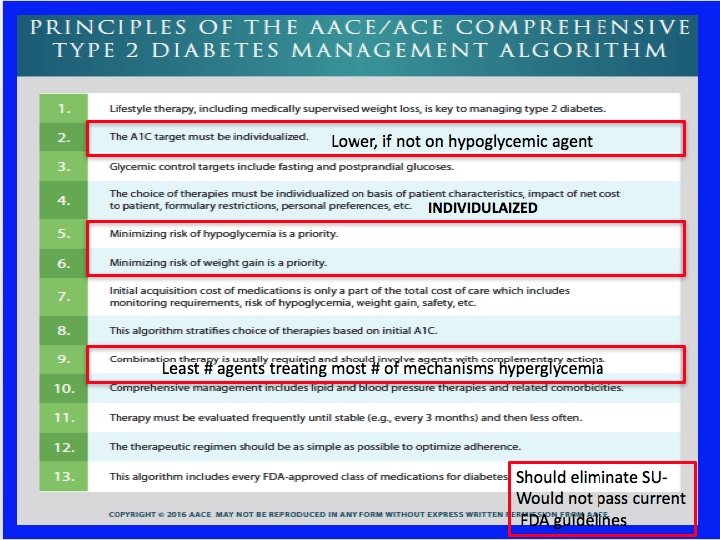
Current T 2 DM Guidelines • But limits therapeutic options in Type 1 • Based on ‘old classification’ of DM
 BUT")
Current DM Classification Failing (Certainly appropriate with knowledge available when current classification adopted) BUT WE’VE LEARNED SO MUCH MORE • Immune destruction of β-cells / and Insulin Resistance is used as basis of distinction between T 1 D, and T 2 D and all other sub-types of DM Diagnosis is often imprecise • Flatbush DM- present in DKA- ‘turn out to be T 2 DM’ • LADA- Adults who look like ‘typical T 1 DM’ • Antibody positive who look like ‘T 2 DM’ • T 1 DM with Insulin Resistance (like T 2 DM) Ie: Complicated by extensive overlap yet distinct differences in etiology and phenotype •

β-Cell Centric Classification of Diabetes: Implications for Classification, Diagnosis, Prevention, Therapy, Research INSULIN RESISTANCE GE N E Polygenic Monogenic Environment Epigenetics Inflammation/ Immune Regulation β-Cell secretion/mass CLASSIFY PATIENT BY CAUSE(s) of Beta-Cell Dysfunction In EACH Individual FINAL COMMON DENOMINATOR

β-Cell Centric Classification of Diabetes: Implications for Classification, Diagnosis, Prevention, Therapy, Research INSULIN** RESISTANCE GE N E Polygenic Monogenic Environment* Epigenetics Inflammation/ Immune Regulation β-Cell secretion/mass FINAL COMMON *Environment=Genetic suceptibility to DENOMINATOR eg: viruses, endocrine disruptors, food AGEs, Gut Biome **Insulin Resistance= Centrally Induced, Peripheral, Stress Hormones, Gut Biome

Phenotypic Presentation is defined by: Slope LOSS. 100% Severity = − β-cell loss of − − mass − % β−Cell − Mass − − 0% − = ‘Natural History’ over time, i. e. , RATE OF β-cell Slope is not linear in either T 1 DM or T 2 DM, and may be intermittently relapsing, remitting, stabilized, and improved. Complete loss of β-cell mass may never be reached, especially if newer agents better preserve β-cells. Pre-Diabetes = FBS ≥ 100, PPG ≥ 140 All DM = FBS ≥ 126, PPG ≥ 200 Critical β−Cell Mass Disease Modification I I I/ ≈ / I I I I I I I I I I I I I I I Increasing Age at presentation = tipping point when the combined gene effect / environmental trigger is exposed as phenotypic hyperglycemia

of Diabetes/Hyperglycemia : Implications for Classification, Diagnosis, Prevention, Therapy, Research INSULIN RESISTANCE GE N E Polygenic Monogenic Environment Epigenetics Inflammation/ Immune Regulation Vasculature FINAL COMMON DENOMINATOR CLASSIFY PATIENT BY CAUSE(s)/Mechanisms of VASCULAR Dysfunction In EACH Individual

Pathophysiology of Cardio-Vascular Disease Involves the Same Etiologies/ Pathophysiologic mechanisms of Diabetes/Hyperglycemia : Implications for Classification, Diagnosis, Prevention, Therapy, Research INSULIN RESISTANCE GE N E Polygenic Monogenic Environment Epigenetics Inflammation/ Immune Regulation Vasculature Damage *Environment=Genetic suceptibility to eg: poor diet, lack of exercise, sleep disorders, , food AGEs, Gut Biome **Insulin Resistance= Centrally Induced, Peripheral, Stress Hormones, Gut Biome
- Slides: 12