Best Country to live based on Human Development

Best Country to live based on Human Development Index? Michael Marchenko
 – United Nation • Human development is the development of")
Human Development Index (HDI) – United Nation • Human development is the development of the people through building human capabilities, by the people through active participation in the processes that shape their lives and for the people by improving their lives. • The Human Development Index (HDI) is a summary measure of average achievement in key dimensions of human development: a long and healthy life, being knowledgeable and have a decent standard of living. • The HDI is the geometric mean of normalized indices for each of the three dimensions.
 – United Nation • The health dimension is assessed by")
Human Development Index (HDI) – United Nation • The health dimension is assessed by life expectancy at birth • The education dimension is measured by mean of years of schooling for adults aged 25 years and more and expected years of schooling for children of school entering age. • The standard of living dimension is measured by gross national income per capita. The HDI uses the logarithm of income, to reflect the diminishing importance of income with increasing GNI. The scores for the three HDI dimension indices are then aggregated into a composite index using geometric mean.
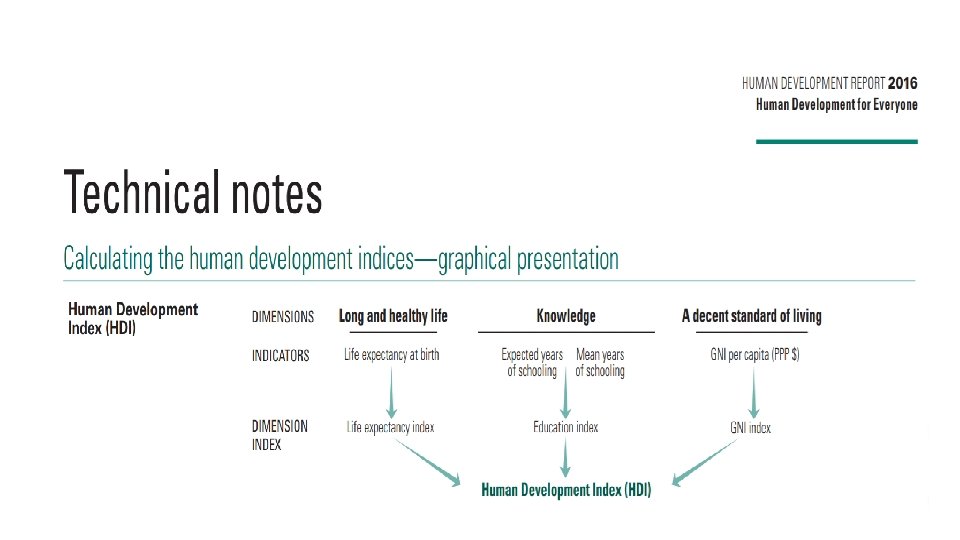

Two Steps to calculate the Human Development Index • Step 1. Creating the dimension indices • Step 2. Aggregating the dimensional indices to produce the Human Development Index
 are set")
Step 1. Creating the dimension indices • Minimum and maximum values (goalposts) are set in order to transform the indicators expressed in different units into indices on a scale of 0 to 1. • These goalposts act as the “natural zeros” and “aspirational targets, ” respectively, from which component indicators are standardized (see equation 1 below). They are set at the following values: Dimension Indicator Minimum Maximum Health Life expectancy (years) 20 85 Education Expected years of schooling (years) 0 18 Mean years of schooling (years) 0 15 100 75, 000 Standard of living Gross national income per capita (2011 PPP $)

Step 1. Creating the dimension indices • The justification for placing the natural zero for life expectancy at 20 years is based on historical evidence that no country in the 20 th century had a life expectancy of less than 20 years (Maddison 2010; Oeppen and Vaupel 2002; Riley 2005). • Societies can subsist without formal education, justifying the education minimum of 0 years. The maximum for expected years of schooling, 18, is equivalent to achieving a master’s degree in most countries. The maximum for mean years of schooling, 15, is the projected maximum of this indicator for 2025.

Step 1. Creating the dimension indices • The low minimum value for gross national income (GNI) per capita, $100, is justified by the considerable amount of unmeasured subsistence and nonmarket production in economies close to the minimum, which is not captured in the official data. • The maximum is set at $75, 000 per capita. Kahneman and Deaton (2010) have shown that there is virtually no gain in human development and well-being from income per capita above $75, 000. • Currently, only four countries (Kuwait, Liechtenstein, Qatar and Singapore) exceed the $75, 000 income per capita ceiling

Step 1. Creating the dimension indices • Having defined the minimum and maximum values, the dimension indices are calculated as: Dimension index = actual value – minimum value maximum value – minimum value. (1) • For the education dimension, equation 1 is first applied to each of the two indicators, and then the arithmetic mean of the two resulting indices is taken.

Step 1. Creating the dimension indices • Because each dimension index is a proxy for capabilities in the corresponding dimension, the transformation function from income to capabilities is likely to be concave (Anand Sen 2000)—that is, each additional dollar of income has a smaller effect on expanding capabilities. Thus for income the natural logarithm of the actual, minimum and maximum values is used.

Step 2. Aggregating the dimensional indices to produce the Human Development Index • The HDI is the geometric mean of the three dimension indices: HDI = (IHealth. IEducation. IIncome)1/3 • Example: Georgia Indicator Value Life expectancy (years) 75. 0 Expected years of schooling (years) 13. 9 Mean years of schooling (years) 12. 2 Gross national income per capita (2011 PPP $) 8, 856 Note: Values are rounded.

Step 2. Aggregating the dimensional indices to produce the Human Development Index • Example: Georgia Health index = 75. 020 – 20 = 0. 8465 85 – 20 Expected years of schooling index = 13. 905 – 0 = 0. 77249 18 - 0 Mean years of schooling index = 12. 246 – 0 = 0. 81643 15 - 0 Education index = 0. 81643 + 0. 77249 = 0. 7945 2

Step 2. Aggregating the dimensional indices to produce the Human Development Index • Example: Georgia Income index = In(8, 855. 8) – In(100) = 0. 6773 Human Development Index = (0. 8465. 0. 7945. 0. 6773)1/3 = 0. 769 of Georgia Exercise: Can you count the HDI of Indonesia? Use any available data you have!

Methodology used to express income • The World Bank’s 2016 World Development Indicators database contains estimates of GNI per capita in constant 2011 purchasing power parity (PPP) terms for many countries. For countries missing this indicator (entirely or partly), the Human Development Report Office calculates it by converting GNI per capita from current to constant terms using two steps. • First, the value of GNI per capita in current terms is converted into PPP terms for the base year (2011). • Second, a time series of GNI per capita in constant 2011 PPP terms is constructed by applying the real growth rates to the GNI per capita in PPP terms for the base year. • The real growth rate is implied by the ratio of the nominal growth of current GNI per capita in local currency terms to the GDP deflator.

Methodology used to express income • To obtain the income value for 2016 for some countries, the International Monetary Fund (IMF)–projected real growth rates of GDP are applied to the most recent GNI values in constant PPP terms. • The IMF-projected real growth rates are calculated based on local currency terms and constant prices rather than in PPP terms. This avoids mixing the effects of the PPP conversion with those of real growth of the economy • Official PPP conversion rates are produced by the International Comparison Program, whose surveys periodically collect thousands of prices of matched goods and services in many countries. • The last round of this exercise refers to 2011 and covered 199 countries.

Country groupings • This Report keeps the same cutoff points of the HDI for grouping countries that were introduced in the 2014 Report: Very high human development 0. 800 and above High human development 0. 700 – 0. 799 Medium human development 0. 550 – 0. 699 Low human development Below 0. 550 Exercise: In which country groupings of Georgia and Indonesia for HDI?

HDI rank of Indonesia is 113 with HDI is 0. 689 Source : http: //hdr. undp. org/en/composite/HDI

The best country to live based on HDI is NORWAY

References • http: //hdr. undp. org/en/content/human-development-index-hdi • http: //hdr. undp. org/sites/default/files/hdr 2016_technical_notes_0_ 0. pdf
- Slides: 19