
Benchmarking Compensation Benefits How Do You Compare Christina
Benchmarking Compensation & Benefits: How Do You Compare? Christina L. Greathouse, Ph. D. Strategic Performance Group April 30, 2008 Copyright 2008 - SPG
Benchmarking Comp & Benefits • • Determining compensation objectives Choosing sources of data Choosing comparable organizations Matching your positions to benchmark jobs • Using multiple data points • Deciding which statistics to use • Aging the data Copyright 2008 - SPG 2
Benchmarking Comp & Benefits • • Determining your market position Making market adjustments Developing pay ranges Paying for performance Calculating operating ratios Benchmarking your benefits Communicating total compensation information Copyright 2008 - SPG 3
Determining Compensation Objectives • To achieve internal equity, ensuring that employees are paid fairly in relation to one another. • To achieve external equity, ensuring that employees are paid fairly and competitively in relation to the external marketplace. • To develop pay management practices that are fair, objective, transparent and legally defensible. • To develop a compensation process and system that can be easily maintained and updated. Copyright 2008 - SPG 4
Internal Equity Job Evaluation: Determining the relative worth of jobs in order to establish which jobs should be paid more than others within an organization • Job Ranking • Job Classification • Point System • Work Valuation Copyright 2008 - SPG 5
External Equity: Sources of Data 1. The American Society of Association Executives Compensation and Benefits Study 2. PRM Consulting Management Compensation Report for Not-for-Profit Organizations 3. Cordom Associates Salary Survey of Nonprofit Organizations 4. Human Resources Association – Washington Capital Area (HRA-WCA) Compensation Survey Report 5. U. S. Mercer Benchmark Database 6. Salary. Source. com 7. National Journal Biennial Salary Survey 8. National Compensation Study – Association Chief Staff Executives (American Research Company) Copyright 2008 - SPG 6
Choosing Comparable Organizations • • • Industry Size of budget Number of employees Location Individual versus institutional members Tax status Copyright 2008 - SPG 7
Matching Your Jobs to Benchmark Jobs • • • Scope Experience required Education required Supervisory responsibility Multi-function jobs Copyright 2008 - SPG 8
Deciding Which Data to Use • Mean: Average • Median: Midpoint/50 th Percentile - figure above and below which half of the reported compensation figures fall • 25 th Percentile: figure above which 75% of the reported compensation figures fall • 75 th Percentile: figure above which 25% of the reported compensation figures fall Copyright 2008 - SPG 9
Arriving at a Market Price Take the median or average of the data based on two or more “cuts”: • • Location Size (budget and/or # of employees) Industry Type of organization Copyright 2008 - SPG 10
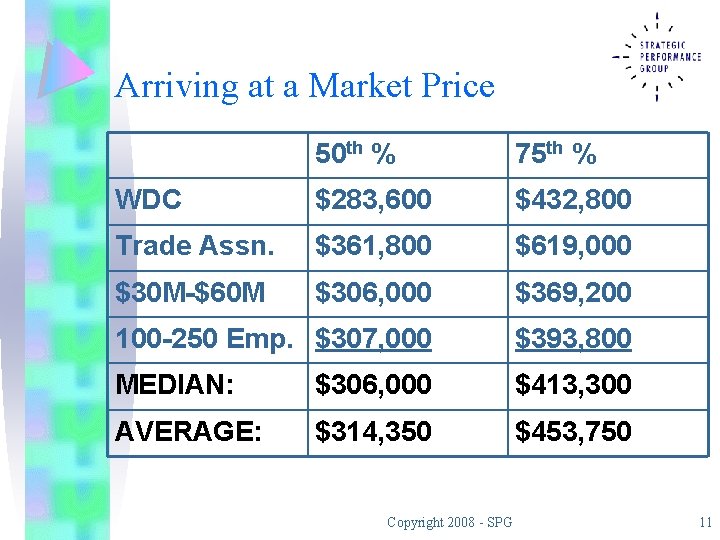
Arriving at a Market Price 50 th % 75 th % WDC $283, 600 $432, 800 Trade Assn. $361, 800 $619, 000 $30 M-$60 M $306, 000 $369, 200 100 -250 Emp. $307, 000 $393, 800 MEDIAN: $306, 000 $413, 300 AVERAGE: $314, 350 $453, 750 Copyright 2008 - SPG 11
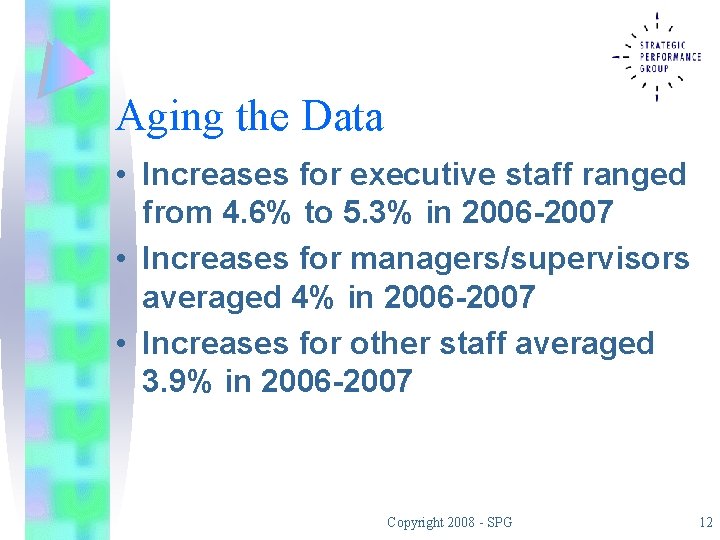
Aging the Data • Increases for executive staff ranged from 4. 6% to 5. 3% in 2006 -2007 • Increases for managers/supervisors averaged 4% in 2006 -2007 • Increases for other staff averaged 3. 9% in 2006 -2007 Copyright 2008 - SPG 12
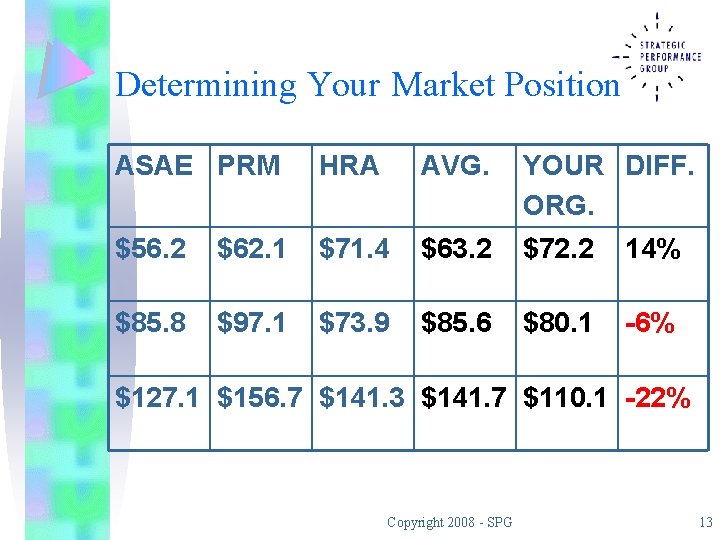
Determining Your Market Position ASAE PRM HRA AVG. YOUR DIFF. ORG. $56. 2 $62. 1 $71. 4 $63. 2 $72. 2 14% $85. 8 $97. 1 $73. 9 $85. 6 $80. 1 -6% $127. 1 $156. 7 $141. 3 $141. 7 $110. 1 -22% Copyright 2008 - SPG 13
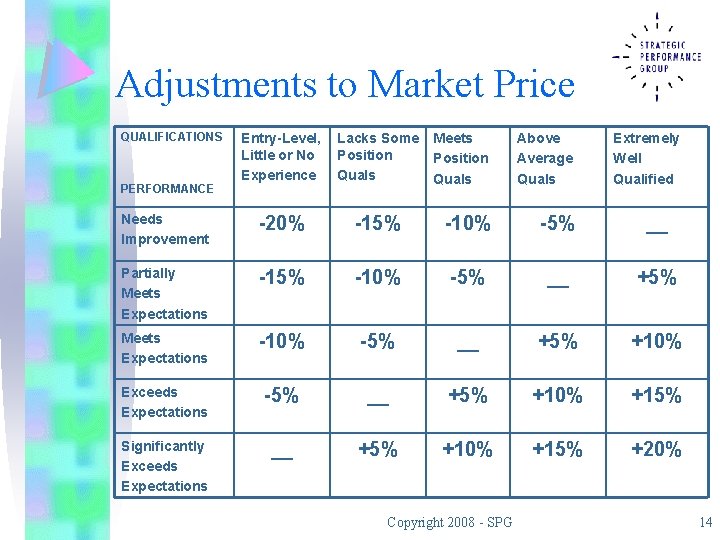
Adjustments to Market Price QUALIFICATIONS Entry-Level, Little or No Experience Lacks Some Position Quals Meets Position Quals Above Average Quals Needs Improvement -20% -15% -10% -5% __ Partially Meets Expectations -15% -10% -5% __ +5% Meets Expectations -10% -5% __ +5% +10% Exceeds Expectations -5% __ +5% +10% +15% Significantly Exceeds Expectations __ +5% +10% +15% +20% PERFORMANCE Copyright 2008 - SPG Extremely Well Qualified 14
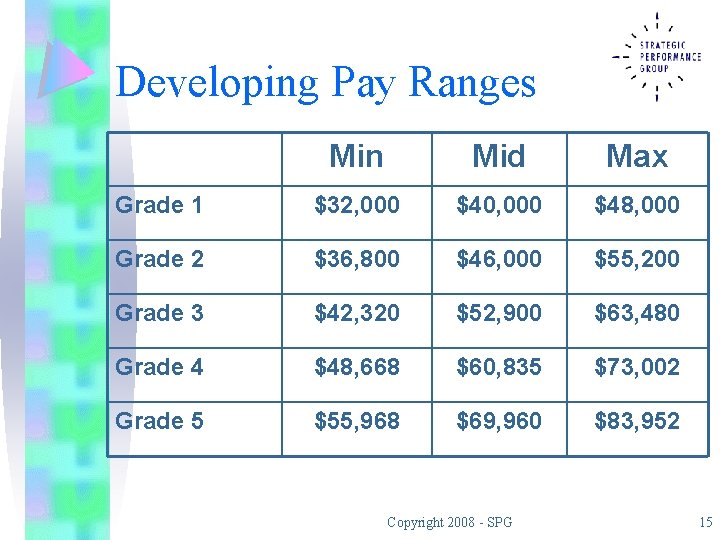
Developing Pay Ranges Min Mid Max Grade 1 $32, 000 $40, 000 $48, 000 Grade 2 $36, 800 $46, 000 $55, 200 Grade 3 $42, 320 $52, 900 $63, 480 Grade 4 $48, 668 $60, 835 $73, 002 Grade 5 $55, 968 $69, 960 $83, 952 Copyright 2008 - SPG 15
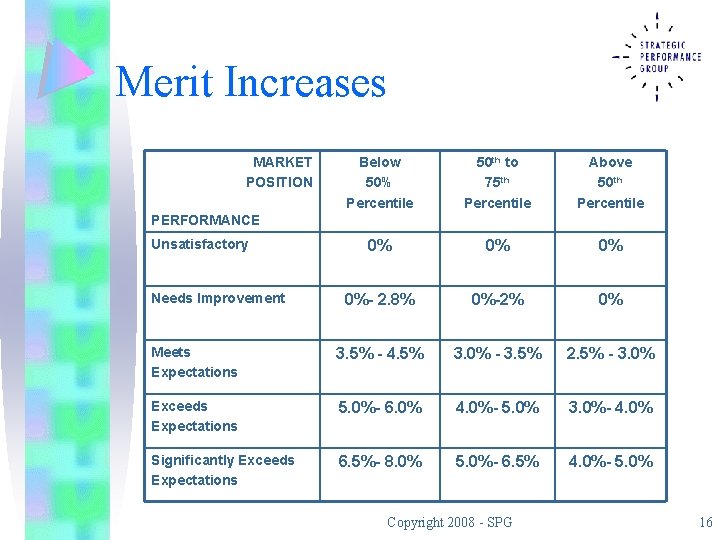
Merit Increases MARKET POSITION Below 50% Percentile 50 th to 75 th Percentile Above 50 th Percentile 0% 0%- 2. 8% 0%-2% 0% Meets Expectations 3. 5% - 4. 5% 3. 0% - 3. 5% 2. 5% - 3. 0% Exceeds Expectations 5. 0%- 6. 0% 4. 0%- 5. 0% 3. 0%- 4. 0% Significantly Exceeds Expectations 6. 5%- 8. 0% 5. 0%- 6. 5% 4. 0%- 5. 0% PERFORMANCE Unsatisfactory Needs Improvement Copyright 2008 - SPG 16
Operating Ratios • Total staff compensation (exempt & non-exempt FTEs): Total revenue • Staff size (FTEs): Total revenue • Employee benefits costs: Total staff compensation Copyright 2008 - SPG 17
Benchmarking Benefits Sources of Data: 1. The American Society of Association Executives Compensation and Benefits Study 2. PRM Consulting Management Compensation Report for Not-for-Profit Organizations 3. Cordom Associates Biennial Benefit Survey of Nonprofit Organizations Copyright 2008 - SPG 18
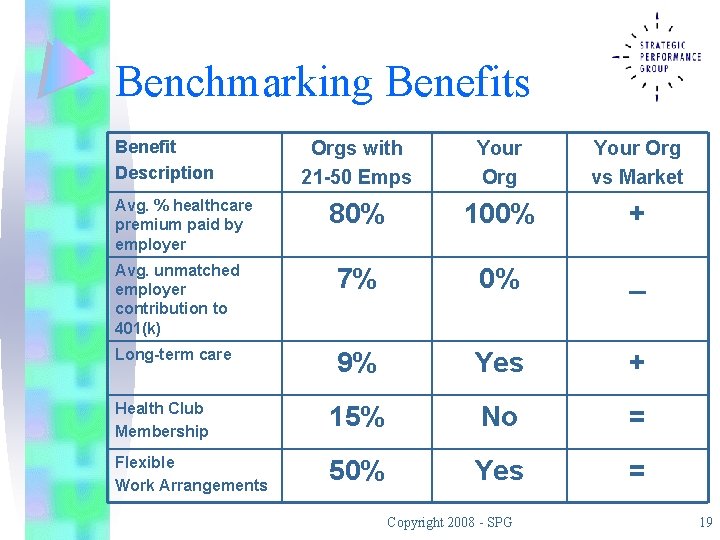
Benchmarking Benefits Benefit Description Orgs with 21 -50 Emps Your Org vs Market 80% 100% + Avg. unmatched employer contribution to 401(k) 7% 0% _ Long-term care 9% Yes + Health Club Membership 15% No = Flexible Work Arrangements 50% Yes = Avg. % healthcare premium paid by employer Copyright 2008 - SPG 19
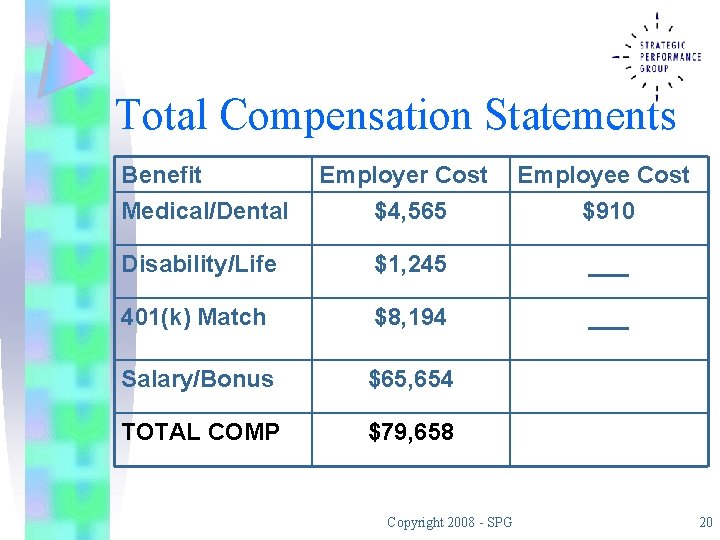
Total Compensation Statements Benefit Medical/Dental Employer Cost $4, 565 Employee Cost $910 Disability/Life $1, 245 ___ 401(k) Match $8, 194 ___ Salary/Bonus $65, 654 TOTAL COMP $79, 658 Copyright 2008 - SPG 20

Contact Information Chris Greathouse Strategic Performance Group 8000 Towers Crescent Drive, Suite 300 Vienna, VA 22182 703 -847 -3656 – Main phone number 703 -736 -0340 – Direct phone number cgreathouse@strategicperformance. net www. strategicperformance. net Copyright 2008 - SPG 21
- Slides: 21