Bell Ringer for 1019 1 Take a sheet

Bell Ringer for 10/19 1. Take a sheet from the front of the room. 2. Put it into your binder in the class handouts/class work section (look at your table of contents page to see where this is) 3. Work with your partner on filling in the “Survival Relationships” page (Venn Diagram AND ? ’s below) 4. Flip to your binder check sheet as I come around. You have 6 minutes!

Parasitism Commensalism • 1 organism left neutral, 1 benefitted • ONLY 1 • organism • 1 organism harmed, 1 benefitted • benefitted • Survival relationships • Between 2 organisms • Take place over • Neither organism extended time harmed • ONLY 1 • organism • benefitted • Both organisms benefit Mutualism

Class Announcements • Article half sheet due tomorrow • Graphing and questions about deer populations due tomorrow • If either are done early, turn them in to the folder as you leave the class • Today during tutoring after school is the last chance you have to make up the exam from last Thurs Rm. 313 after 9 th • Keep sheet in your binder, do not turn in.

Nutrition & Energy Flow Chapter 2, Section 2: As with yesterday, this ppt mostly focuses on making connections between the vocabulary terms. Notes are encouraged, but writing down definitions of the terms is not, as you should have them on your index cards.

How are these items related to one another in an ecosystem?

How Organisms Obtain Energy • The Sun is the ultimate source of energy for life.

Producers • Photosynthetic Autotrophs – Use light energy to make glucose

Consumers • Heterotrophs – Herbivores = feed only on plants – Carnivores = eat other heterotrophs – Scavengers = eat dead animals – Omnivores = eat both animal and plant materials – Decomposers = break down and release nutrient from dead organisms

Flow of Matter and Energy in Ecosystems • Models to show energy moves in one direction through an ecosystem – Food Chains – Food Webs – Ecological Pyramids

Food Chain • Arrows show transfer of energy Ex: berries mice black bear – A portion of energy is given off as heat at each transfer – Amount of energy in final transfer is only a fraction of what was at the first transfer

• Trophic Levels = Each organism represents a feeding step in the movement of energy

Food Web • Shows all possible feeding relationships at each trophic level in a community

Ecological Pyramids • Base always represents 1 st trophic level • Higher trophic levels are layered on top of one another

• Pyramid of Energy = Energy decreases with each trophic level moving up – Total energy transfer from one trophic level to the next is only about 10%

• Pyramid of Biomass = Less living material as you move up trophic levels

Cycles in Nature • Matter moves through the trophic levels of an ecosystem. • Energy can be lost through heat; Matter is not gained or lost, it is recycled. • Ex: Water Cycle, Carbon Cycle, Nitrogen Cycle, Phosphorous Cycle

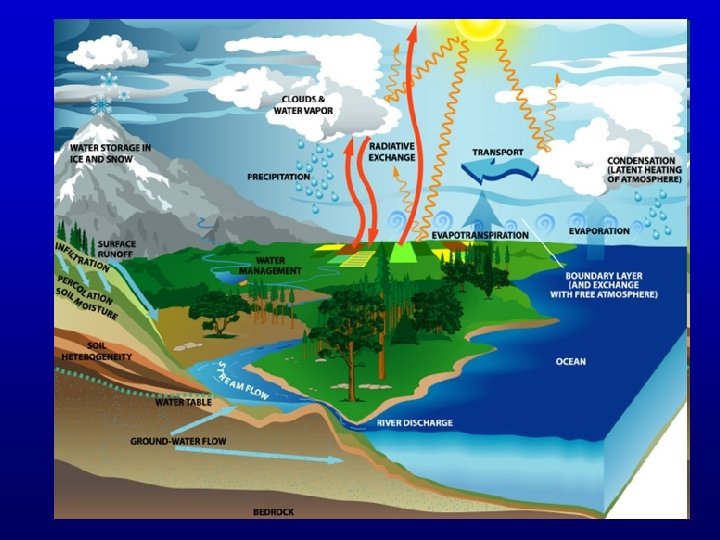
Water Cycle • Water present 3 billion years ago is still present today • It’s been recycled between land, ocean and atmosphere – Evaporation (water gas) – Condensation (clouds) – Precipitation (rain)

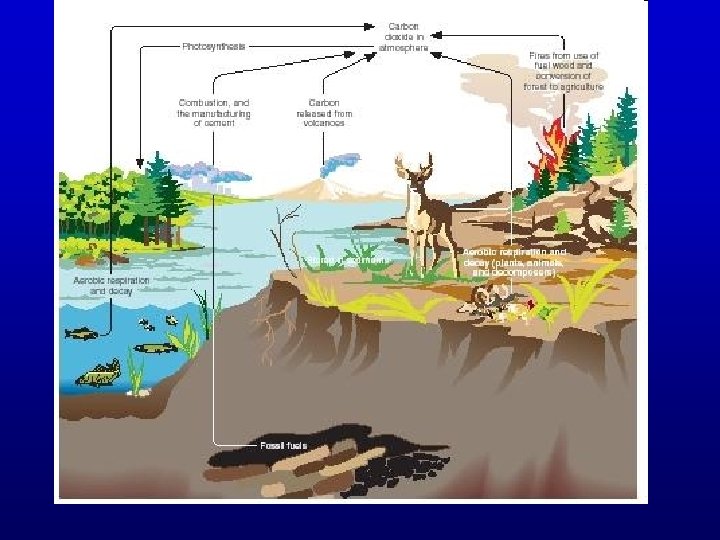
The Carbon Cycle Putting Carbon in the Ground: • Plants use CO 2 to create carbon compounds (sugar) for growth and energy • Consumers eat plants and/or other animals to get carbon compounds for growth and energy • Plants and animals die, carbon is returned to the ground where fossil fuels can form Putting Carbon in the Atmosphere: • CO 2 gets released during cell respiration • CO 2 released when burning fossil fuels

The Nitrogen Cycle • See figure 2. 19 on page 56

The Phosphorous Cycle • See figure 2. 20 on page 57

Practice • Why is a pyramid a good shape to represent how matter and energy transfer in an ecosystem? Why not use a circle or a square?

• According to the Law of Conservation, matter can neither be created nor destroyed. Make a relationship between this statement and the recycling of carbon in an ecosystem. (Hint: All life on this planet is carbon based. What happens to a tree that dies & falls in a forest? Who benefits from the dead tree? )
- Slides: 24