Bell ringer 912 Label each graph accordingly using

Bell ringer 9/12 Label each graph accordingly using the word bank below. speeding up down constant speed no motion slowing

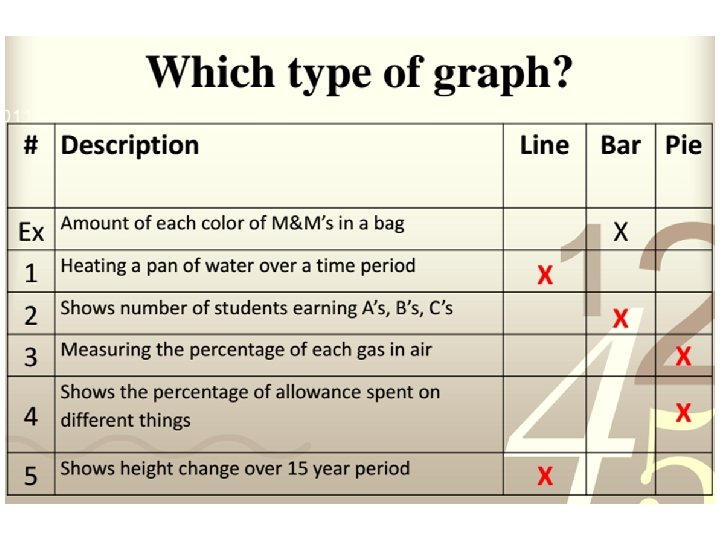
Types of graphs • Line graph – Shows changes of one variable due to another variable (how/if the IV affects the DV) --Many times, the IV plotted on the X-axis is time • Bar graph – Compares 2 or more groups • Pie Chart – Parts of a whole or percents – Categories need to add up to 100

Which type of graph? # Description 1 Amount of each color of M&M’s in a bag 2 Heating a pan of water over a time period 3 Shows number of students earning A’s, B’s, C’s 4 Measuring the percentage of each gas in air 5 Shows the percentage of allowance spent on different things 6 Shows height change over 15 year period Line Bar Pie

TAILS

T- Title The title should contain both the independent and dependent variables. Ex. “Y versus X” •

A- Axis • The independent variable = the X-axis • The dependent variable = the Y-axis • If you are making your graph from a data table, the first column is the independent variable and the second column is the dependent variable.

S-Scale • Decide on an appropriate scale for each axis. • Choose a scale that lets you make the graph as large as possible for you paper and data. • Scale is determined by your range of numbers (highest & lowest number)

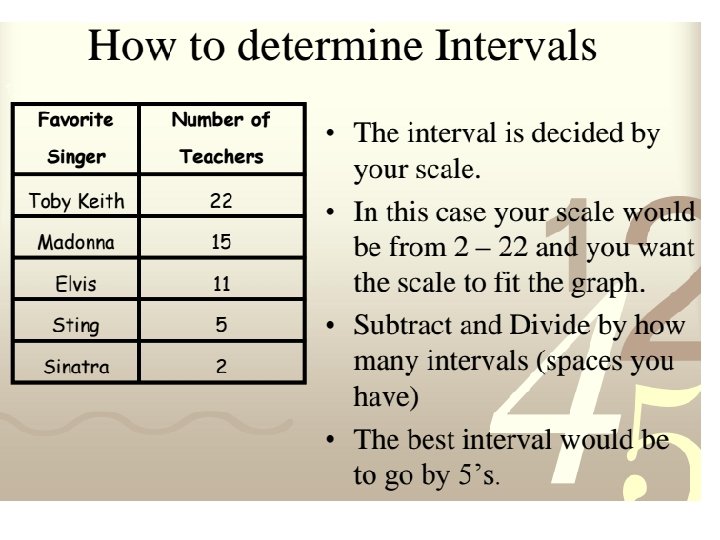
I-Intervals • The amount of space between one number and the next one. • What do you count by? • Choose an interval that lets you make the graph as large as possible for you paper and data
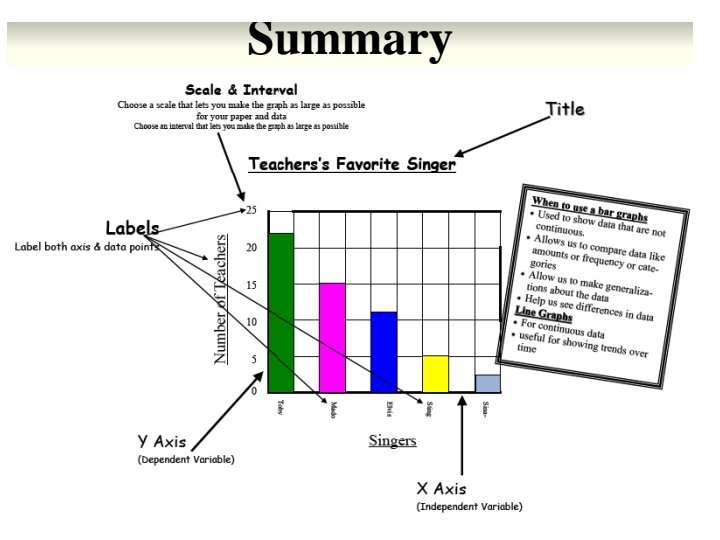

Good graphs: • Have a good title: BR: Copy this slide into your notes. – dependent variable vs. independent variable (The x-axis of a graph is always your independent variable and the y-axis is the dependent variable. ) • Label axes: – Independent variable on x axis – Dependent variable on y axis – Units on both axes • Have a good scale so the graph fills the entire area • Use a ruler & color as appropriate • Use a best fit line

INVERSE/ Indirect RELATIONSHIP As a factor increases, the other factor decreases Examples: As you increase your velocity, the time spent to get to your destination decreases If you eat more vegetables, your risk of a heart attack decreases Increasing the weight, will decrease the distance traveled.

o Direct Relationship: It is also known as a positive relationship where both variables (x and y) move together, either increasing or decreasing o Indirect Relationship: A negative relationship, occurs when both variables move in opposite directions (one increases and the other decreases)

Direct relationships occur when the two variables go up or down together. Examples: Increasing the temperature increases the heart rate of a frog As the radius of a pipe increases, the flow of water through the pipe also increases

• An experiment was carried out to determine the effect of temperature on the heart rate of frogs. In the experiment, 100 frogs were separated randomly into four equal groups: A, B, C, and D. Each group was maintained in a separate container at a different constant temperature: Group A at 5 C, Group B at 15 C, Group C at 25 C, and Group D at 35 C. All other conditions, such as the size, type, age, and number of frogs, as well as the size of the container and the amount of light, were the same for all the groups of frogs. • What is the dependent variable? • What is the independent variable? • What are the controls?
- Slides: 16