
Believe it or Not Stats methods are NOT
Believe it or Not: Stats methods are NOT as bad as you think! Cynthia Wilson Garvan Ph. D Statistics, MA Mathematics College of Nursing cgarvan@ufl. edu
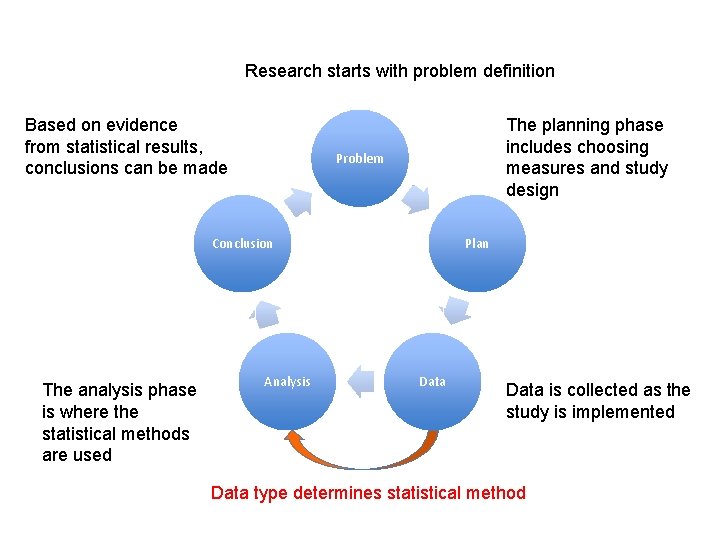
Research starts with problem definition Based on evidence from statistical results, conclusions can be made The planning phase includes choosing measures and study design Problem Conclusion The analysis phase is where the statistical methods are used Analysis Plan Data is collected as the study is implemented Data type determines statistical method
Data Types Research questions are ultimately answered using data. Data is collected through observation and measurement. Data elements can be classified into different types. The choice of statistical procedure used to analyze data depends on the data type. 3
Level – one value of a data element Supposed we asked a subject to tell us their Myers-Briggs personality type. Our data would be a list of possible responses: Personality type = {ENFJ, ENFP, ENTJ, …, ISTP} Each personality type (such as ENFP) in the list is a “level. ” 4
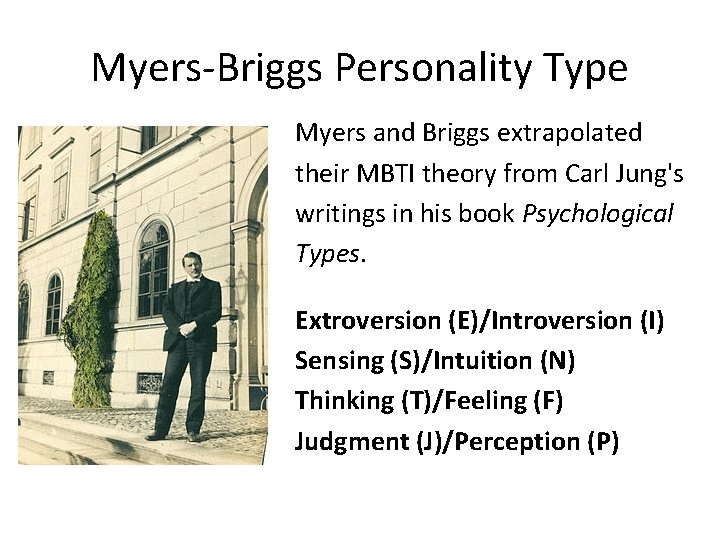
Myers-Briggs Personality Type Myers and Briggs extrapolated their MBTI theory from Carl Jung's writings in his book Psychological Types. Extroversion (E)/Introversion (I) Sensing (S)/Intuition (N) Thinking (T)/Feeling (F) Judgment (J)/Perception (P)
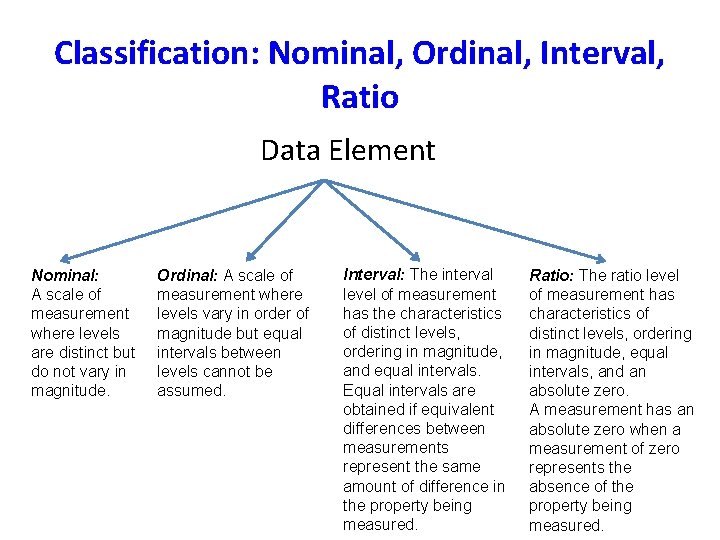
Classification: Nominal, Ordinal, Interval, Ratio Data Element Nominal: A scale of measurement where levels are distinct but do not vary in magnitude. Ordinal: A scale of measurement where levels vary in order of magnitude but equal intervals between levels cannot be assumed. Interval: The interval level of measurement has the characteristics of distinct levels, ordering in magnitude, and equal intervals. Equal intervals are obtained if equivalent differences between measurements represent the same amount of difference in the property being measured. Ratio: The ratio level of measurement has characteristics of distinct levels, ordering in magnitude, equal intervals, and an absolute zero. A measurement has an absolute zero when a measurement of zero represents the absence of the property being measured.
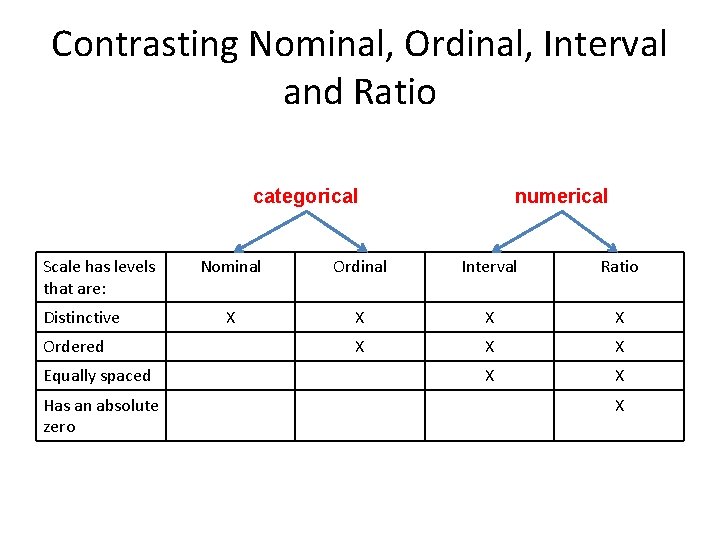
Contrasting Nominal, Ordinal, Interval and Ratio categorical Scale has levels that are: Distinctive Ordered Equally spaced Has an absolute zero numerical Nominal Ordinal Interval Ratio X X X X X
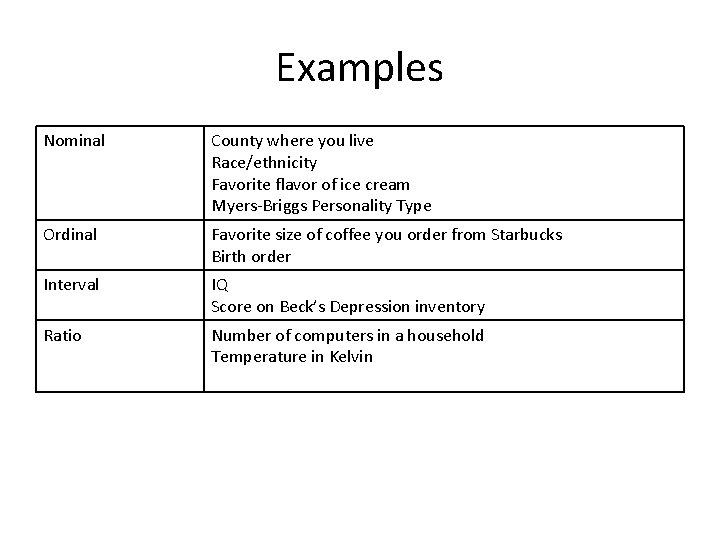
Examples Nominal County where you live Race/ethnicity Favorite flavor of ice cream Myers-Briggs Personality Type Ordinal Favorite size of coffee you order from Starbucks Birth order Interval IQ Score on Beck’s Depression inventory Ratio Number of computers in a household Temperature in Kelvin
? s A. Nominal B. Ordinal C. Interval D. Ratio
A. Nominal B. Ordinal C. Interval D. Ratio
A. Nominal B. Ordinal C. Interval D. Ratio
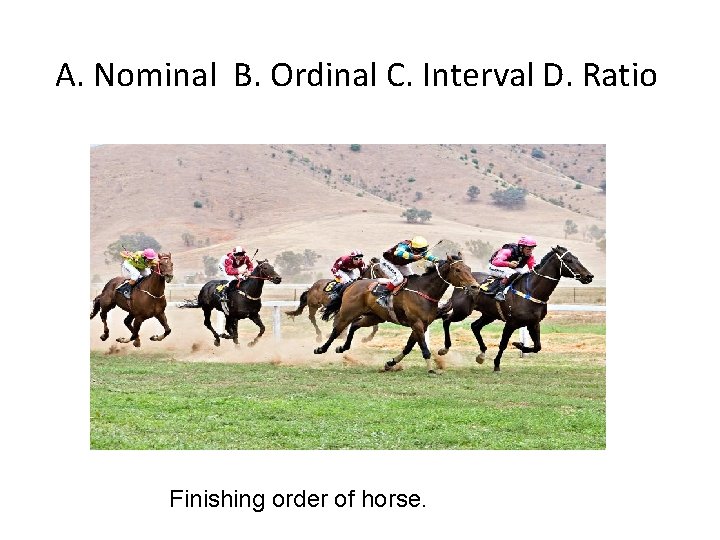
A. Nominal B. Ordinal C. Interval D. Ratio Finishing order of horse.
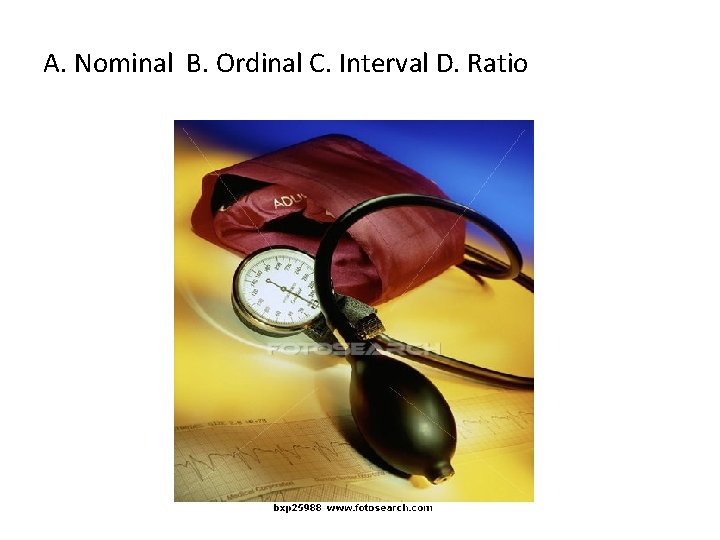
A. Nominal B. Ordinal C. Interval D. Ratio
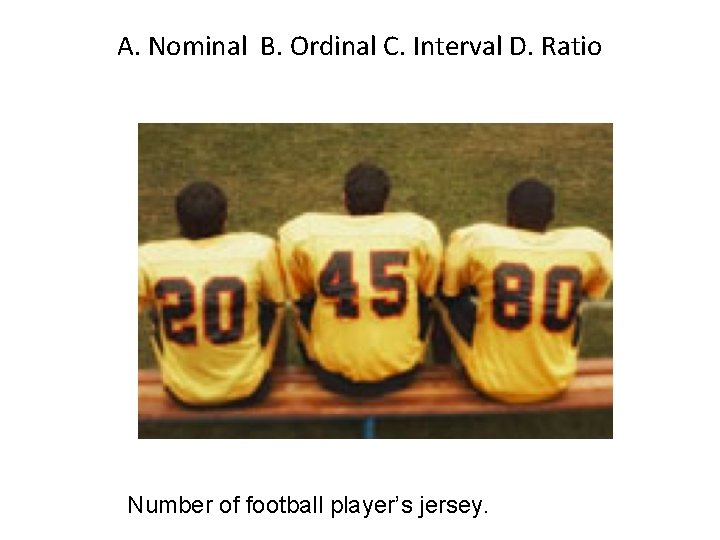
A. Nominal B. Ordinal C. Interval D. Ratio Number of football player’s jersey.
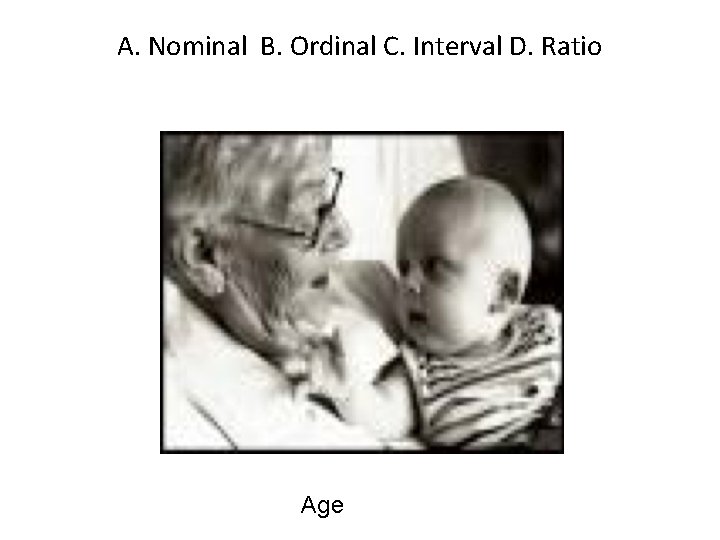
A. Nominal B. Ordinal C. Interval D. Ratio Age
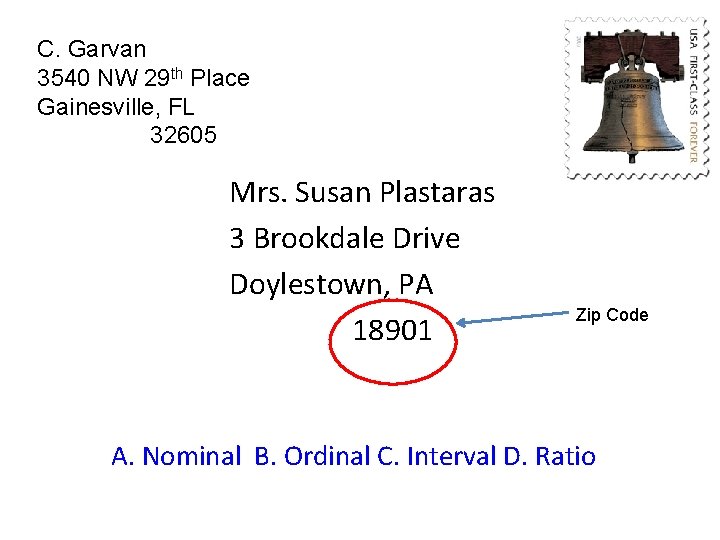
C. Garvan 3540 NW 29 th Place Gainesville, FL 32605 Mrs. Susan Plastaras 3 Brookdale Drive Doylestown, PA 18901 Zip Code A. Nominal B. Ordinal C. Interval D. Ratio
A. Nominal B. Ordinal C. Interval D. Ratio Romatic Quiz Question: Does love at first sight exist in your mind? Definitely. Maybe. For some people. Not at all.
Data Types for our purposes 1. Categorical 2. Binary 3. Numerical 18
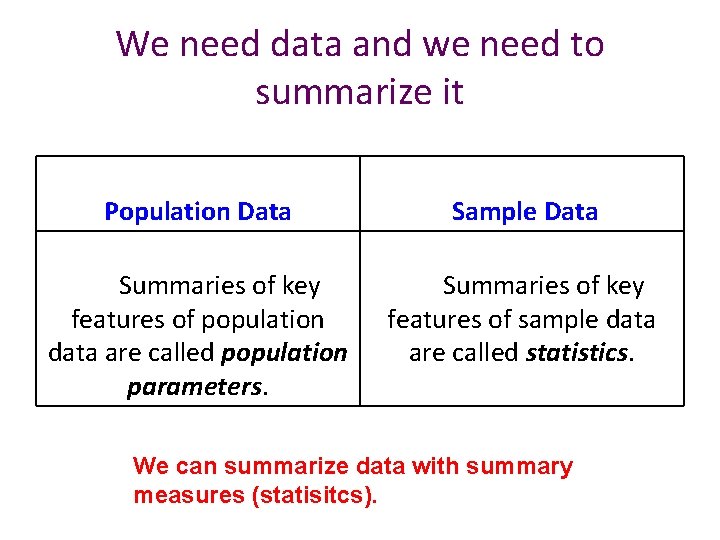
We need data and we need to summarize it Population Data Sample Data Summaries of key features of population data are called population parameters. Summaries of key features of sample data are called statistics. We can summarize data with summary measures (statisitcs).
Definitions • A statistic is any quantity that we can calculate from data. • Population parameters are quantities that summarize population data. Statistics are estimates of population parameters. The quality of estimation depends on how fairly the sample represents the population.
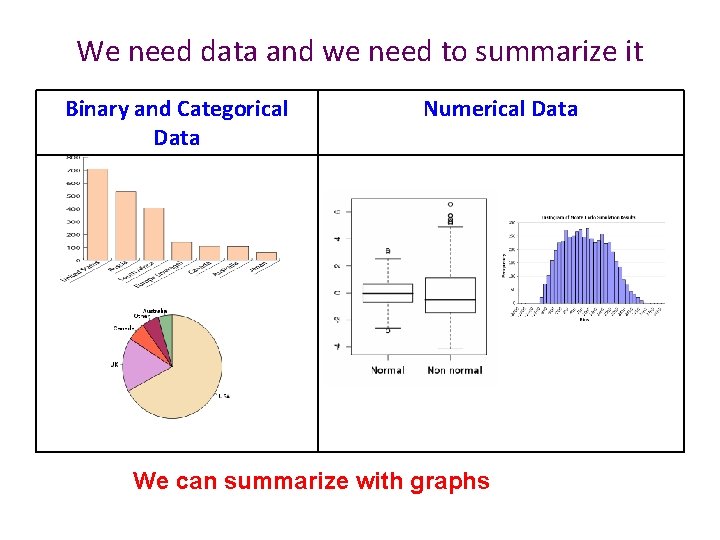
We need data and we need to summarize it Binary and Categorical Data Numerical Data We can summarize with graphs
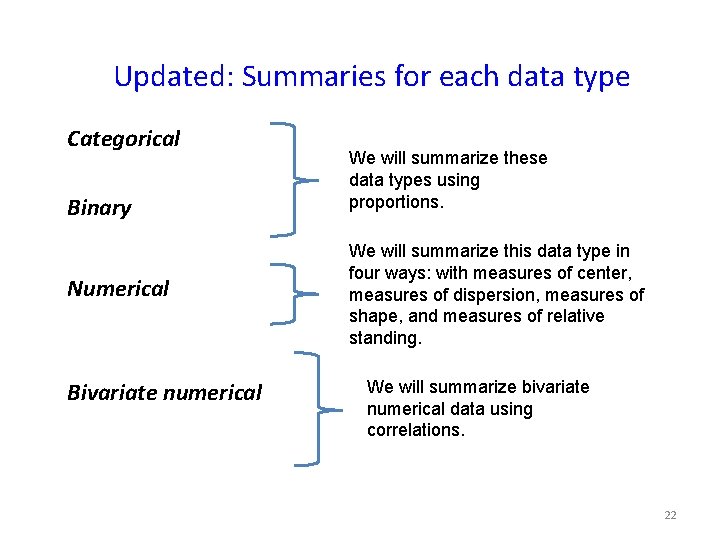
Updated: Summaries for each data type Categorical Binary Numerical Bivariate numerical We will summarize these data types using proportions. We will summarize this data type in four ways: with measures of center, measures of dispersion, measures of shape, and measures of relative standing. We will summarize bivariate numerical data using correlations. 22
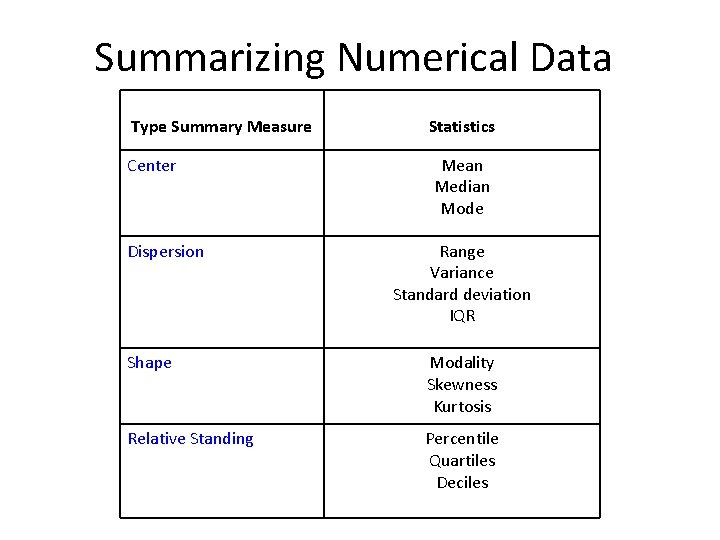
Summarizing Numerical Data Type Summary Measure Center Dispersion Statistics Mean Median Mode Range Variance Standard deviation IQR Shape Modality Skewness Kurtosis Relative Standing Percentile Quartiles Deciles
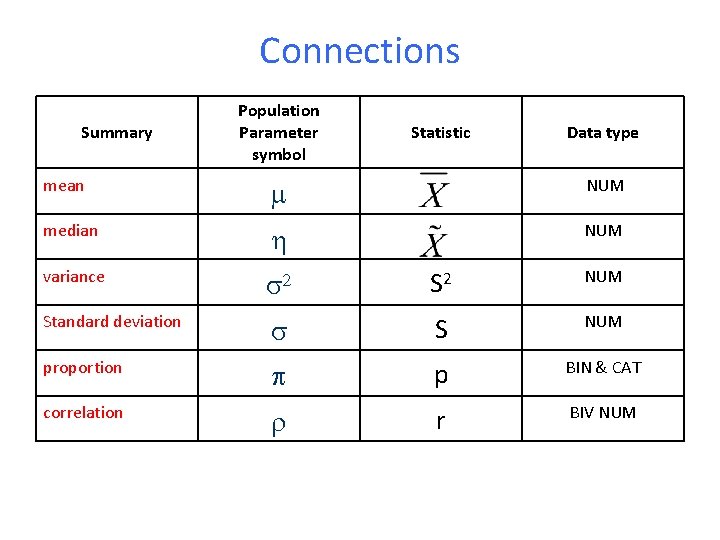
Connections Summary Population Parameter symbol Statistic Data type mean m NUM median h NUM variance s 2 S 2 NUM Standard deviation s S NUM proportion p p BIN & CAT correlation r r BIV NUM
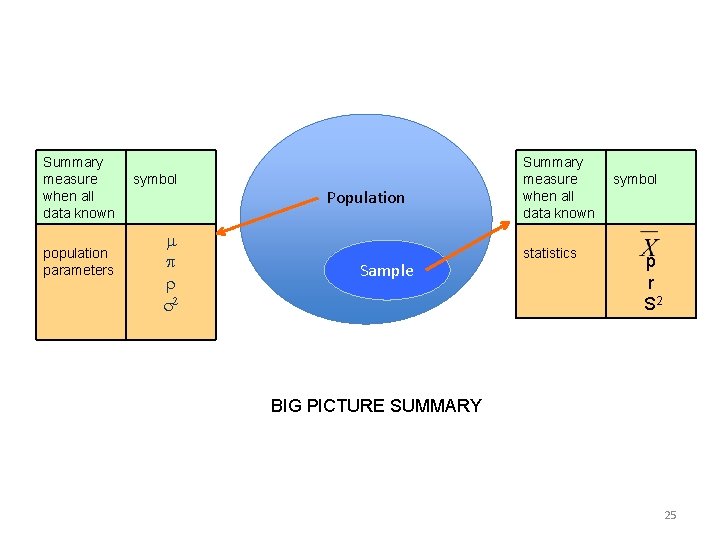
Summary measure when all data known population parameters symbol m p r s 2 Population Sample Summary measure when all data known statistics symbol p r S 2 BIG PICTURE SUMMARY 25
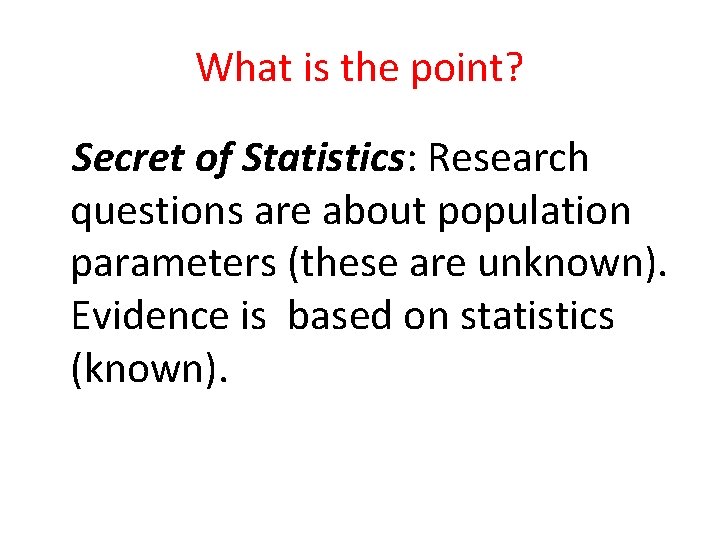
What is the point? Secret of Statistics: Research questions are about population parameters (these are unknown). Evidence is based on statistics (known).
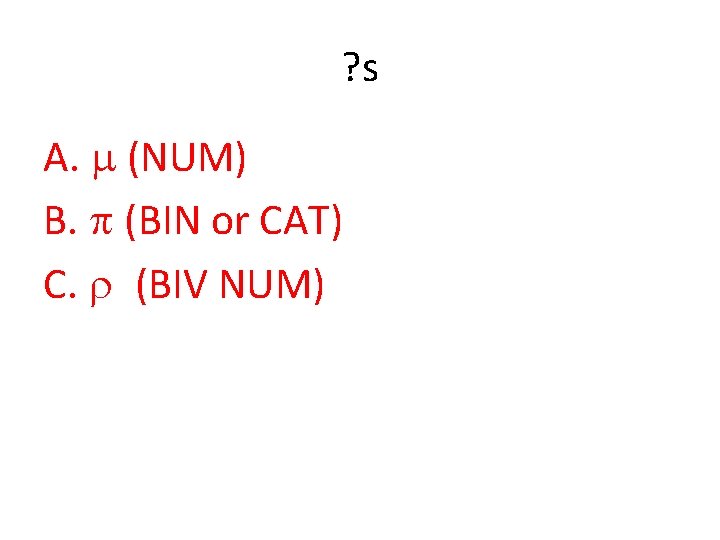
? s A. m (NUM) B. p (BIN or CAT) C. r (BIV NUM)
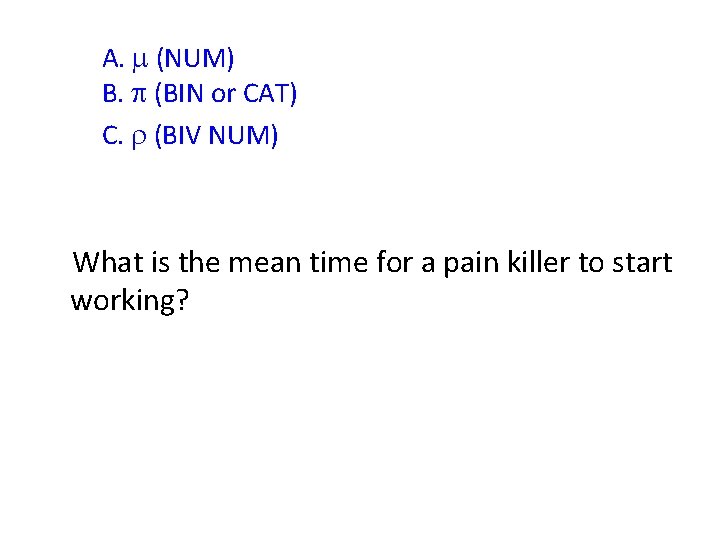
A. m (NUM) B. p (BIN or CAT) C. r (BIV NUM) What is the mean time for a pain killer to start working?
A. m (NUM) B. p (BIN or CAT) C. r (BIV NUM) What is the percent of patients who experience POCD (post-operative cognitive dysfunction)?
A. m (NUM) B. p (BIN or CAT) C. r (BIV NUM) What is the relationship of depression (as measured by Beck’s Depression Inventory) and annual income?
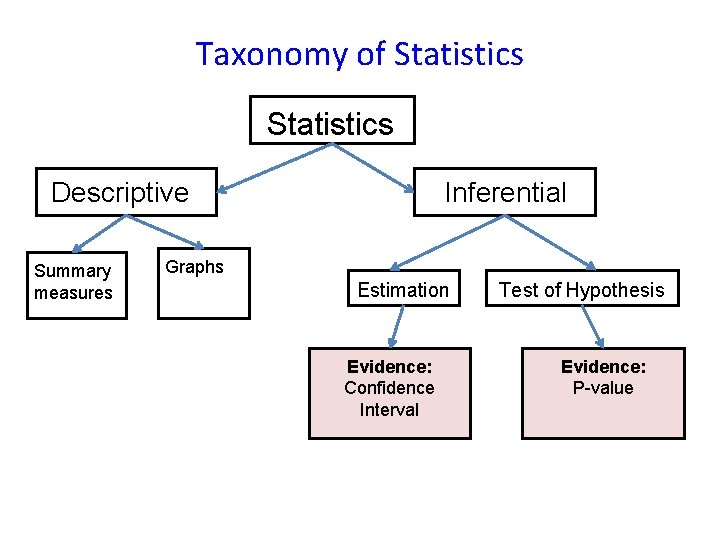
Taxonomy of Statistics Descriptive Summary measures Inferential Graphs Estimation Evidence: Confidence Interval Test of Hypothesis Evidence: P-value
Estimation • What is the mean time for a pain killer to start working? • What is the percent of patients who experience POCD (post-operative cognitive dysfunction)? • What is the relationship of depression (as measured by Beck’s Depression Inventory) and annual income?
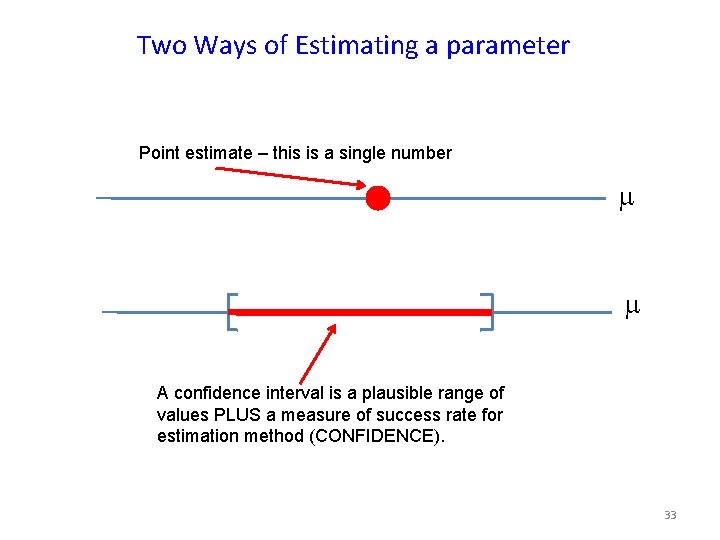
Two Ways of Estimating a parameter Point estimate – this is a single number m m A confidence interval is a plausible range of values PLUS a measure of success rate for estimation method (CONFIDENCE). 33
Test of Hypothesis (TOH) Consider the following research questions, they are examples of test of hypothesis type inference: – Is the mean head circumference of newborns exposed prenatally to cocaine equal to 25 cm? – Is the percent of homeless cats equal to 40%? – Is the variance of IQ scores in a certain population equal to 225? – Is there a correlation between IQ and newborn head circumference?
Test of Hypothesis (TOH) A test of hypothesis (TOH) type of inference is appropriate when the goal of the research question is to verify an educated guess, compare groups, test relationships, or explain/predict outcomes.
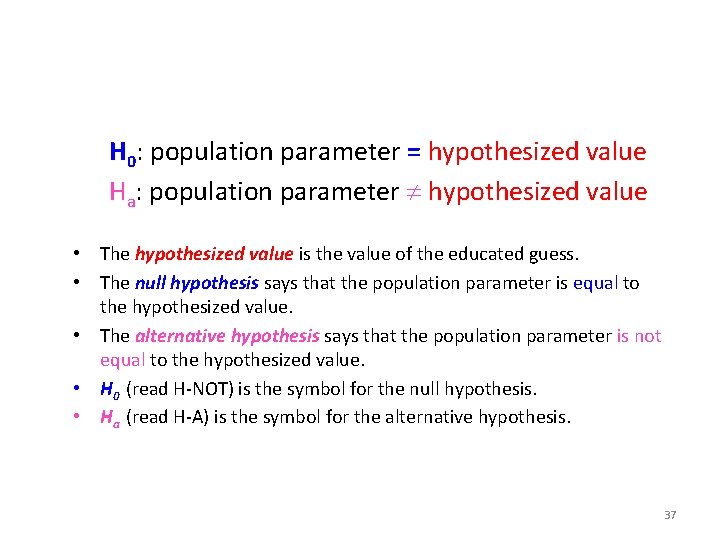
H 0: population parameter = hypothesized value Ha: population parameter hypothesized value • The hypothesized value is the value of the educated guess. • The null hypothesis says that the population parameter is equal to the hypothesized value. • The alternative hypothesis says that the population parameter is not equal to the hypothesized value. • H 0 (read H-NOT) is the symbol for the null hypothesis. • Ha (read H-A) is the symbol for the alternative hypothesis. 37
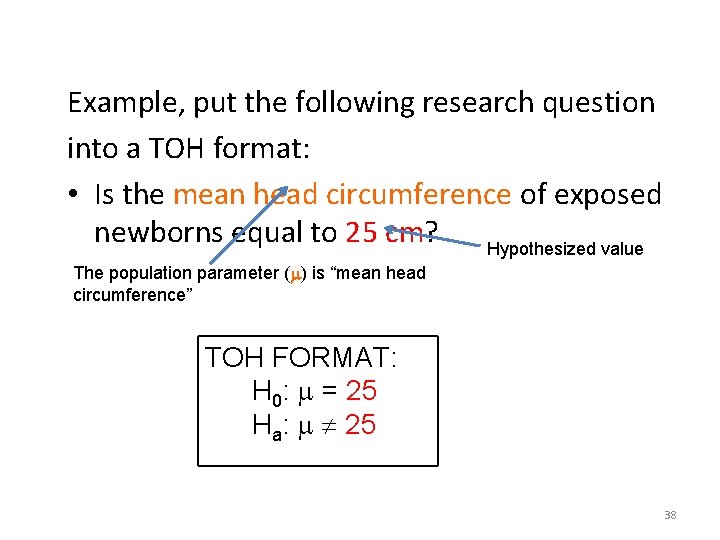
Example, put the following research question into a TOH format: • Is the mean head circumference of exposed newborns equal to 25 cm? Hypothesized value The population parameter (m) is “mean head circumference” TOH FORMAT: H 0: m = 25 Ha: m 25 38
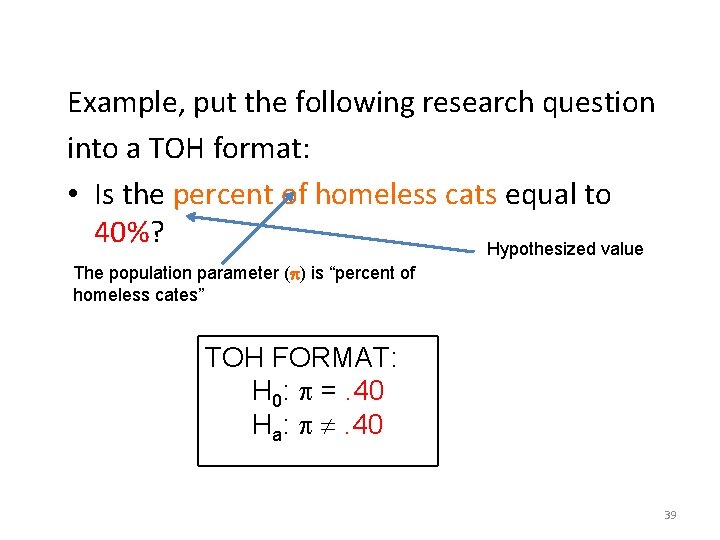
Example, put the following research question into a TOH format: • Is the percent of homeless cats equal to 40%? Hypothesized value The population parameter (p) is “percent of homeless cates” TOH FORMAT: H 0: p =. 40 Ha: p . 40 39
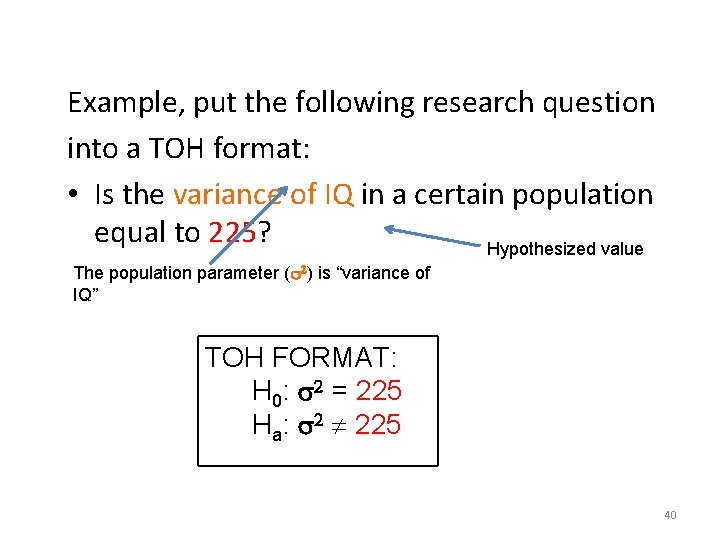
Example, put the following research question into a TOH format: • Is the variance of IQ in a certain population equal to 225? Hypothesized value The population parameter (s 2) is “variance of IQ” TOH FORMAT: H 0: s 2 = 225 Ha: s 2 225 40
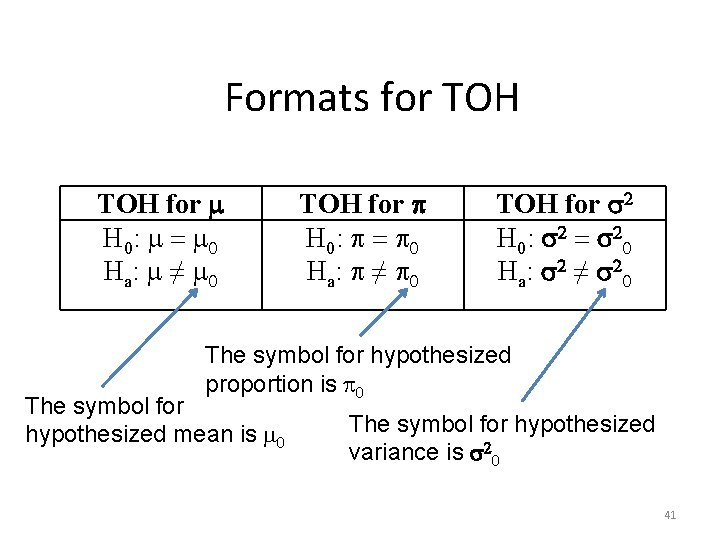
Formats for TOH for m H 0: m m 0 Ha : m ≠ m 0 TOH for p H 0: p p 0 Ha : p ≠ p 0 TOH for s 2 H 0: s 20 Ha: s 2 ≠ s 20 The symbol for hypothesized proportion is p 0 The symbol for hypothesized mean is m 0 The symbol for hypothesized variance is s 20 41
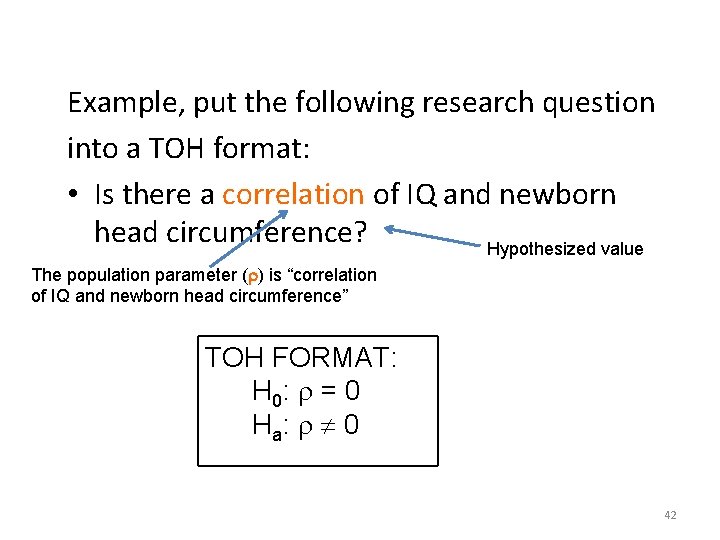
Example, put the following research question into a TOH format: • Is there a correlation of IQ and newborn head circumference? Hypothesized value The population parameter (r) is “correlation of IQ and newborn head circumference” TOH FORMAT: H 0: r = 0 H a: r 0 42
How to conduct a TOH DATA
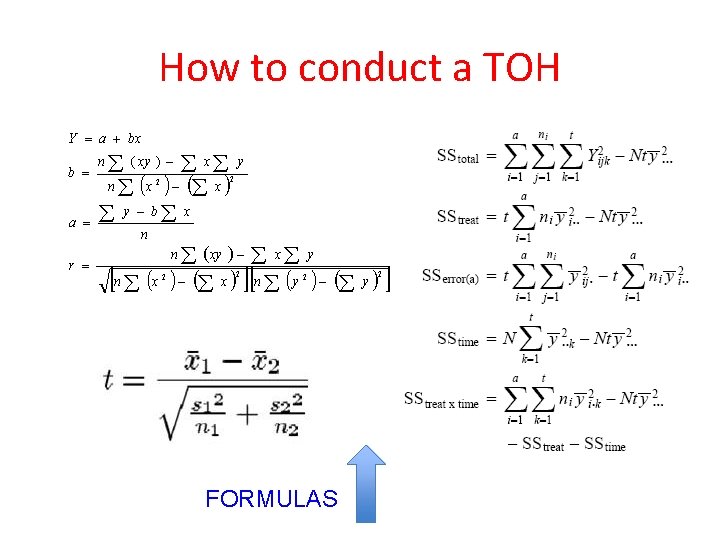
How to conduct a TOH FORMULAS
How to conduct a TOH

How to conduct a TOH
How to conduct a TOH Null Alternative DATA DATA P-value ≤. 05
How to conduct a TOH Null DATA A T A D P-value > 0. 05 Alternative DATA
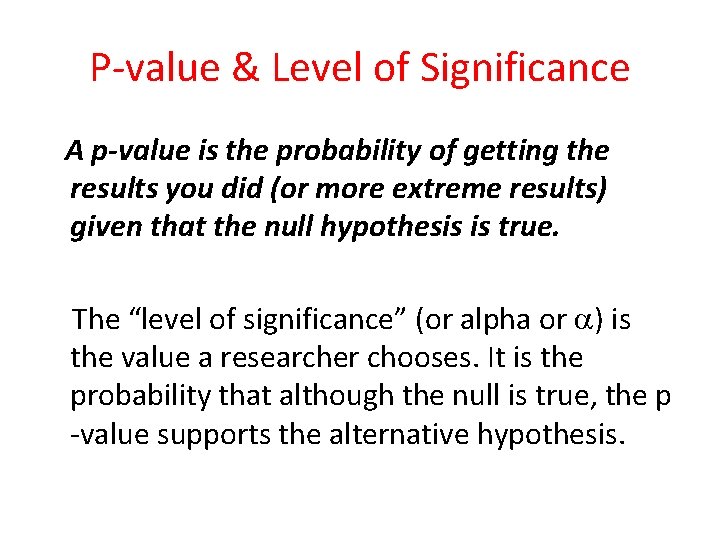
P-value & Level of Significance A p-value is the probability of getting the results you did (or more extreme results) given that the null hypothesis is true. The “level of significance” (or alpha or a) is the value a researcher chooses. It is the probability that although the null is true, the p -value supports the alternative hypothesis.
Decision Rule for Test After a level of significance (a) has been set, compare the p-value of test: • If p-value a then reject null hypothesis. • If p-value > a then fail to reject null hypothesis. 50
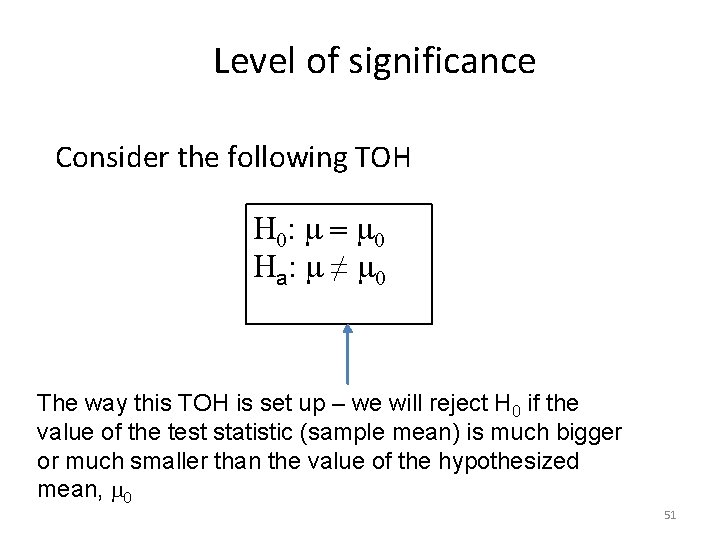
Level of significance Consider the following TOH H 0: m m 0 H a: m ≠ m 0 The way this TOH is set up – we will reject H 0 if the value of the test statistic (sample mean) is much bigger or much smaller than the value of the hypothesized mean, m 0 51
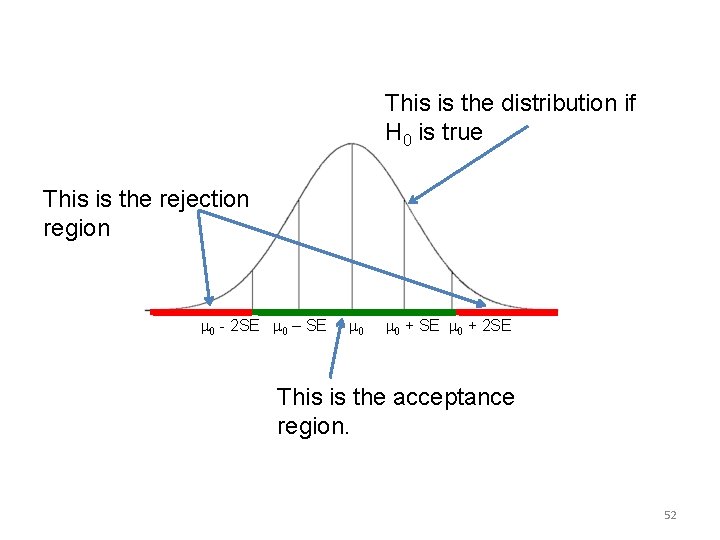
This is the distribution if H 0 is true This is the rejection region m 0 - 2 SE m 0 – SE m 0 + 2 SE This is the acceptance region. 52
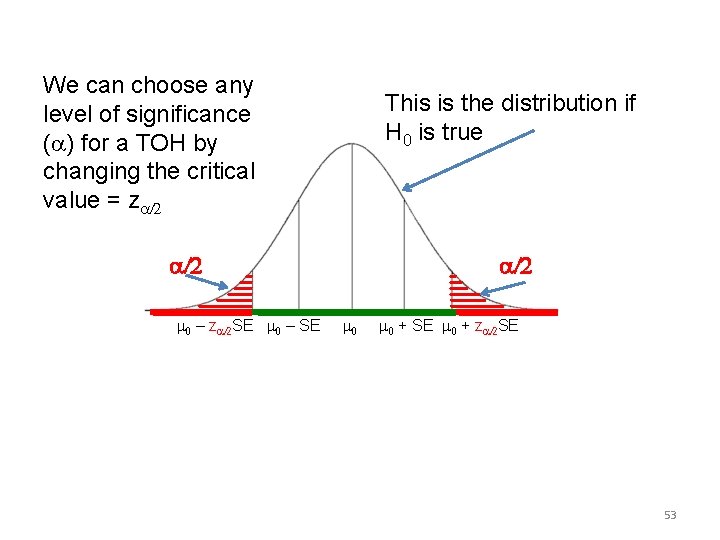
We can choose any level of significance (a) for a TOH by changing the critical value = za/2 This is the distribution if H 0 is true a/2 m 0 – za/2 SE m 0 – SE a/2 m 0 + SE m 0 + za/2 SE 53
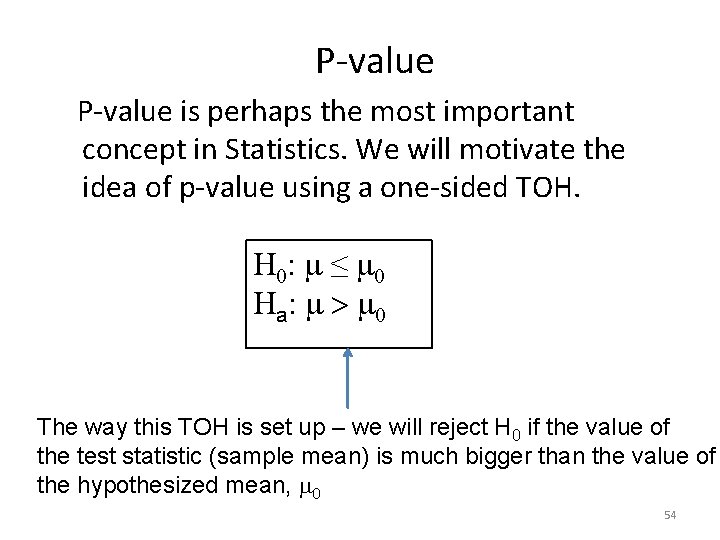
P-value is perhaps the most important concept in Statistics. We will motivate the idea of p-value using a one-sided TOH. H 0: m ≤ m 0 H a: m > m 0 The way this TOH is set up – we will reject H 0 if the value of the test statistic (sample mean) is much bigger than the value of the hypothesized mean, m 0 54
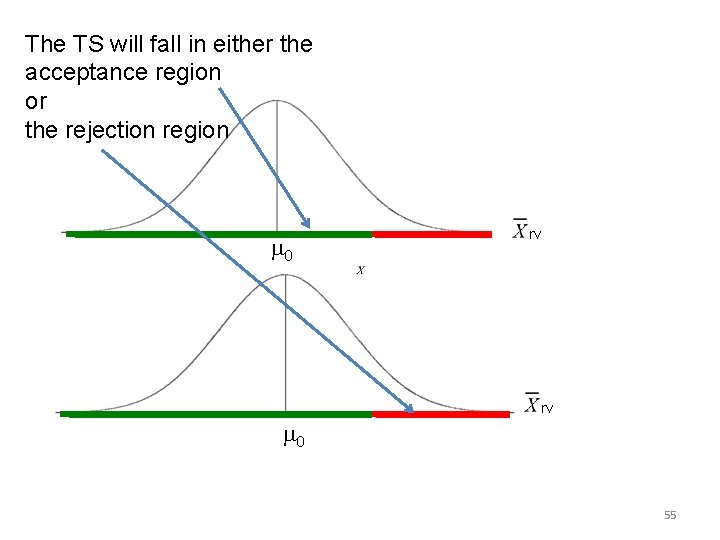
The TS will fall in either the acceptance region or the rejection region m 0 rv rv m 0 55
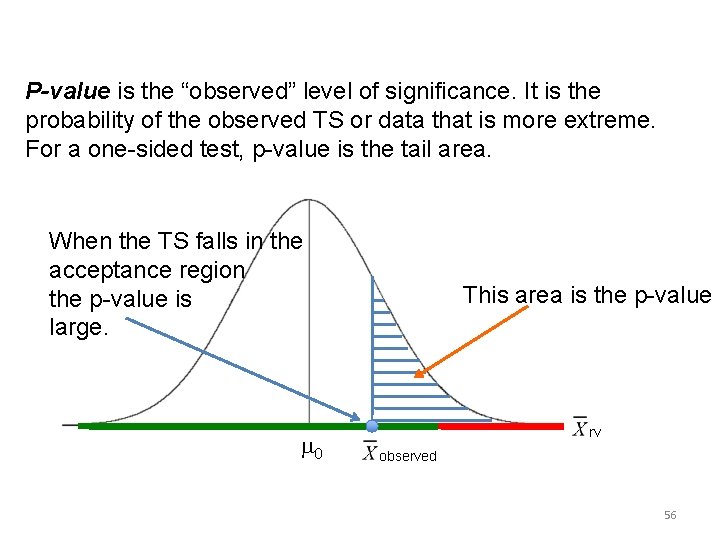
P-value is the “observed” level of significance. It is the probability of the observed TS or data that is more extreme. For a one-sided test, p-value is the tail area. When the TS falls in the acceptance region the p-value is large. m 0 This area is the p-value rv observed 56
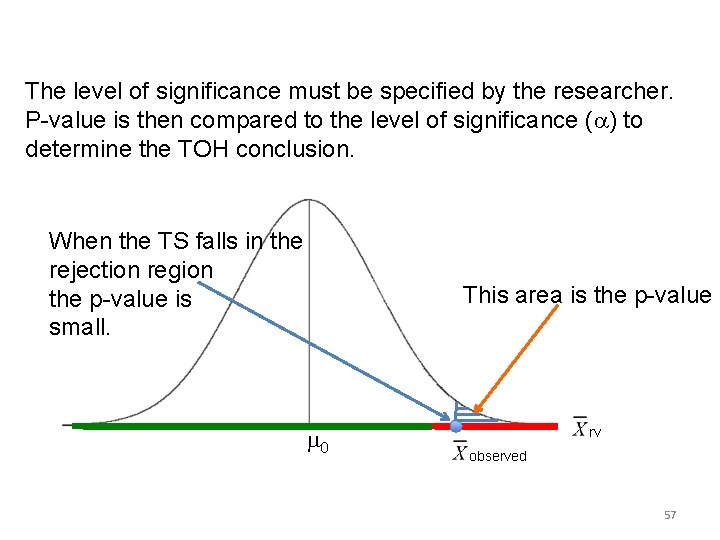
The level of significance must be specified by the researcher. P-value is then compared to the level of significance (a) to determine the TOH conclusion. When the TS falls in the rejection region the p-value is small. This area is the p-value m 0 rv observed 57
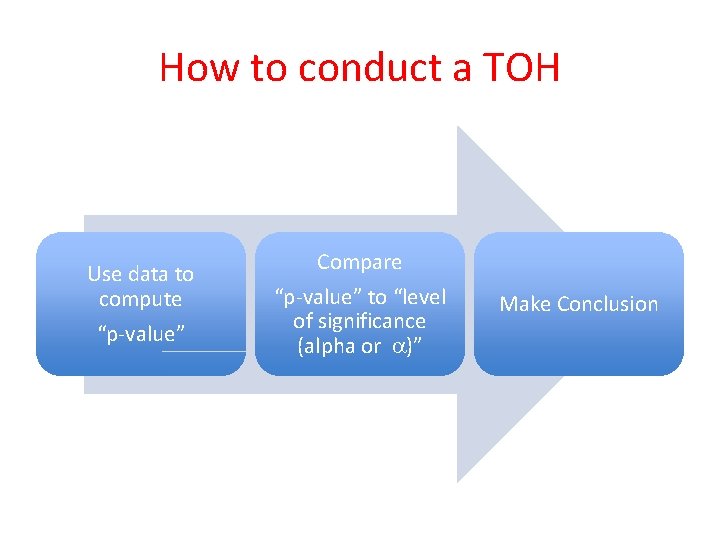
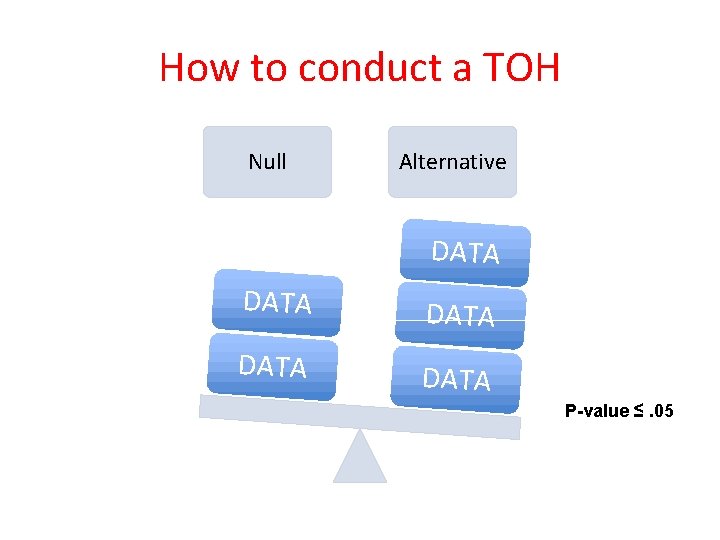
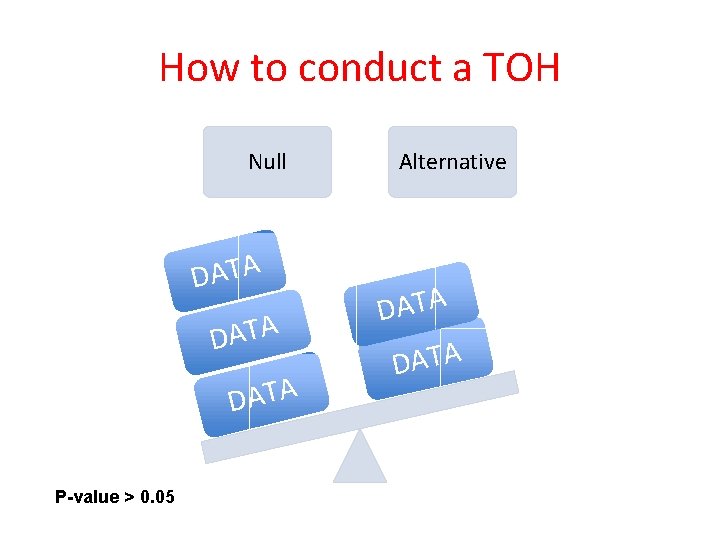
How to conduct a TOH Use data to compute “p-value” Compare “p-value” to “level of significance (alpha or a)” Make Conclusion
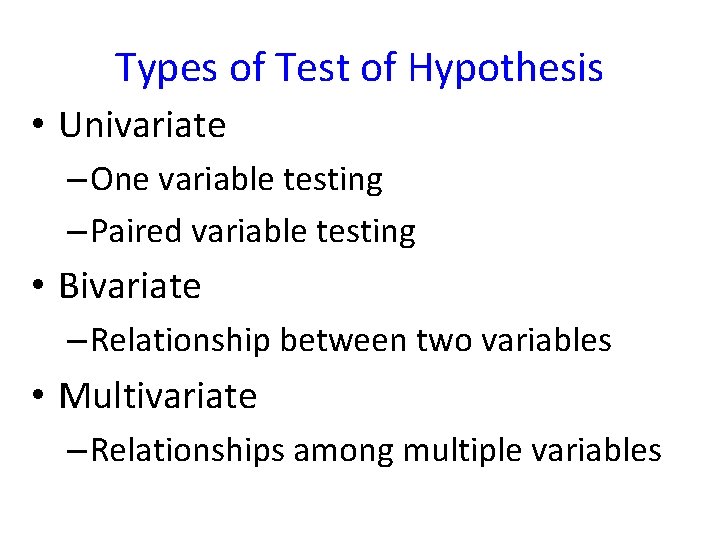
Types of Test of Hypothesis • Univariate – One variable testing – Paired variable testing • Bivariate – Relationship between two variables • Multivariate – Relationships among multiple variables
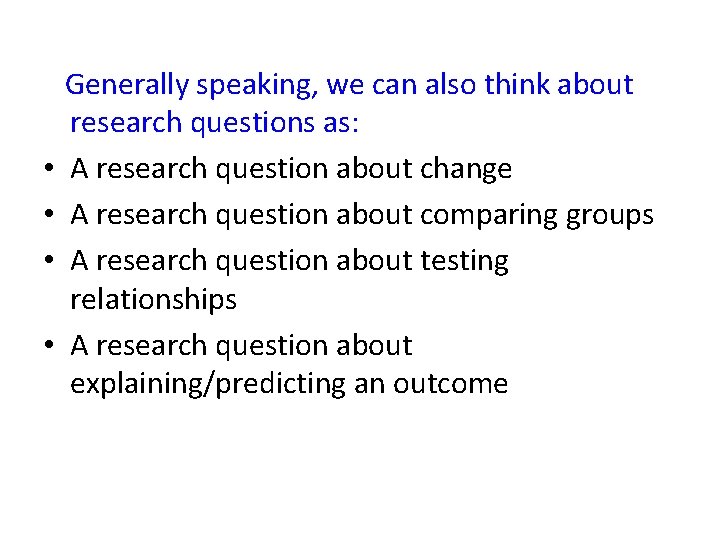
• • Generally speaking, we can also think about research questions as: A research question about change A research question about comparing groups A research question about testing relationships A research question about explaining/predicting an outcome
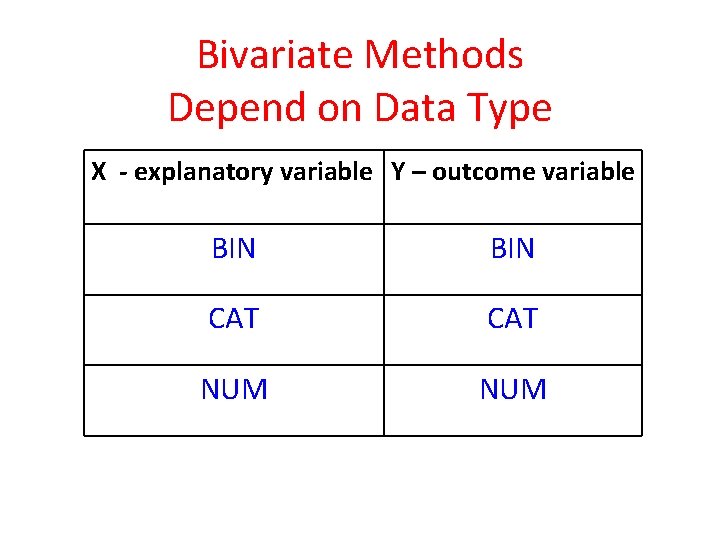
Bivariate Methods Depend on Data Type X - explanatory variable Y – outcome variable BIN CAT NUM
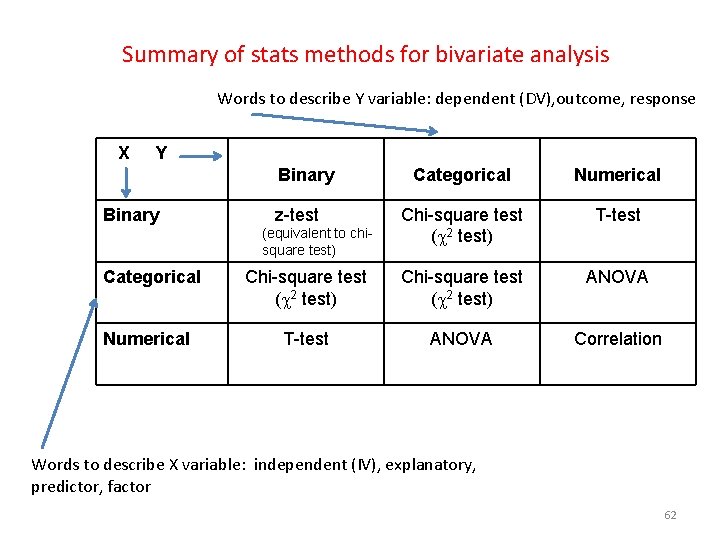
Summary of stats methods for bivariate analysis Words to describe Y variable: dependent (DV), outcome, response X Y Binary Categorical Numerical Chi-square test (c 2 test) T-test Chi-square test (c 2 test) ANOVA T-test ANOVA Correlation z-test (equivalent to chisquare test) Categorical Numerical Words to describe X variable: independent (IV), explanatory, predictor, factor 62
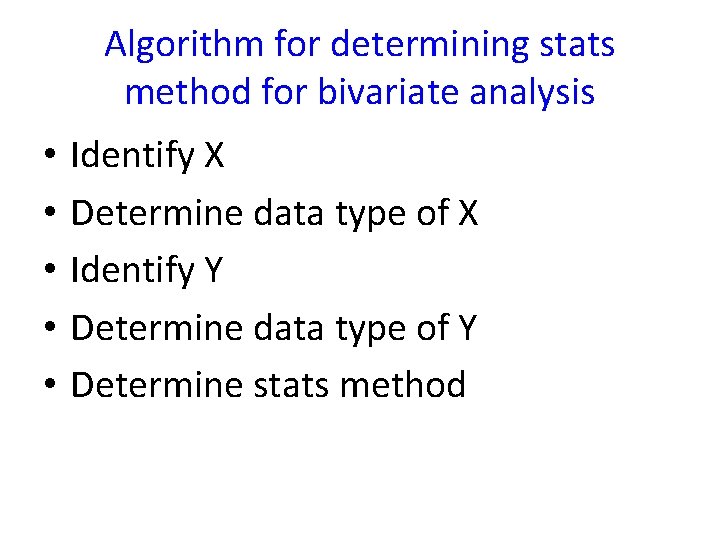
Algorithm for determining stats method for bivariate analysis • • • Identify X Determine data type of X Identify Y Determine data type of Y Determine stats method
? s A. B. C. D. Chi-square T-test ANOVA Correlation
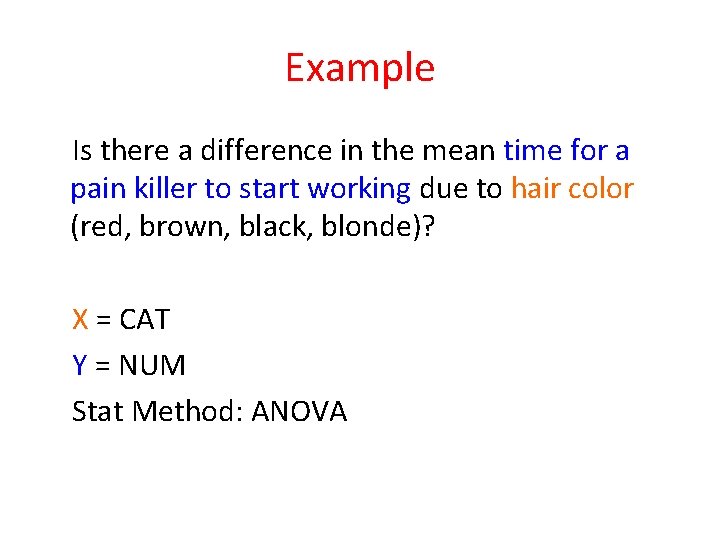
Example Is there a difference in the mean time for a pain killer to start working due to hair color (red, brown, black, blonde)? X = CAT Y = NUM Stat Method: ANOVA
A. Chi-square B. T-test C. ANOVA D. Correlation Does prenatal cocaine exposure affect IQ?
A. Chi-square B. T-test C. ANOVA D. Correlation Does incorporating SAS software into graduate level Statistics course improve statistics knowledge?
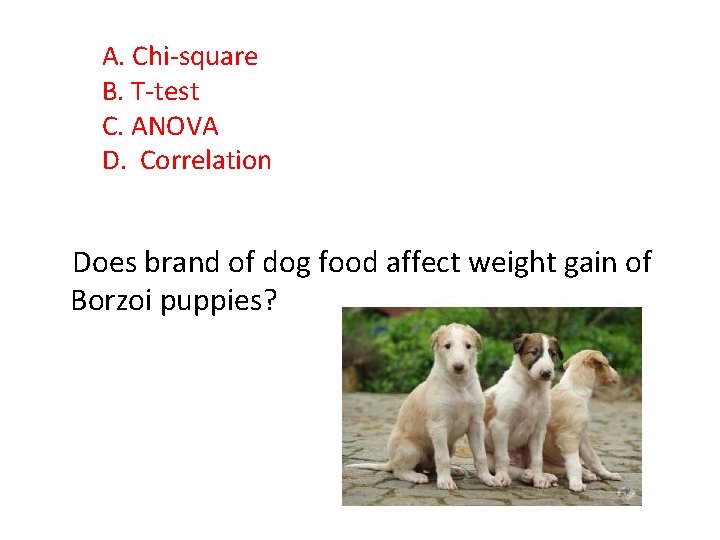
A. Chi-square B. T-test C. ANOVA D. Correlation Does brand of dog food affect weight gain of Borzoi puppies?
A. Chi-square B. T-test C. ANOVA D. Correlation Is favorite T. V. show related to college major?
A. Chi-square B. T-test C. ANOVA D. Correlation Is there a relationship between “screen time” and depression (as measured by Beck’s Depression Inventory)?
A. Chi-square B. T-test C. ANOVA D. Correlation Is the prevalence of ADHD the same for males and females?
A. Chi-square B. T-test C. ANOVA D. Correlation Does education level affect the incidence of POCD (Post-Operative Cognitive Dysfunction)?
Practical (Clinical) Versus Statistical Significance
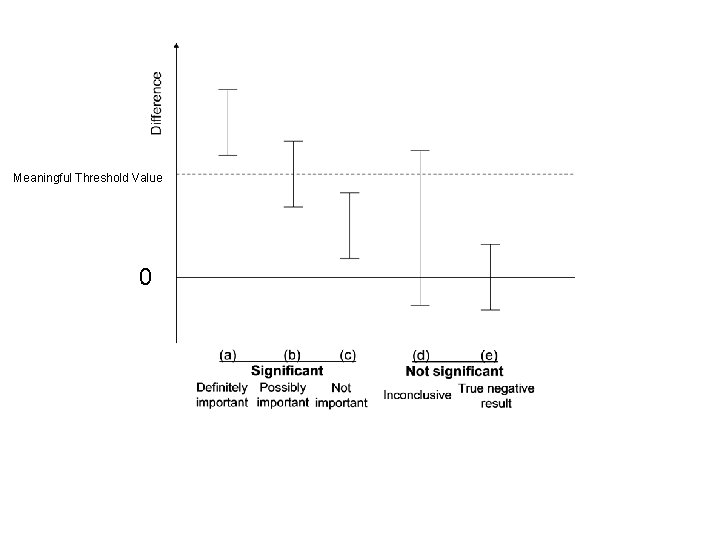
Meaningful Threshold Value 0
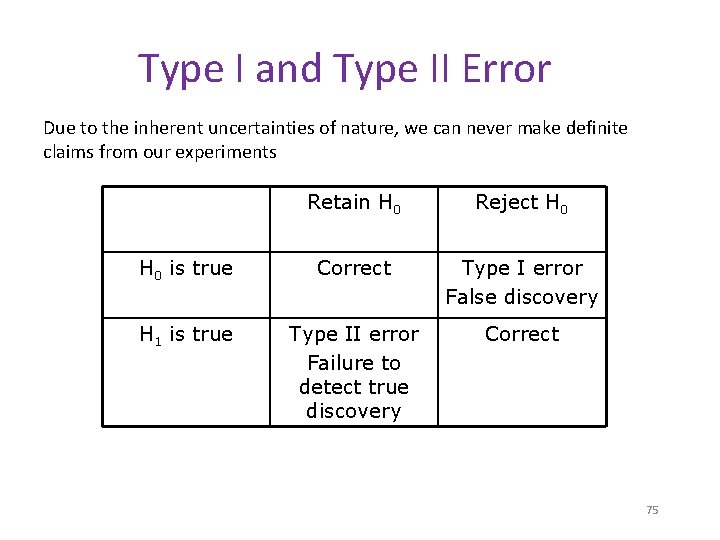
Type I and Type II Error Due to the inherent uncertainties of nature, we can never make definite claims from our experiments Retain H 0 Reject H 0 is true Correct Type I error False discovery H 1 is true Type II error Failure to detect true discovery Correct 75
Experimentwise Error
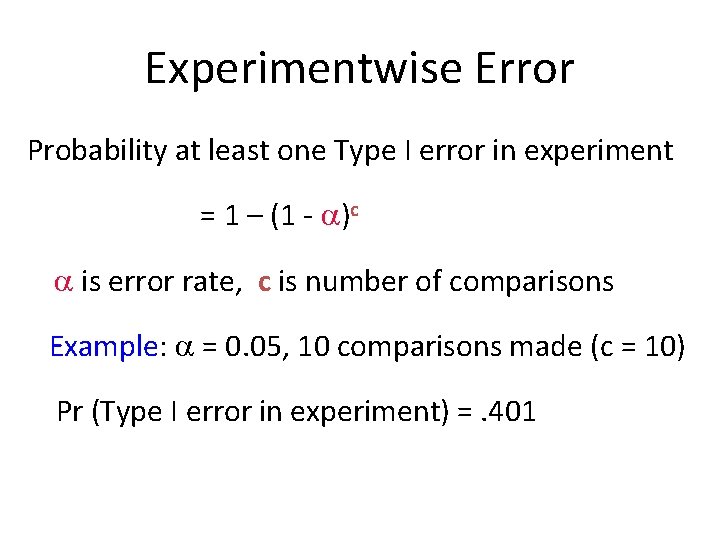
Experimentwise Error Probability at least one Type I error in experiment = 1 – (1 - a)c a is error rate, c is number of comparisons Example: a = 0. 05, 10 comparisons made (c = 10) Pr (Type I error in experiment) =. 401

Guess the Tables

Let’s Analyze Data

Happy First Birthday Claire!
- Slides: 80