Behavioral Modeling Chapter 8 Slide 1 Power Point

Behavioral Modeling Chapter 8 Slide 1 Power. Point Presentation for Dennis, Wixom & Tegarden Systems Analysis and Design Copyright 2001 © John Wiley & Sons, Inc. All rights reserved.

Key Ideas Behavioral models describe the internal dynamic aspects of an information system that supports business processes in an organization Key UML behavioral models are: sequence diagrams, collaboration diagrams, and statechart diagrams 2 Power. Point Presentation for Dennis, Wixom & Tegardem Systems Analysis and Design Copyright 2001 © John Wiley & Sons, Inc. All rights reserved.

BEHAVIORAL MODELS Slide 3 Power. Point Presentation for Dennis, Wixom & Tegarden Systems Analysis and Design Copyright 2001 © John Wiley & Sons, Inc. All rights reserved.

Purpose of Behavioral Models To depict the internal view of business processes To show the effects of varied processes on the system 4 Power. Point Presentation for Dennis, Wixom & Tegardem Systems Analysis and Design Copyright 2001 © John Wiley & Sons, Inc. All rights reserved.

Interaction Diagram Components Objects Operations Messages 5 Power. Point Presentation for Dennis, Wixom & Tegardem Systems Analysis and Design Copyright 2001 © John Wiley & Sons, Inc. All rights reserved.

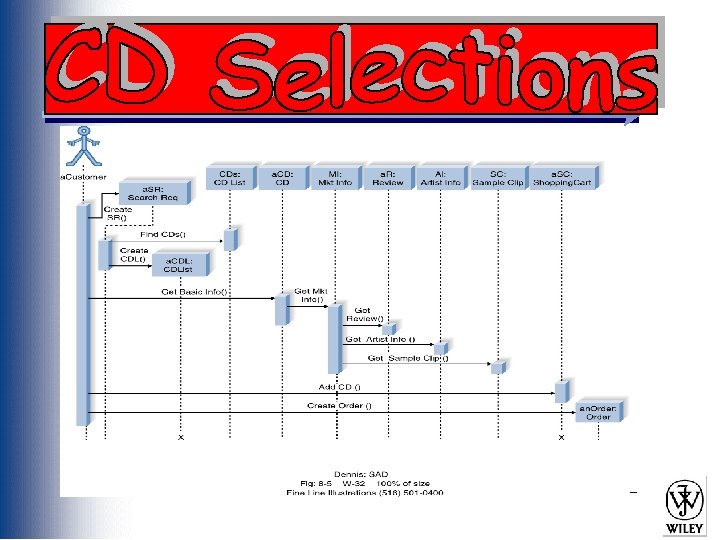
Sequence Diagrams Illustrate the objects that participate in a use-case Show the messages that pass between objects for a particular use-case 6 Power. Point Presentation for Dennis, Wixom & Tegardem Systems Analysis and Design Copyright 2001 © John Wiley & Sons, Inc. All rights reserved.

Example Sequence Diagram 7 Power. Point Presentation for Dennis, Wixom & Tegardem Systems Analysis and Design Copyright 2001 © John Wiley & Sons, Inc. All rights reserved.

Sequence Diagram Syntax AN ACTOR AN OBJECT an. Object: a. Class A LIFELINE A FOCUS OF CONTROL A MESSAGE a. Message() OBJECT DESTRUCTION 8 x Power. Point Presentation for Dennis, Wixom & Tegardem Systems Analysis and Design Copyright 2001 © John Wiley & Sons, Inc. All rights reserved.

Building a Sequence Diagram Determine the context of the sequence diagram Identify the participating objects Set the lifeline for each object Add messages Place the focus of control on each object’s lifeline Validate the sequence diagram 9 Power. Point Presentation for Dennis, Wixom & Tegardem Systems Analysis and Design Copyright 2001 © John Wiley & Sons, Inc. All rights reserved.

Normal Flow of Events: 1. Customer submits a search request to the system. 2. The system provides the customer a list of recommended CDs. 3. The customer chooses one of the CDs to find additional information. 4. The system provides the customer with basic information & CD Reviews 5. The customer calls the maintain order use case. 6. The customer iterates over 3 through 5 until finished shopping. 7. The customer executes the checkout use case. 8. The customer leaves the website.

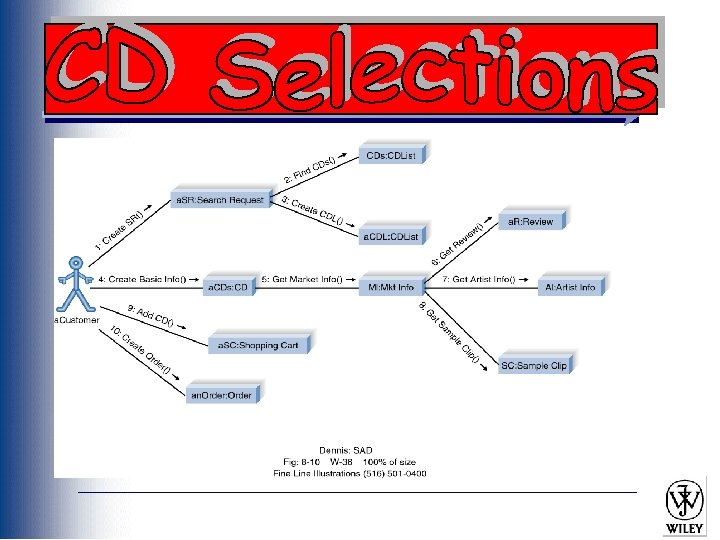
Collaboration Diagrams Essentially an object diagram that shows message passing relationships instead of aggregation or generalization associations. Emphasize the flow of messages among objects, rather than timing and ordering of messages 12 Power. Point Presentation for Dennis, Wixom & Tegardem Systems Analysis and Design Copyright 2001 © John Wiley & Sons, Inc. All rights reserved.

Example Collaboration Diagram 13 Power. Point Presentation for Dennis, Wixom & Tegardem Systems Analysis and Design Copyright 2001 © John Wiley & Sons, Inc. All rights reserved.

Collaboration Diagram Syntax AN ACTOR AN OBJECT an. Object: a. Class AN ASSOCIATION A MESSAGE 14 a. Message() Power. Point Presentation for Dennis, Wixom & Tegardem Systems Analysis and Design Copyright 2001 © John Wiley & Sons, Inc. All rights reserved.

“CRUD” Analysis Example 15 Power. Point Presentation for Dennis, Wixom & Tegardem Systems Analysis and Design Copyright 2001 © John Wiley & Sons, Inc. All rights reserved.

Building a Collaboration Diagram Determine the context of the collaboration diagram Identify the participating objects and their associations Layout objects and associations Add messages Validate the sequence diagram 16 Power. Point Presentation for Dennis, Wixom & Tegardem Systems Analysis and Design Copyright 2001 © John Wiley & Sons, Inc. All rights reserved.

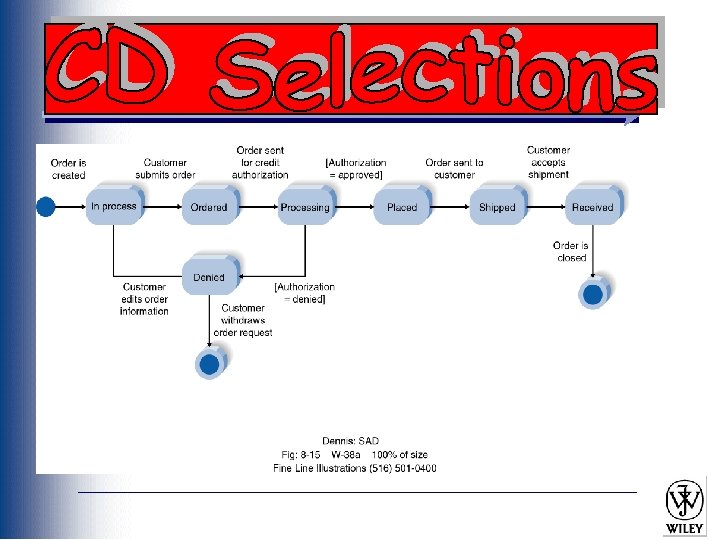
Statechart Diagrams The statechart diagram shows the different states of the object and what events cause the object to change from one state to another. 18 Power. Point Presentation for Dennis, Wixom & Tegardem Systems Analysis and Design Copyright 2001 © John Wiley & Sons, Inc. All rights reserved.

Components of Statechart Diagrams States Events Transitions Activities 19 Power. Point Presentation for Dennis, Wixom & Tegardem Systems Analysis and Design Copyright 2001 © John Wiley & Sons, Inc. All rights reserved.

Example Statechart Diagram 20 Power. Point Presentation for Dennis, Wixom & Tegardem Systems Analysis and Design Copyright 2001 © John Wiley & Sons, Inc. All rights reserved.

Statechart Diagram Syntax a. State A STATE AN INITIAL STATE A FINAL STATE AN EVENT an. Event A TRANSITION 21 Power. Point Presentation for Dennis, Wixom & Tegardem Systems Analysis and Design Copyright 2001 © John Wiley & Sons, Inc. All rights reserved.

Building Statechart Diagrams Set the context Identify the initial final, and stable states of the object Determine the order in which the object will pass through stable states Identify the events, actions, and guard conditions associated with the transitions Validate the statechart diagram 22 Power. Point Presentation for Dennis, Wixom & Tegardem Systems Analysis and Design Copyright 2001 © John Wiley & Sons, Inc. All rights reserved.

Your Turn What distinguishes the sequence diagram, the collaboration diagram, and the statechart diagram? For what sort of new applications might you need to develop all of these? Are there any new applications that would not need all of these diagrams for full development? 24 Power. Point Presentation for Dennis, Wixom & Tegardem Systems Analysis and Design Copyright 2001 © John Wiley & Sons, Inc. All rights reserved.

Summary Sequence diagrams illustrate the classes that participate in a use case and the messages that pass between them. Collaboration diagrams provide a dynamic view of the object-oriented system and accentuate message passing between collaborating actors and objects. Statechart diagrams show the different states that a single class passes through in response to events. 25 Power. Point Presentation for Dennis, Wixom & Tegardem Systems Analysis and Design Copyright 2001 © John Wiley & Sons, Inc. All rights reserved.
 sponsors a conference")
Expanding the Domain Each year the Association for Computing Machinery (ACM) sponsors a conference on object oriented programming. For details about future conferences and other ACM programs check: http: //oopsla. acm. org http: //www. acm. org 26 Power. Point Presentation for Dennis, Wixom & Tegardem Systems Analysis and Design Copyright 2001 © John Wiley & Sons, Inc. All rights reserved.
- Slides: 26