Behavioral Economics and Physical Activity HERO the American

Behavioral Economics and Physical Activity HERO & the American Journal of Health Promotion Webinar July 12, 2017 Mitesh Patel, MD, MBA, MS Kevin Volpp, MD, Ph. D Hosted by: Paul Terry, Ph. D @miteshspatel @kevin_volpp Not for reproduction without permission 1

Background • Physical activity is associated with lower rates of cardiovascular disease, diabetes, obesity, hypertension and all-cause mortality • However, less than 50% of US adults get enough regular physical activity to obtain health benefits • Our objective was to evaluate different way to design financial incentives to increase physical activity CDC. Facts on Physical Activity. CDC. Steps to Wellness.

Methods • Design – Randomized trial with 13 -week intervention and 13 -week follow-up – Teams of 4 members use a smartphone application to track step counts – Goal of 7000 steps per day; each participant received daily feedback • Sample – Adult employees from the University of Pennsylvania Health System in Philadelphia, PA • Primary outcome – Mean proportion of participant-days achieving goal of 7000 steps

Interventions • 50 th percentile feedback – Team’s average steps that week compared to the median • 75 th percentile feedback – Team’s average steps that week compared to top quartile • 50 th percentile feedback + lottery incentives – 1 in 5 chance of $35, 1 in 100 chance of $350, only if team ≥ 7000 steps • 75 th percentile feedback + lottery incentives – 1 in 5 chance of $35, 1 in 100 chance of $350, only if team ≥ 7000 steps

Results – Intervention Period 0. 60 0. 50 Mean 0. 45 Proportion of Participant- 0. 40 Days Achieving Goal 67% 0. 30 0. 27 0. 20 0. 10 0. 00 P= 0. 67 75 th 50 th P= 0. 19 P= 0. 01 75 th + incentives 50 th + incentives

Summary • Smartphones were an effective method to track physical activity and deploy interventions in a sedentary population • Social comparison to the 50 th percentile with incentives was most effective for increasing physical activity • Future studies to sustain higher levels of activity – Testing different frequencies of financial incentives – Further leverage social incentives

Framing Financial Incentives to Increase Physical Activity • Control • Standard gain framing – Each day you meet the 7000 step goal you earn $1. 40 • Combined lottery – Each day you have about a 1 in 5 chance of winning $5 and a 1 in 100 chance of winning $50 (expected value ~ $1. 40 per day) Physical activity was measured by smartphones that participants carried with them for a 3 -month intervention and 3 -month follow-up period • Loss framing – Each month you get $42 placed in a virtual account and you lose $1. 40 each day you don’t meet the 7000 step goal Patel et al. Ann Intern Med. 2016

Framing Financial Incentives to Increase Physical Activity 0. 60 50% Relative Increase 0. 50 0. 40 0. 30 0. 20 0. 10 Physical activity was measured by smartphones that participants carried with them for a 3 -month intervention and 3 -month follow-up period 0. 00 Control P= 0. 25 P= 0. 16 P= 0. 001 Gain Incentive Lottery Incentive Loss Incentive Patel et al. Ann Intern Med. 2016

Individual vs. Team-Based Financial Incentives • Individual incentive – If team selected as winner, each individual is rewarded $50 if he or she individually achieved the 7000 step goal on the prior day • Team incentive – If team selected as winner, each individual is rewarded $50 if all members of the team achieved the 7000 step goal on the prior day • Combined incentive – If team selected as winner, each individual is rewarded $20 if he or she individually achieved the 7000 step goal on the prior day and $10 for each additional team member that achieved the goal

Individual vs. Team-Based Financial Incentives 0. 50 95% Relative Increase 0. 40 Mean Proportion of Participant. Days Achieving 0. 30 Goal 0. 20 0. 10 0. 00 P= 0. 13 Control P= 0. 96 Individual P = Team Incentive P= 0. 13 0. 96 Incentive P< 0. 001 Combined P < Incentive 0. 001

We can’t assume information alone or economic rationality will prevail Behavioral Economics Standard Economics Information • If people know what to do, they will do it. • People are perfectly rational. • Size of reward is what matters @kevin_volpp • People are predictably irrational. • Decisions affected by present bias, loss framing, emotions, social context, inertia • Incentive delivery and design and choice environment are critical
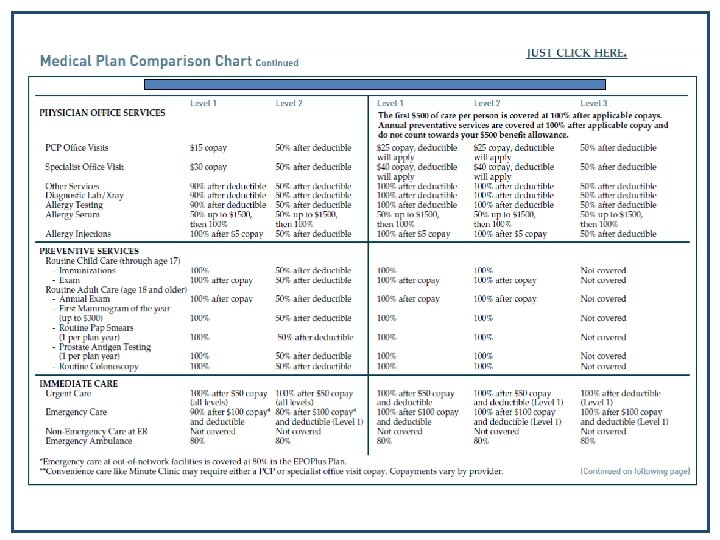

Making it easier: Simplifying plan design Copayments Deductibles Coinsurance Dollar limits Allowances HRAs Maximum out of pocket Visit limits FSAs HSAs Personal benefit allowances How much is 10% of an ER visit? I don’t know how much I have spent this year and don’t know what 100% of an ER visit costs. . .

Background based on Loewenstein G, Friedman JY, Mc. Gill B, Ahmad S, Beshears J, Choi J, Kolstad J, Laibson D, Madrian B, List J, Volpp KG: Consumers' Misunderstanding of Health Insurance Journal of Health Economics 32(5): 850 -862, June 2013

700 Good Reasons to Quit Launched nationwide June 1, 2015

Time-limited incentives with sustained effects Price J, Loewenstein G, Volpp KG. Journal of Health Economics. 2015

VAL Health Rewards drives sustained engagement for walking programs Walking Program Weekly Engagement Rate 80% 70% 60% 56. 8% 61. 8% 62. 6% 62. 4% 60. 9% 61. 3% 7 8 9 10 11 50% 40% 30% 20% 10% 0% 6 Week VAL Health Case Study Not for reproduction without permission

VAL Health Rewards outperforms traditional financial incentive designs Standard Gift Card Raffle Premium Adjustment Portal Registration Telehealth App Registration Tobacco Cessation Engagement Direct Mail Email 69% 50% 30. 5% 0. 3% 3. 3% 7. 8% $10 i. Tunes $10 Amazon $9. 94 VAL Gift Card Health Rewards 2. 4 x higher registration than Amazon Gift Card 2. 6% $1. 10 Raffle- $6. 50 VAL Health Based Incentives Rewards 11. 7 x higher registration than raffle-based incentive VAL Health Case Study Not for reproduction without permission $1000 Surcharge $110 VAL Health Rewards 90% decrease in incentives over premium adjustment

Poll Question 1 A health insurance plan can be thought of as a health incentive plan tied to use of health services. How much do you use valuebased principles in your designs: A. B. C. D. Lowered cost-sharing for high value services Raised cost-sharing for low value services Did a combination of A & B Did neither

Poll Question 2 What do the stakeholders behind your wellness programs consider most important, participation rates or health outcomes? A. B. C. D. Primary focus is on Participation Somewhat more focused on Participation Equal interest in Participation and Outcomes Primary focus is on Outcomes

Poll Question 3 Based on the evidence, what method do you consider the most effective for changing behavior? A. B. C. D. Attainment incentives Deposit Contract incentives Lottery incentives Tailoring methods according to demographic group differences

Poll Question 4 The NBGH Survey in 2016 indicates use of financial incentives for wellness is waning in wellness programs. Why? A. B. C. D. E. They haven’t been effective Too much backlash from employees Too much negative press from media We’ve moved on to other engagement strategies I really have no idea

Poll Question 5 An organization made the national news providing incentives that a privacy advocacy group considered involuntary and “incredibly coercive. ” Where do you draw the line between incentivizing wellness and coercion? A. B. C. D. E. $300 $600 $1000 $2, 000 It’s all voluntary so the higher incentive the better

Poll Question 6 An organization made the national news providing incentives that a privacy advocacy group considered involuntary and “incredibly coercive. ” Where do you draw the line between incentivizing wellness and coercion? A. B. C. D. E. $300 $600 $1000 $2, 000 It depends on the organization’s culture

Research chibe. upenn. edu volpp 70@wharton. upenn. edu mpatel@upenn. edu Advisory services www. valhealth. com kvolpp@valhealth. com mpatel@upenn. edu

SAVE-THE-DATE Upcoming HERO Webinars Wednesday, July 12 - 12: 00 pm Central Awakening Compassion at Work: New Avenues for Linking Well-Being and Performance Monica Worline, Ph. D, Stanford University’s Center for Compassion and Altruism Research Thursday, August 10 – 12: 00 pm Central Building Cultures of Resilience One Manager at a Time Megan Hammes, MS, MCHES, The University of Iowa Sarah Johnson, Ph. D, Pro-Change Behavior Systems, Inc.
- Slides: 26