BEEF QUALITY YIELD and FEEDER CATTLE GRADES Grading

BEEF QUALITY, YIELD and FEEDER CATTLE GRADES

Grading vs. Inspection

Meat Inspection & Grading n. What’s the difference? To simplify: q. For meat inspection, think wholesomeness q. For grading, think quality

Inspection n Wholesomeness n USDA Food Safety & Inspection Service n Veterinarian n Mandatory n Taxpayer funded Grading n Value – Quality and Yield n USDA Agricultural Marketing Service n Grader n Voluntary n Packer pays per hour

Sex Classes of Beef Carcasses n. Heifer n. Steer n. Cow n. Bullock n. Bull

Palatability Attributes n Tenderness n Flavor n Juiciness
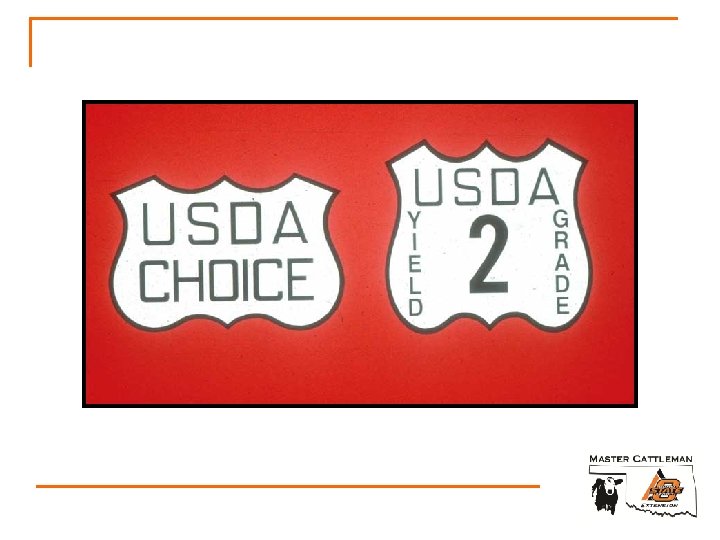
 Prime Choice")
USDA Quality Grades n Grades of youthful carcasses (< 30 mos. ) Prime Choice Select Standard n Grades of mature carcasses (> 42 mos. ) Commercial Utility Cutter Canner

USDA Quality Grades Based on consideration of two general factors: 1. Physiological maturity n n Skeletal Lean 2. Marbling (intramuscular fat) n n Amount Distribution

USDA BEEF GRADES Maturity Groups A B C D E

Physiological Maturity vs Chronological Maturity n Physiological maturity of the carcass is an estimate of the actual chronological age of the animal USDA Maturity Score A B C D E Estimated chronological age 9 to 30 months 30 to 42 months 42 to 72 months 72 to 96 months 96 or more months
 n Evaluated in")
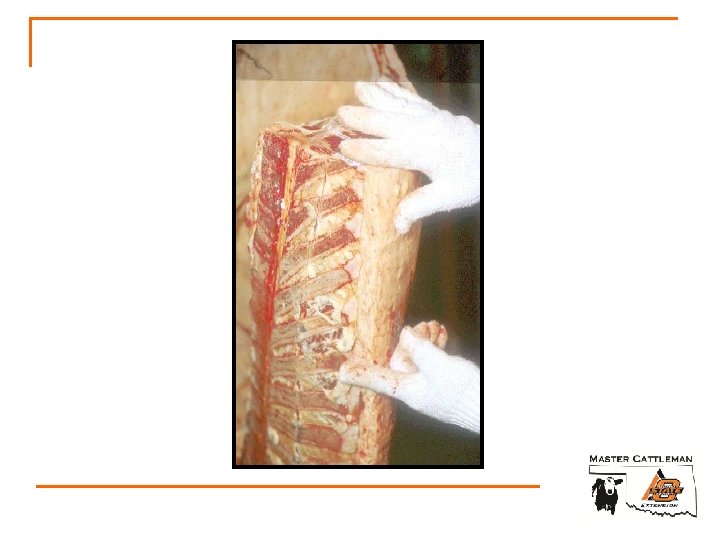
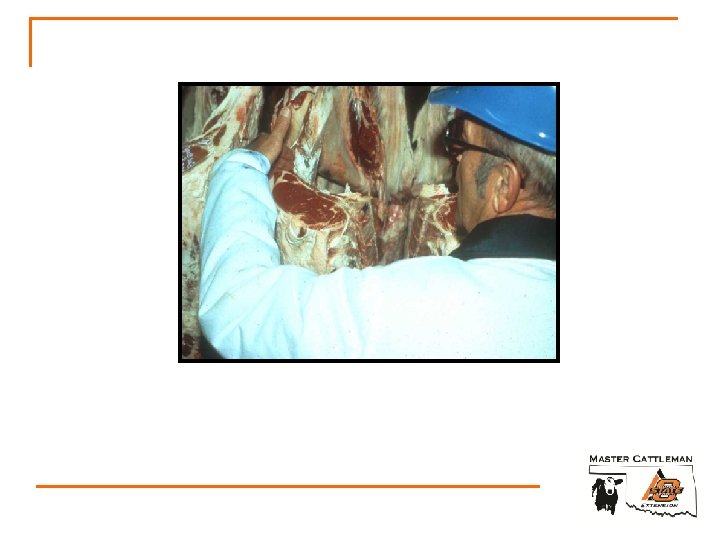
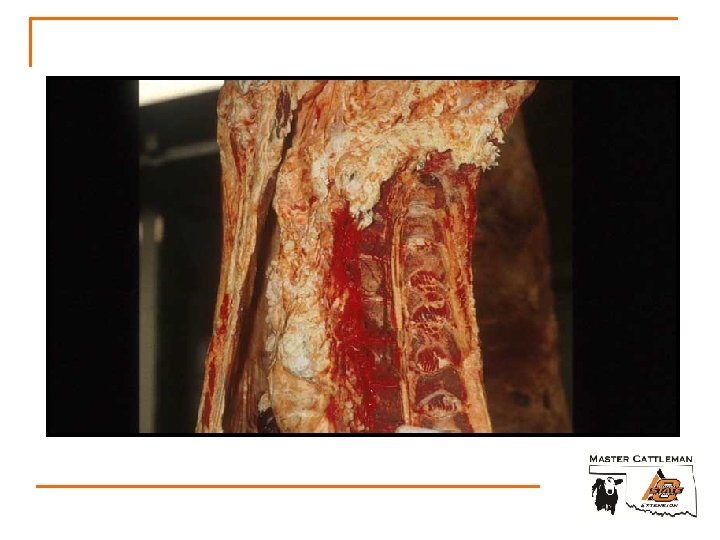
USDA BEEF GRADES Marbling n Fat within the muscle (Intramuscular fat) n Evaluated in the ribeye between the 12 th-13 th ribs

Marbling Slight Small Modest Moderate Slightly Abundant Moderately Abundant

Relationship Between Marbling, Maturity, and Carcass Quality Grade 1 A 3 Slightly Abundant C 2 Maturity D E Prime Moderate Modest B Commercial Choice Small Slight Select Utility Traces Practically Devoid 1 Assumes Cutter Standard that firmness of lean is developed with the degree of marbling and that the carcass is not a “dark cutter. ” increases from the left to right (A through E). 3 The A maturity portion of the figure is the only portion applicable to bullock carcasses. 2 Maturity

Quality Grade Distribution

Yield Grade n. Indicate carcass cutability n. Yield of boneless, closely trimmed retail cuts from round, loin, rib, and chuck

USDA Yield Grades

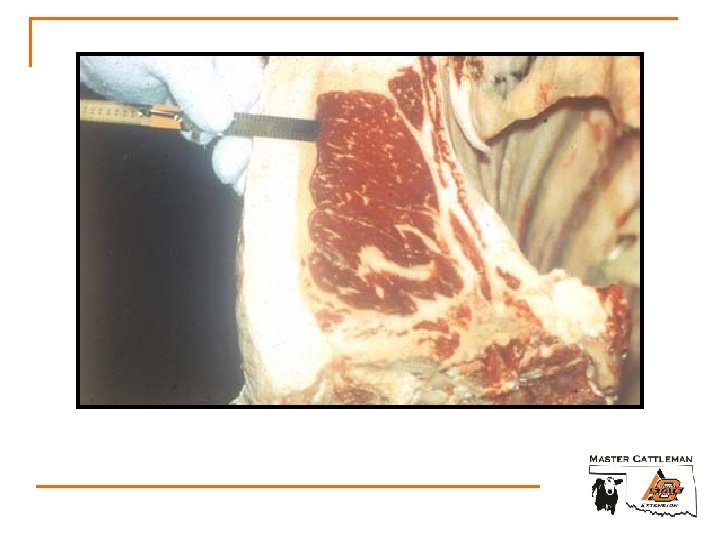
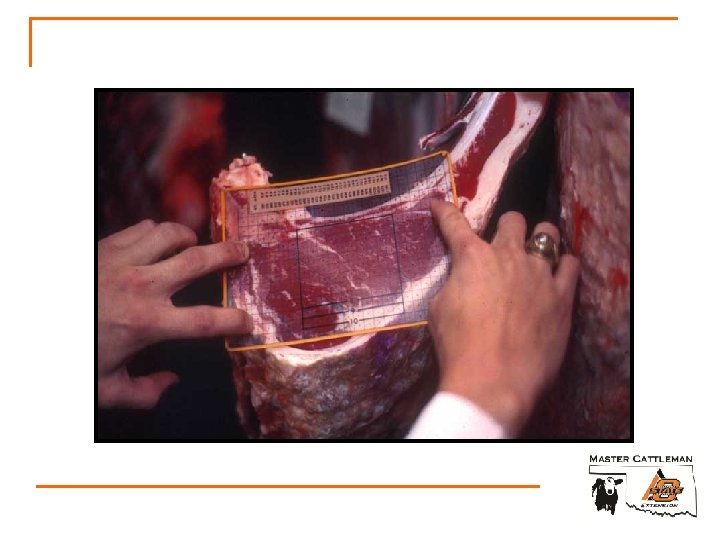
USDA BEEF GRADES Yield Grade Factors n Thickness of fat over the ribeye n Ribeye area n Percent kidney, heart, and pelvic fat n Hot carcass weight
")
USDA BEEF GRADES Fat Thickness (12 th rib--adjusted)

USDA BEEF GRADES Preliminary Yield Grade PYG FAT 2. 0 2. 5 3. 0 3. 5 4. 0 4. 5 0. 00 0. 20 0. 40 0. 60 0. 80 1. 00

USDA BEEF GRADES Ribeye Area

USDA BEEF GRADES HCW 500 525 550 575 600 625 650 675 REA/HCW Schedule REA 09. 8 10. 1 10. 4 10. 7 11. 0 11. 3 11. 6 11. 9 HCW 700 725 750 775 800 825 850 875 REA 12. 2 12. 5 12. 8 13. 1 13. 4 13. 7 14. 0 14. 3

USDA BEEF GRADES REA/HCW Schedule HCW REA 500 9. 8 600 11. 0 700 12. 2 800 13. 4 +/- 3. 0 Sq In = +/- 1. 0 YG

USDA BEEF GRADES KPH Fat
 = 51. 34 –")
USDA Yield Grade % BCTRC (Boneless closely trimmed retail cuts) = 51. 34 – 5. 784(Adj. Fat) – 0. 462(KPH) + 0. 740(REA) – 0. 0093(HCW) USDA YG = 2. 5 + 2. 5(Adj. Fat) + 0. 2(KPH) - 0. 32(REA) + 0. 0038(HCW) USDA YG %BCTRC 1 52. 3 % or more 2 52. 3 - 50. 0% 3 50. 0 - 47. 7% 4 47. 7 - 45. 4% 5 45. 4% or l-ess

USDA Feeder Cattle Grading n Based on: q Frame size q Muscle thickness

Frame size n Large n Medium n Small Endpoint weight by Frame size (expected harvest weight to grade USDA Low Choice) Small Medium Large Steers < 1, 100 lbs 1, 100 – 1, 250 > 1, 250 lbs Heifers < 1, 000 lbs 1, 000 – 1, 150 > 1, 150 lbs

Muscle Thickness n No. 1 q Predominant beef breeding; healthy and moderately thick n No. 2 q High proportion of beef breeding; healthy and slightly thick n No. 3 q Healthy but thin throughout n No. 4 q Less thickness than required for No. 3 (no muscle!)

Informational Web Sites Beef Grading www. ams. usda. gov/lsg/mgc/beefrole. htm Food Safety and Inspection Service www. fsis. usda. gov The Role of USDA’s Beef Grading Program in the Marketing of Beef http: //www. ams. usda. gov/lsg/mgc-pubs. htm OSU Meat Science home page http: //www. ansi. okstate. edu/meats/

- Slides: 36