Bayesian MultilevelLongitudinal Models Using Stata Chuck Huber Ph

Bayesian Multilevel/Longitudinal Models Using Stata Chuck Huber, Ph. D Stata. Corp chuber@stata. com Yale University November 2, 2018

Outline • • Introduction to Multilevel Models Introduction to Longitudinal Models Introduction to Bayesian Analysis Bayesian Multilevel/Longitudinal Models

The Simulated Dataset • This dataset contains repeated measurements of test scores on children from age 12 -18 • The children are nested within classroom (admittedly not very realistic).

The Simulated Dataset

The Simulated Dataset

The Simulated Dataset

The Simulated Dataset

The Simulated Dataset

Outline • • Introduction to Multilevel Models Introduction to Longitudinal Models Introduction to Bayesian Analysis Bayesian Multilevel/Longitudinal Models

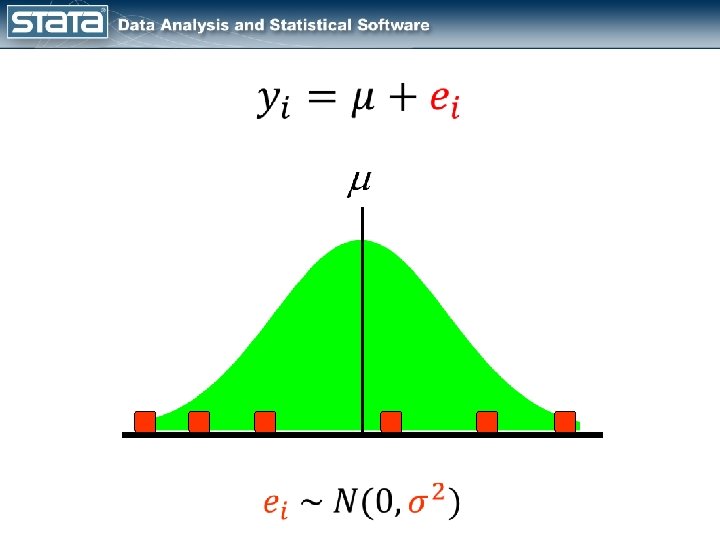
Single Level Models yi = y. Child We assume that observations of all children are independent of each other

Single Level Models

Single Level Models Observed Fixed Random

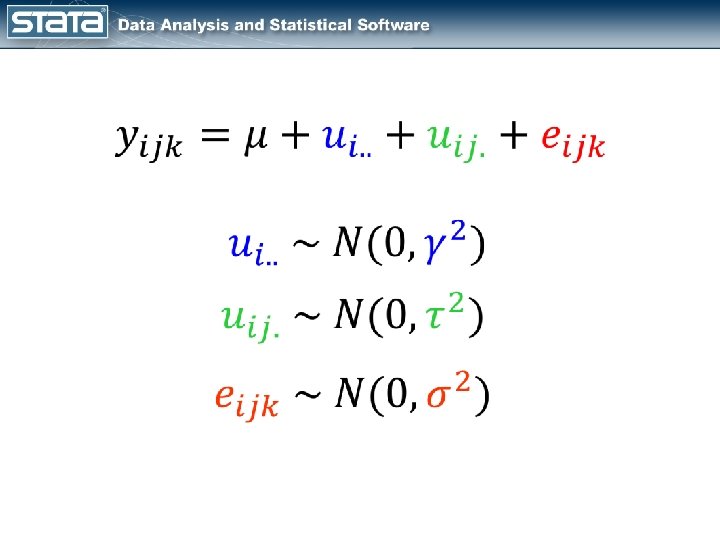
Three Level Models Classroom Child Observations Repeated observations within children from the same classroom may be correlated

Three Level Models Repeated observations within child will vary about each child’s mean.

Three Level Models Children’s means from the same classroom will vary about their classroom mean.

Three Level Models Classroom means will vary about the grand mean.

Three Level Models Level 3 Level 2 Level 1 We can refer to the nesting structure in terms of “Levels”…

i j k yijk = yclassroom, child, observation

Three Level Models Observed Fixed Random

Three Level Models

Three Level Models Observed Fixed Random

child mean classroom mean

child mean classroom mean
 18")
child mean classroom mean grand mean 10 Age (years) 18
 80")
Test Score child mean classroom mean grand mean 10 Age (years) 80

an Test Score child me ean m m o o r s clas 10 Age (years) 18
 Test Score")
xed sl i f ( n a e hild m ope) Test Score c 10 Age (years) 18
 d e x i f ( n a child me")
Test Score slope) d e x i f ( n a child me e) p o sl m o nd a r ( an e m d l i ch 10 Age (years) 18
 _ ( n a e child m e p slo")
Test Score cons) _ ( n a e child m e p slo dom n a ild r ch ns) (_co n a e m m classroo 10 Age (years) 18

How do we do this in Stata?
 50")
Test Score child mean classroom mean grand mean 30 Age (years) 50

. mixed Test. Score || classroom: || child: ---------------------------------------Test. Score | Coef. Std. Err. z P>|z| [95% Conf. Interval] -------+--------------------------------_cons | 69. 89633. 5487339 127. 38 0. 000 68. 82083 70. 97183 -----------------------------------------------------------------------------Random-effects Parameters | Estimate Std. Err. [95% Conf. Interval] ---------------+------------------------classroom: Identity | var(_cons) | 3. 475057 1. 909402 1. 183754 10. 20146 ---------------+------------------------child: Identity | var(_cons) | 69. 95854 4. 852896 61. 0653 80. 14696 ---------------+------------------------var(Residual) | 134. 3347 2. 931422 128. 7103 140. 2048 ---------------------------------------
 Child. Effect, reffects relevel(child) Residual,")
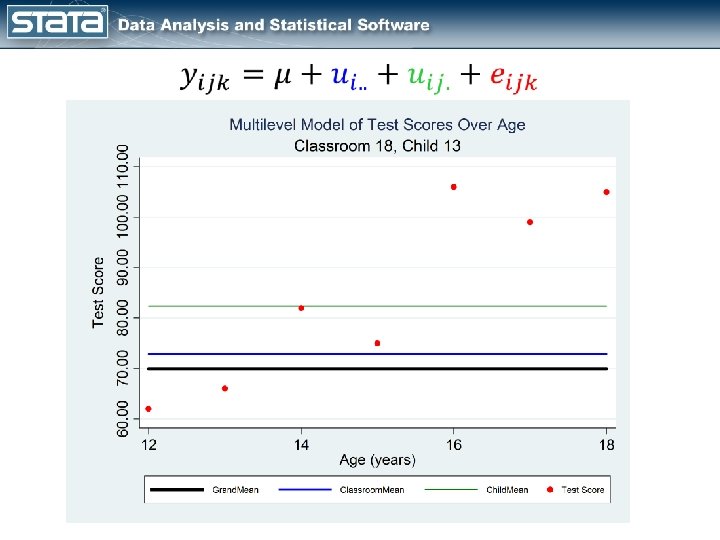
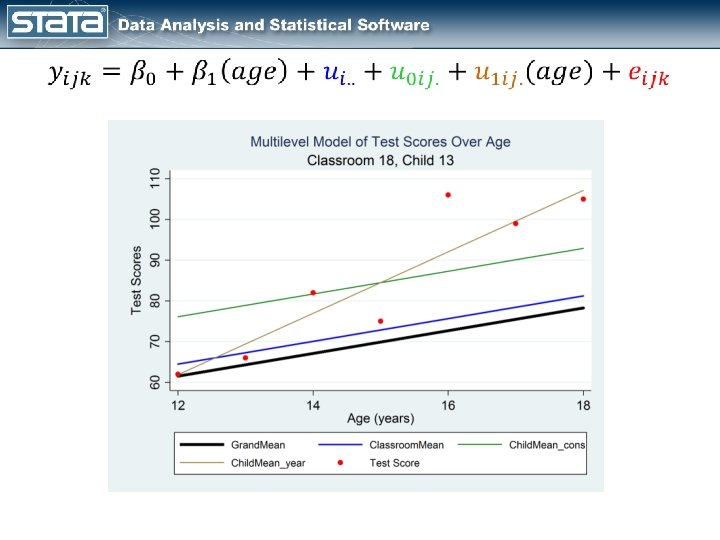
predict Grand. Mean, xb Classroom. Effect, reffects relevel(classroom) Child. Effect, reffects relevel(child) Residual, residuals list classroom child age Test. Score Grand. Mean Classroom. Effect Child. Effect Residual /// if classroom==18 & child==13, sep(0) noobs abbrev(18) +----------------------------------------------+ | classroom child age Test. Score Grand. Mean Classroom. Effect Child. Effect Residual | |----------------------------------------------| | 18 13 12 62 69. 90 2. 96 9. 53 -20. 39 | | 18 13 13 66 69. 90 2. 96 9. 53 -16. 39 | | 18 13 14 82 69. 90 2. 96 9. 53 -0. 39 | | 18 13 15 75 69. 90 2. 96 9. 53 -7. 39 | | 18 13 16 106 69. 90 2. 96 9. 53 23. 61 | | 18 13 17 99 69. 90 2. 96 9. 53 16. 61 | | 18 13 18 105 69. 90 2. 96 9. 53 22. 61 | +----------------------------------------------+ . display 69. 90 + 2. 96 + 9. 53 - 20. 39 62
 Test Score cons _ ( n a e child m e p")
) Test Score cons _ ( n a e child m e p slo dom n a ild r ch cons) _ ( n a e room m class 10 Age (years) 18
 ---------------------------------------Test. Score")
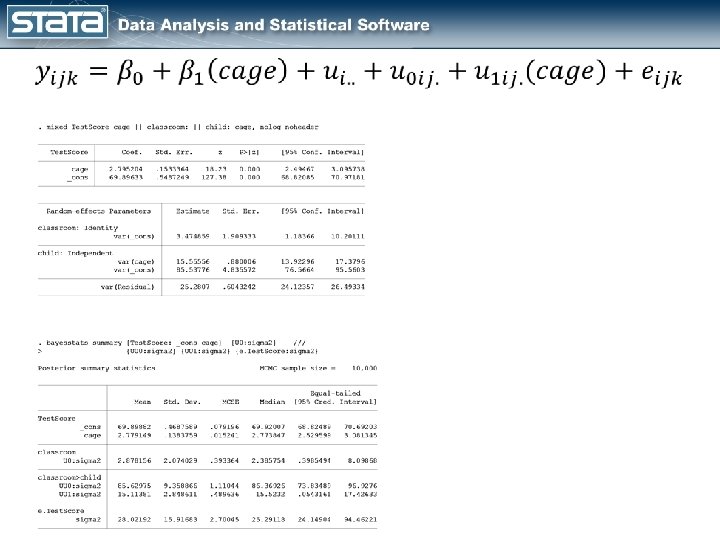
. mixed Test. Score cage, || classroom: || child: cage, cov(indep) ---------------------------------------Test. Score | Coef. Std. Err. z P>|z| [95% Conf. Interval] -------+--------------------------------cage | 2. 795204. 1533364 18. 23 0. 000 2. 49467 3. 095738 _cons | 69. 89633. 5487249 127. 38 0. 000 68. 82085 70. 97181 -----------------------------------------------------------------------------Random-effects Parameters | Estimate Std. Err. [95% Conf. Interval] ---------------+------------------------classroom: Identity | var(_cons) | 3. 474859 1. 909333 1. 18366 10. 20111 ---------------+------------------------child: Independent | var(cage) | 15. 55556. 880006 13. 92296 17. 3796 var(_cons) | 85. 53776 4. 835572 76. 5664 95. 5603 ---------------+------------------------var(Residual) | 25. 2807. 6043242 24. 12357 26. 49334 ---------------------------------------
3)) mariginsplot")
margins, at(cage=(-3(1)3)) mariginsplot

Outline • • Introduction to Multilevel Models Introduction to Longitudinal Models Introduction to Bayesian Analysis Bayesian Multilevel/Longitudinal Models

What is Bayesian Statistics? • See slides from 2 pm talk

Outline • • Introduction to Multilevel Models Introduction to Longitudinal Models Introduction to Bayesian Analysis Bayesian Multilevel/Longitudinal Models

fvset base none classroom fvset base none child #delimit ; bayesmh Test. Score cage i. classroom#i. child#c. cage, noconstant likelihood(normal({var_e_ijk})) prior({Test. Score: i. classroom}, prior({Test. Score: i. classroom#i. child#c. cage}, normal({Test. Score: _cons}, {var_u_i} )) normal(0 , {var_u_0 ij} )) normal(0 , {var_u_1 ij} )) prior({Test. Score: _cons}, prior({Test. Score: cage}, normal(0, 100)) prior({var_u_i}, prior({var_u_0 ij}, prior({var_u_1 ij}, prior({var_e_ijk}, igamma(0. 01, block({Test. Score: i. classroom}, block({Test. Score: i. classroom#i. child#c. cage}, block({Test. Score: _cons}, block({Test. Score: cage}, block({var_e_ijk}, block({var_u_0 ij}, block({var_u_1 ij}, block({var_u_i}, reffects) gibbs) gibbs) 0. 01)) exclude({Test. Score: i. classroom} {Test. Score: i. classroom#i. child#c. cage}) burnin(2500) mcmcsize(10000) thinning(1) rseed(1234) ; #delimit cr

bayes: mixed Test. Score cage || classroom: || child: cage
 burnin(10000) mcmcsize(20000) saving(Rand. Slope 2. dta, replace) prior({Test. Score:")
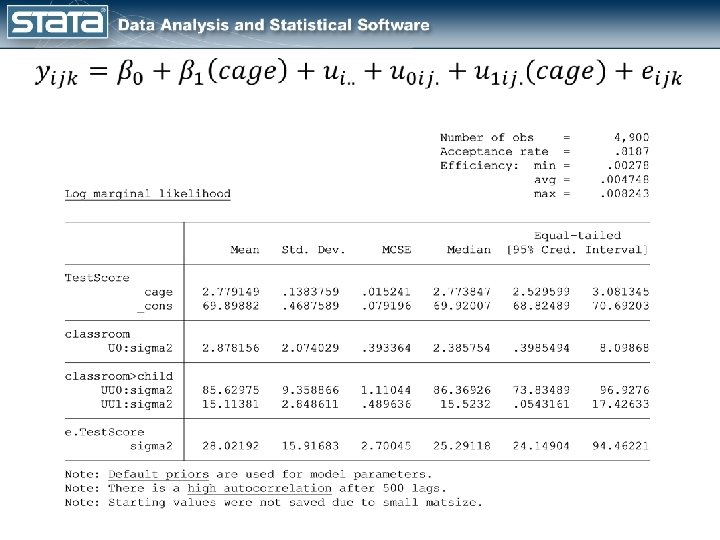
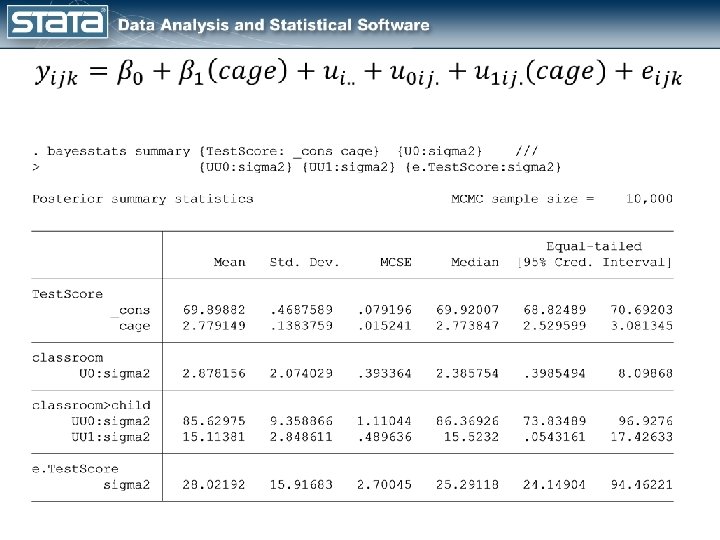
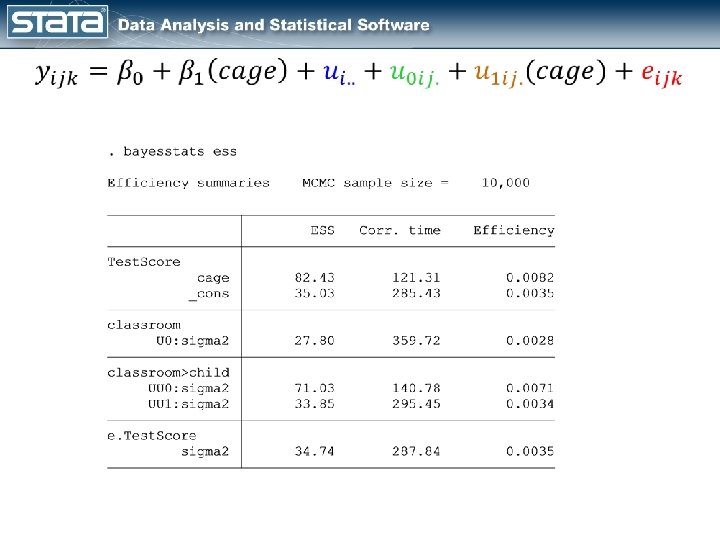
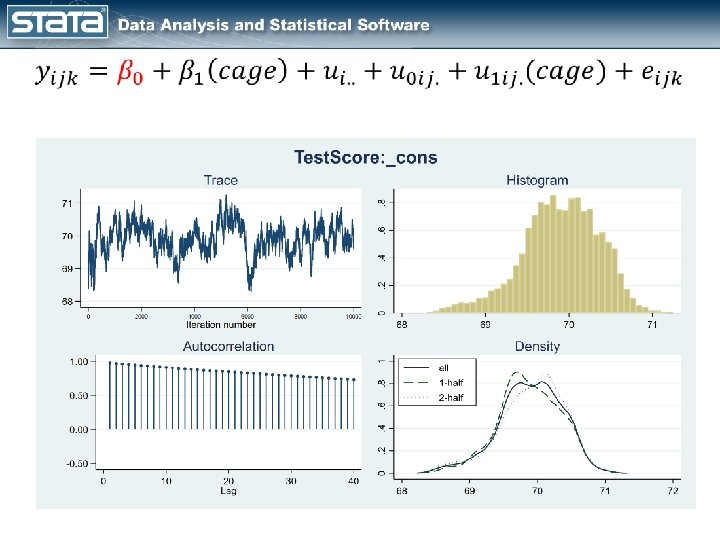
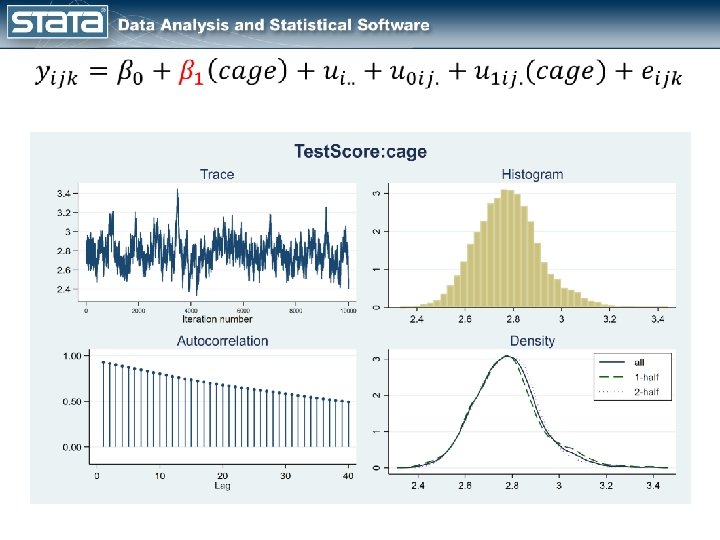
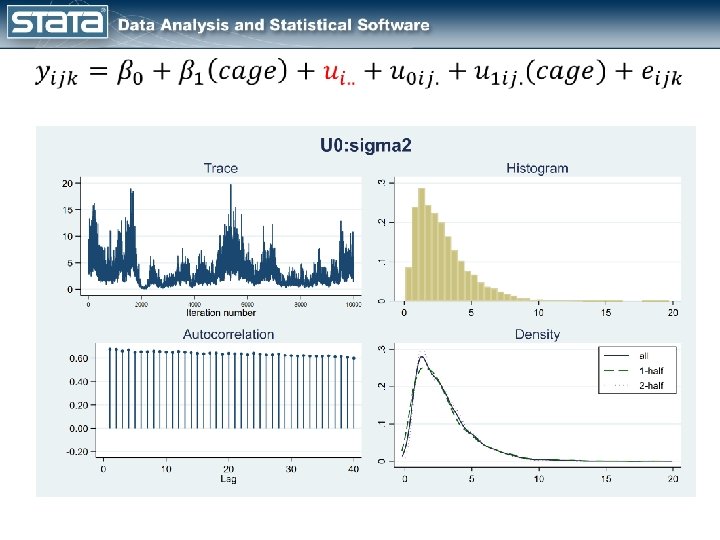
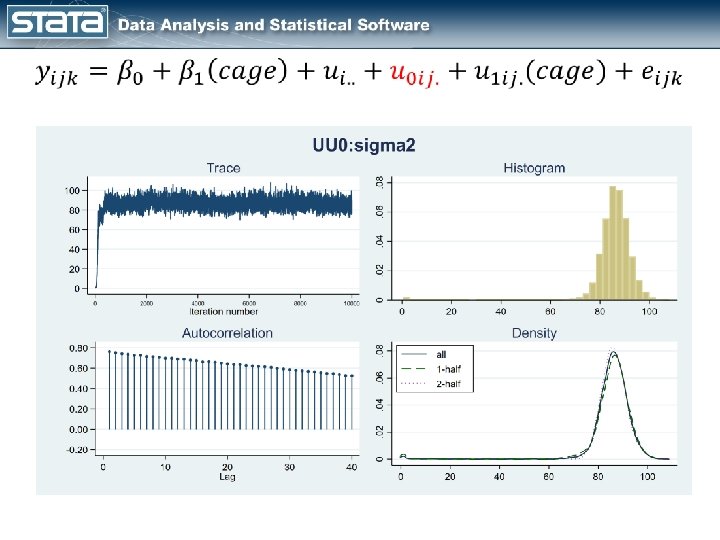
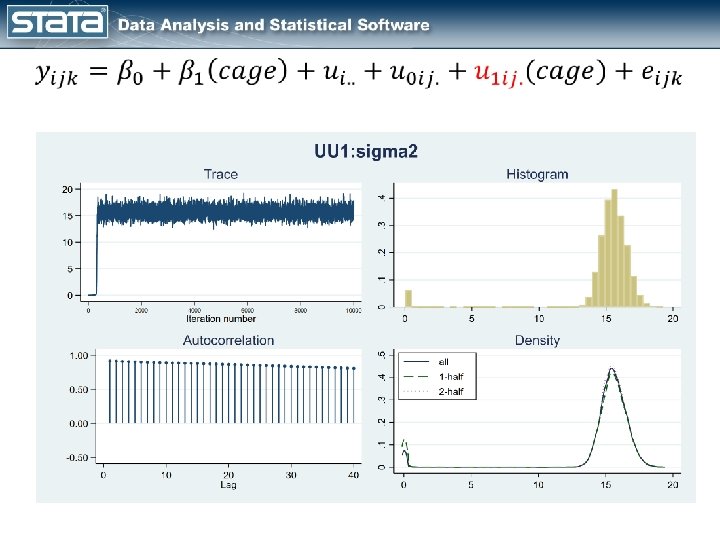
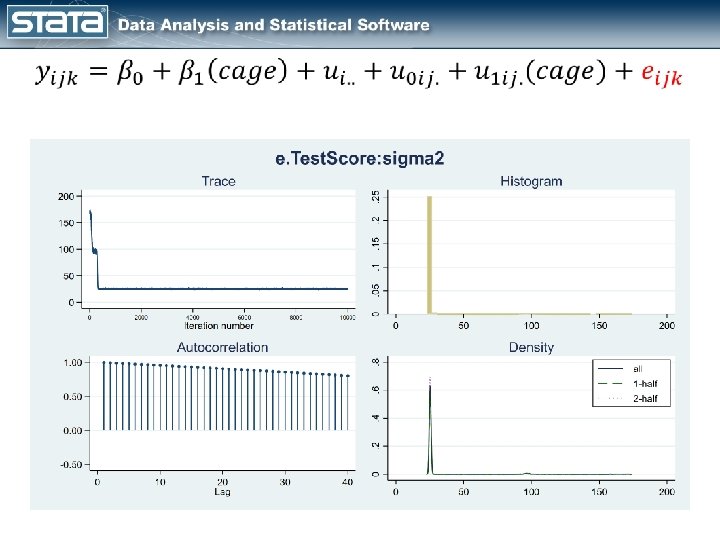
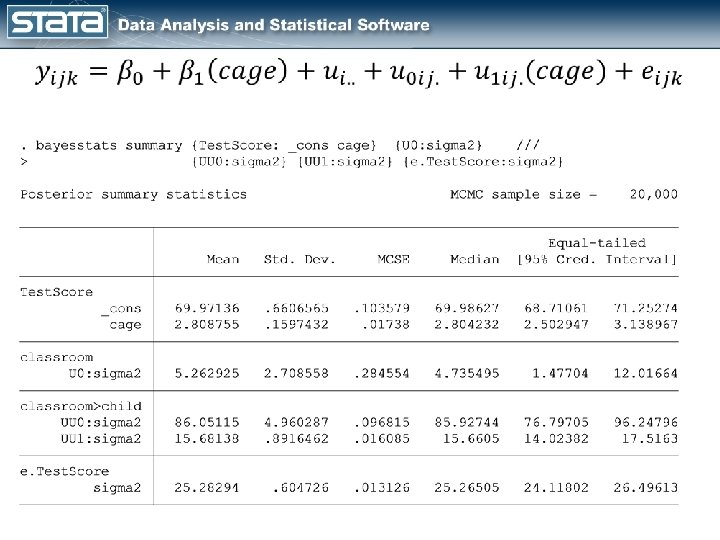
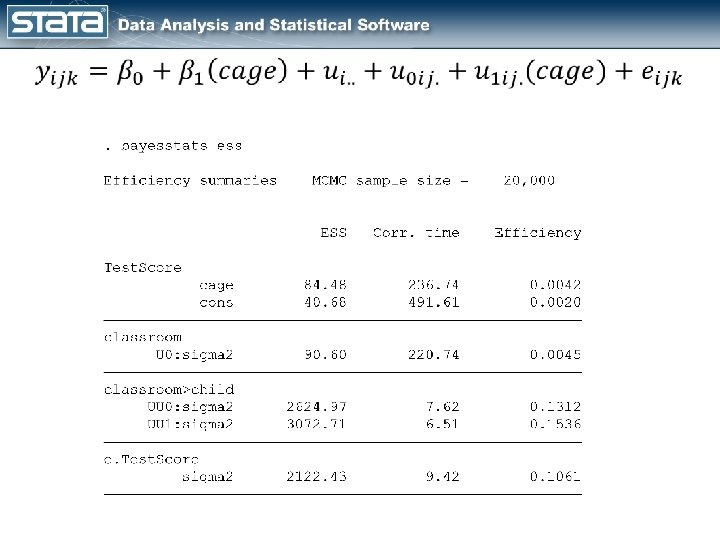
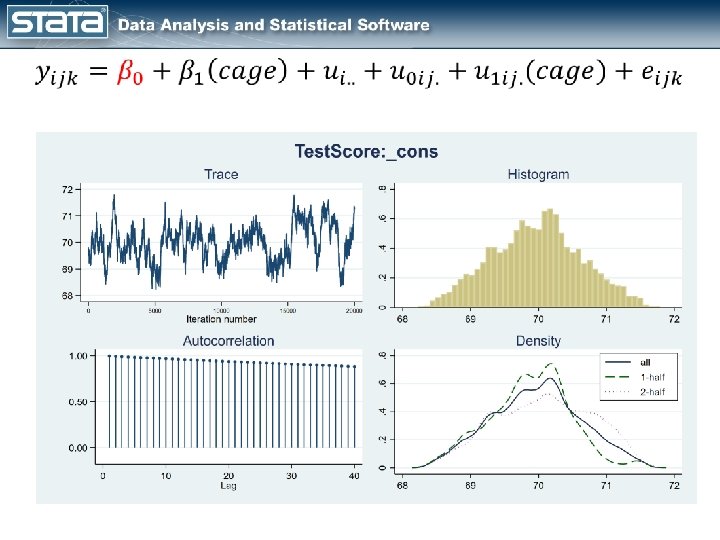
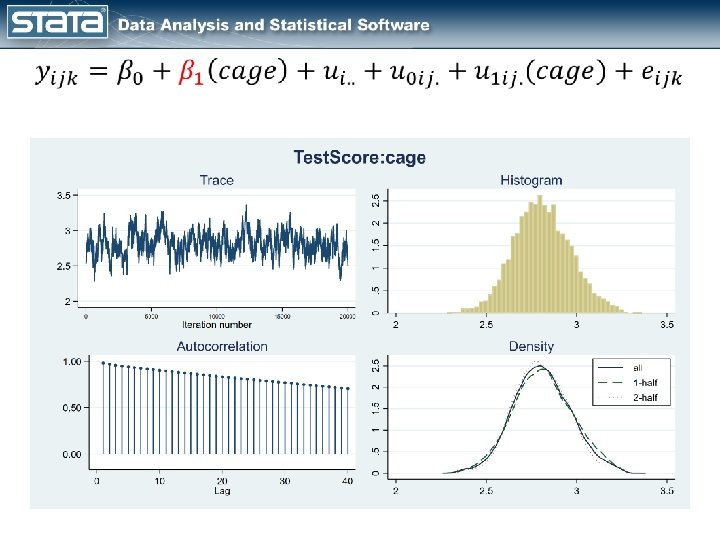
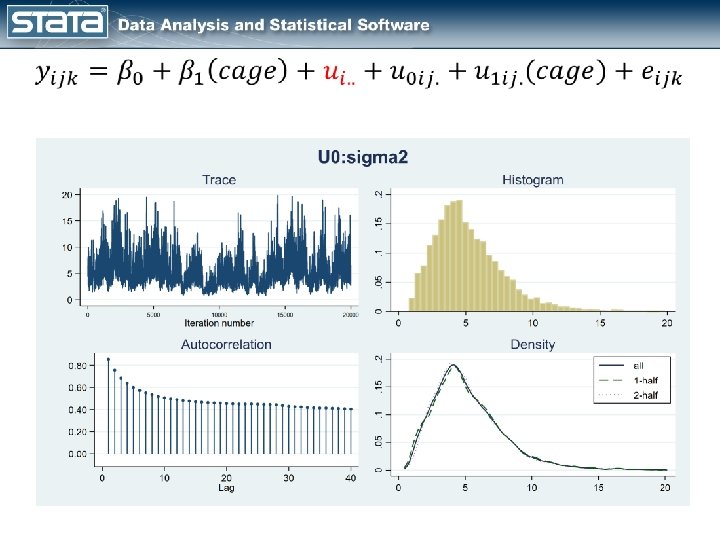
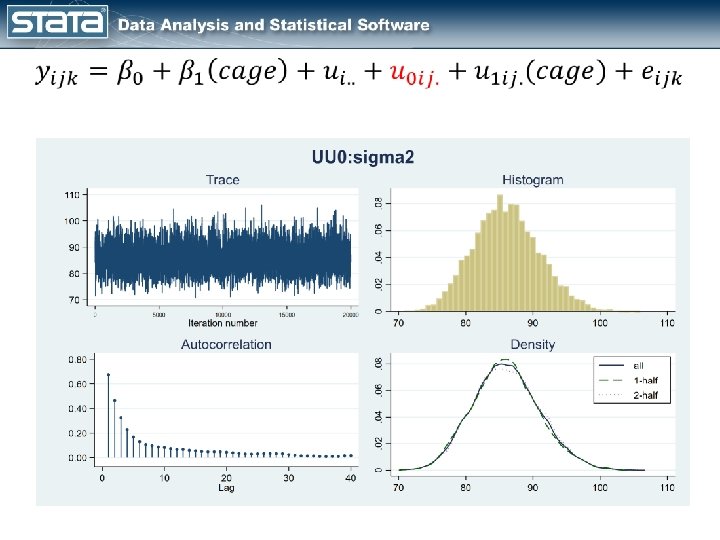
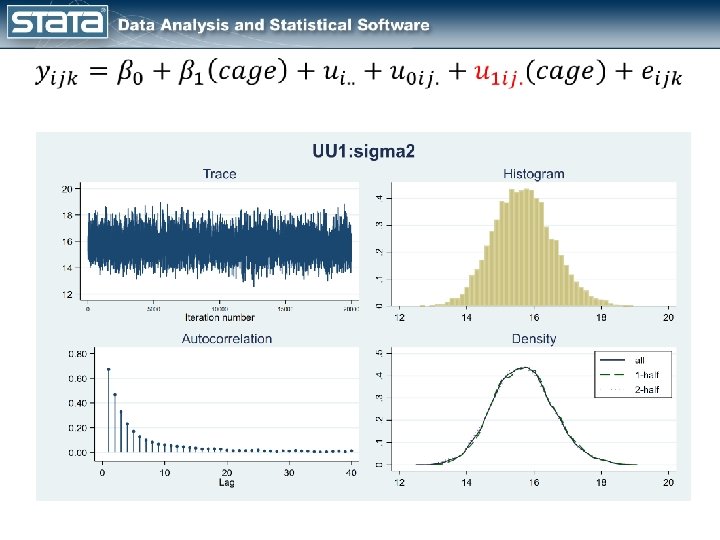
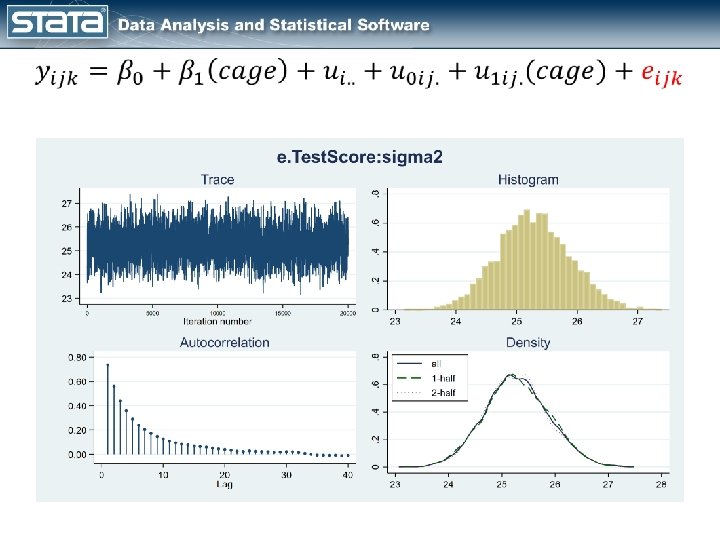
#delimit ; bayes, rseed(15) burnin(10000) mcmcsize(20000) saving(Rand. Slope 2. dta, replace) prior({Test. Score: _cons} prior({Test. Score: cage} prior({U 0: sigma 2} prior({UU 1: sigma 2} prior({e. Test. Score: sigma 2} , , , initial({Test. Score: _cons} {Test. Score: cage} {U 0: sigma 2} {UU 1: sigma 2} {e. Test. Score: sigma 2} block({Test. Score: } block({U 0: sigma 2} block({UU 0: sigma 2} {UU 1: sigma 2} block({e. Test. Score: sigma 2} normal(70, 10) gibbs) normal( 3, 10) gibbs) uniform(0, 20)) uniform(0, 150)) uniform(0, 20)) igamma(0. 01, 0. 01) gibbs) 70. 0 2. 8 2. 9 86. 0 15. 0 28. 0) , , split) : mixed Test. Score cage || classroom: || child: cage ; #delimit cr

Outline • • Introduction to Multilevel Models Introduction to Longitudinal Models Introduction to Bayesian Analysis Bayesian Multilevel/Longitudinal Models

Questions? chuber@stata. com
- Slides: 70