Bayesian Model Comparison SPC Will Penny V 1

Bayesian Model Comparison SPC Will Penny V 1 V 5 Wellcome Centre for Neuroimaging, UCL, UK. London-Marseille Joint Meeting, Institut de Neurosciences Cognitive de la Mediterranee, Marseille, September 28 -29, 2009

Overview • Priors, likelihoods and posteriors • Model selection using evidence • Model selection for groups • Comparing model families

Overview • Priors, likelihoods and posteriors • Model selection using evidence • Model selection for groups • Comparing model families

Bayesian Paradigm: priors and likelihood Model:

Bayesian Paradigm: priors and likelihood Model: Prior:

Bayesian Paradigm: priors and likelihood Model: Prior: Sample curves from prior (before observing any data) Mean curve

Bayesian Paradigm: priors and likelihood Model: Prior: Likelihood:

Bayesian Paradigm: priors and likelihood Model: Prior: Likelihood:

Bayesian Paradigm: priors and likelihood Model: Prior: Likelihood:

Bayesian Paradigm: posterior Model: Prior: Likelihood: Bayes Rule: Posterior:

Bayesian Paradigm: posterior Model: Prior: Likelihood: Bayes Rule: Posterior:

Bayesian Paradigm: posterior Model: Prior: Likelihood: Bayes Rule: Posterior:

Overview • Priors, likelihoods and posteriors • Model selection using evidence • Model selection for groups • Comparing model families

Model Selection Bayes Rule: normalizing constant Cost function Model evidence:

Second level of Bayesian Inference Parameters: Model, m SPC Parameter Posterior Likelihood Parameter Prior V 1 V 5 Model Posterior Evidence Model Prior

Bayes Factors Model, m=i Model Evidences: SPC V 1 V 5 Bayes factor: Model, m=j SPC V 1 V 5 1 to 3: 3 to 20: 20 to 100: >100: Weak Positive Strong Very Strong

Overview • Priors, likelihoods and posteriors • Model selection using evidence • Dynamic Causal Models • Model selection for groups • Comparing model families

Single region u 1 c a 11 z 1 u 2 z 1 z 2

Multiple regions u 1 c a 11 z 1 u 2 a 21 z 2 a 22 u 1 z 2

Modulatory inputs u 1 u 2 c u 1 a 11 z 1 b 21 a 21 z 2 a 22 u 2 z 1 z 2

Reciprocal connections u 1 u 2 c u 1 a 11 z 1 b 21 a 12 a 21 z 2 a 22 u 2 z 1 z 2

Overview • Priors, likelihoods and posteriors • Model selection using evidence • Dynamic Causal Models • Model selection for groups • Comparing model families
 correct model (m 1) u 2 x 3 u 1")
incorrect model (m 2) correct model (m 1) u 2 x 3 u 1 x 1 m 2 x 3 x 2 u 1 x 2 m 1 Figure 2

LD MOG FG LD|LVF MOG FG LD|RVF MOG LD|LVF LG LG RVF stim. LD FG LD LD LG LVF stim. m 2 MOG FG LG RVF LD|RVF stim. LVF stim. m 1 Models from Klaas Stephan

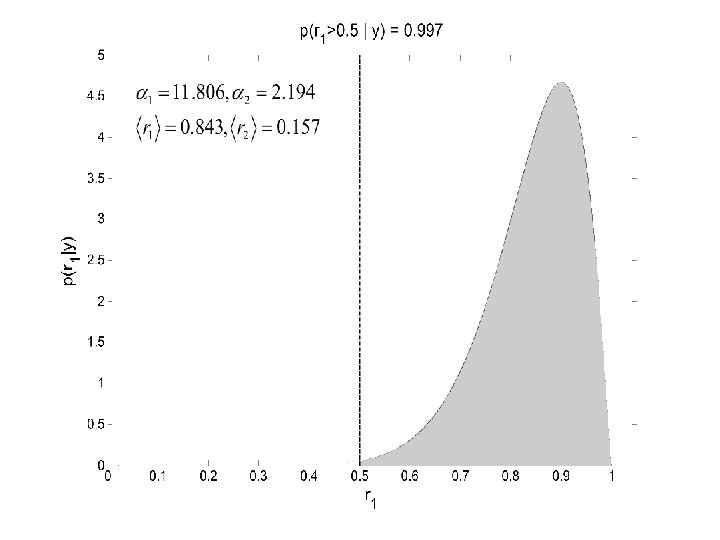
Random Effects Inference Different subjects can use different models. is the probability that model m is used in the population at large. We wish to make an inference about this.

Overview • Priors, likelihoods and posteriors • Model selection using evidence • Model selection for groups • Comparing model families

DCM of Auditory Word Processing: Data from an f. MRI study by Alex Leff and Tom Schofield P F P: Posterior STS A: Anterior STS F: Inferior Frontal Gyrus A How does processing change for speech versus reversed speech input ? 2^6=64 possible patterns of ‘modulation’. 2^3=8 -1=7 possible patterns of input connectivity 7*64=448 possible networks 26*448=11, 648 models in group of 26 subjects

Input families: Where does the input go ?

A F P AF PA PF PAF
 P (b) F P F A (c)")
Four of the top 16 models: (a) P (b) F P F A (c) A P F (d) P F A A

Bayesian Model Averaging
")
Same but now for RFX model probs p(m|Y)

DCM of Auditory Word Processing: Data from an f. MRI study by Alex Leff and Tom Schofield P F P: Posterior STS A: Anterior STS F: Inferior Frontal Gyrus A How does processing change for speech versus reversed speech input ? (1) Input goes to P. (2) Connections from P to F, and P to A, are increased for speech versus reversed speech

Summary • First and second levels of Bayesian inference • Model selection for groups • Comparing model families • DCM for EEG-f. MRI • Thank-you !
- Slides: 35