
Basics of mm interferometry Sbastien Muller Nordic ARC
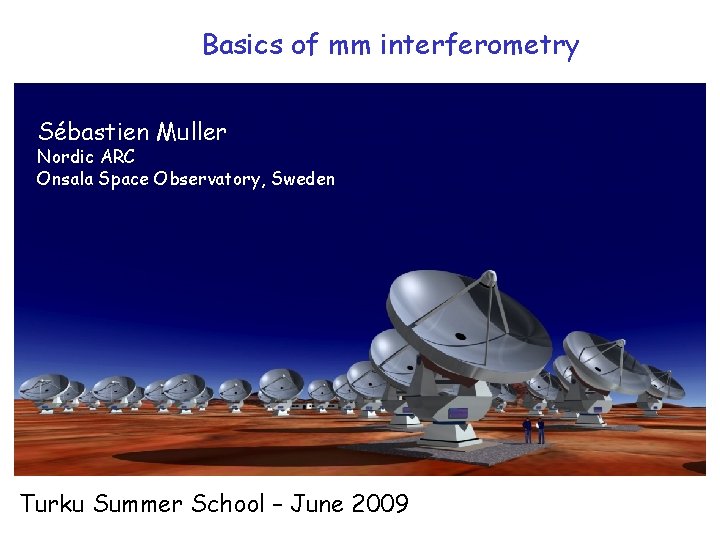
Basics of mm interferometry Sébastien Muller Nordic ARC Onsala Space Observatory, Sweden Turku Summer School – June 2009
Interests of mm radioastronomy -> Cold Universe Giant Molecular Clouds -> COLD and DENSE phase Site of the STAR FORMATION -> Continuum emission of cold dust -> Molecular transitions - Diagnostics of the gas properties (temperature, density) - Kinematics (outflows, rotation)
Interests of CO Molecular gas H 2 But H 2 symmetric -> electric dipolar momentum is 0 Most abundant molecule after H 2 is CO [CO/H 2] ~ 10 -4 First rotational transitions of CO in the mm CO(1 -0) @115 GHz CO(2 -1) @230 GHz CO(3 -2) @345 GHz Where the atmosphere is relatively transparent E J=1, 2, 3 = 6, 17, 33 K Easily excited CO is difficult to destroy high ionization potential (14 e. V) and dissociation energy (11 e. V)
Handy formulae - HI line emission: N(HI) (cm-2) = 1. 82 1018 TBdv (K km/s) - Molecular line emission: N(H 2) (cm-2) = X 1020 TCOdv (K km/s) Or use optically thin lines (13 CO, C 18 O) - Visual extinction: N(HI)+2 N (H 2) (cm-2) = 2 1021 AV (mag) X = 0. 5 -3
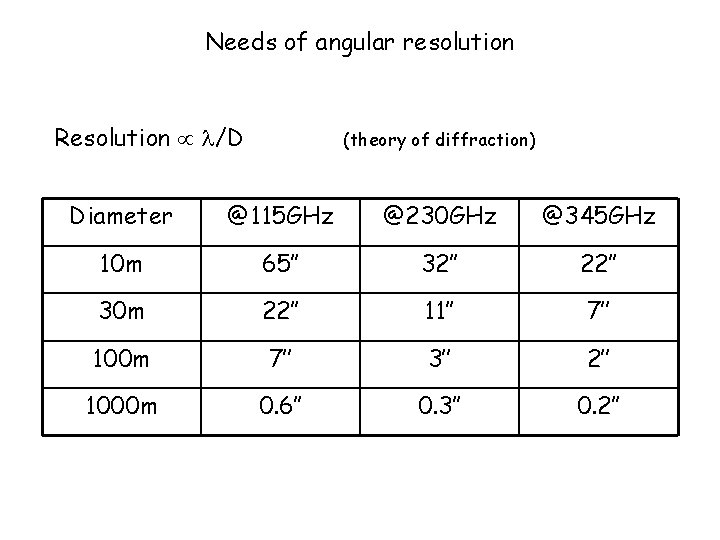
Needs of angular resolution Resolution /D (theory of diffraction) Diameter @115 GHz @230 GHz @345 GHz 10 m 65’’ 32’’ 22’’ 30 m 22’’ 11’’ 7’’ 100 m 7’’ 3’’ 2’’ 1000 m 0. 6’’ 0. 3’’ 0. 2’’
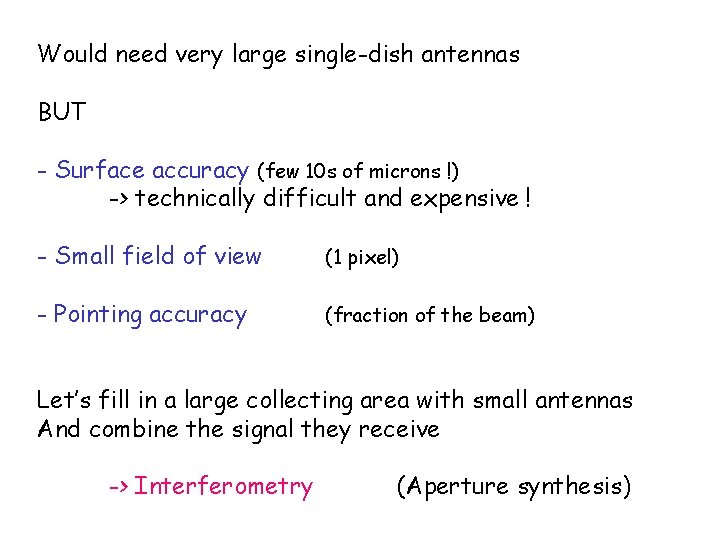
Would need very large single-dish antennas BUT - Surface accuracy (few 10 s of microns !) -> technically difficult and expensive ! - Small field of view (1 pixel) - Pointing accuracy (fraction of the beam) Let’s fill in a large collecting area with small antennas And combine the signal they receive -> Interferometry (Aperture synthesis)
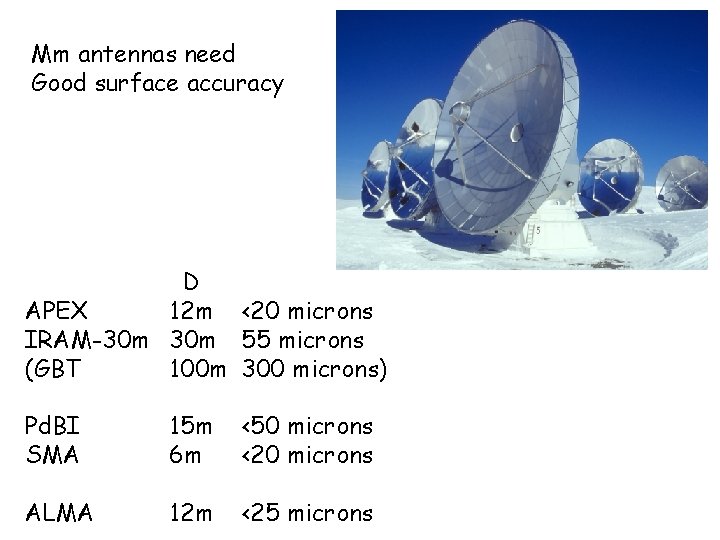
Mm antennas need Good surface accuracy D APEX 12 m <20 microns IRAM-30 m 55 microns (GBT 100 m 300 microns) Pd. BI SMA 15 m 6 m <50 microns <20 microns ALMA 12 m <25 microns
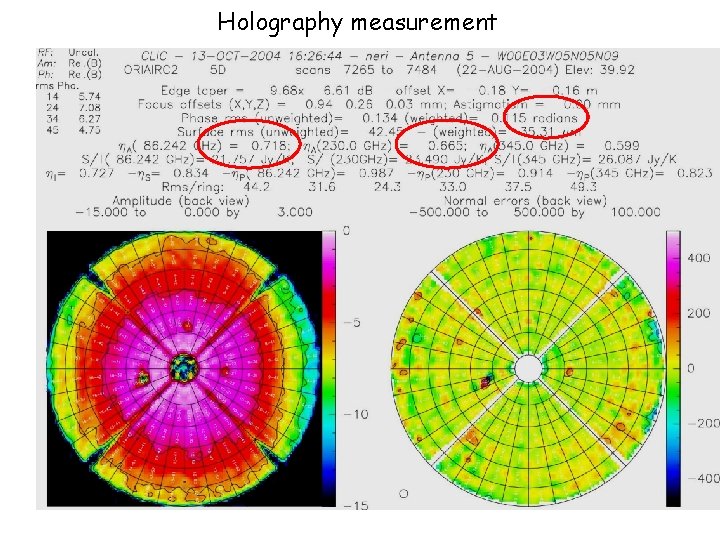
Holography measurement
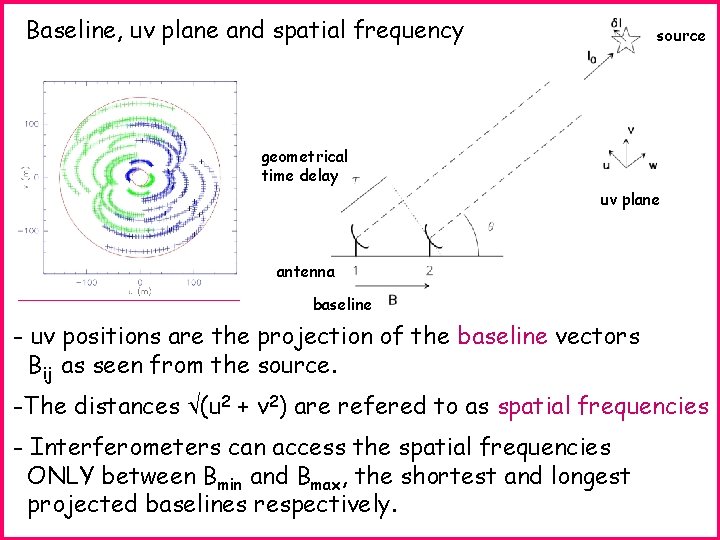
Baseline, uv plane and spatial frequency source geometrical time delay uv plane antenna baseline - uv positions are the projection of the baseline vectors Bij as seen from the source. -The distances (u 2 + v 2) are refered to as spatial frequencies - Interferometers can access the spatial frequencies ONLY between Bmin and Bmax, the shortest and longest projected baselines respectively.

Interferometers measure VISIBILITIES V V(u, v) = P(x, y) I(x, y) exp –i 2 (ux+vy) dxdy = FT { P I } But astronomers want the SKY BRIGHTNESS DISTRIBUTION of the source : I(x, y) P(x, y) is the PRIMARY BEAM of the antennas - P has a finite support, so the field of view is limited - distorded source informations - P is in principle known ie. antenna characteristic

I(x, y) P(x, y) = V(u, v) exp i 2 (ux+vy) dudv Well, looks easy … BUT ! Interferometers have an irregular and limited uv sampling : - high spatial frequency (limit the resolution) - low spatial frequency (problem with wide field imaging) Incomplete sampling, non respect of the Nyquist’s criterion = LOSS of informations ! The direct deconvolution is not possible Need to use some smart algorithms (e. g. CLEAN)
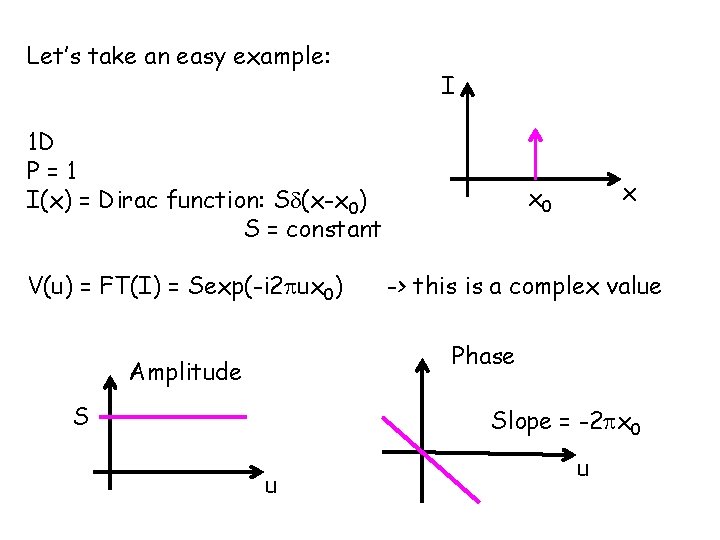
Let’s take an easy example: I 1 D P=1 I(x) = Dirac function: S (x-x 0) S = constant V(u) = FT(I) = Sexp(-i 2 ux 0) x x 0 -> this is a complex value Phase Amplitude S Slope = -2 x 0 u u
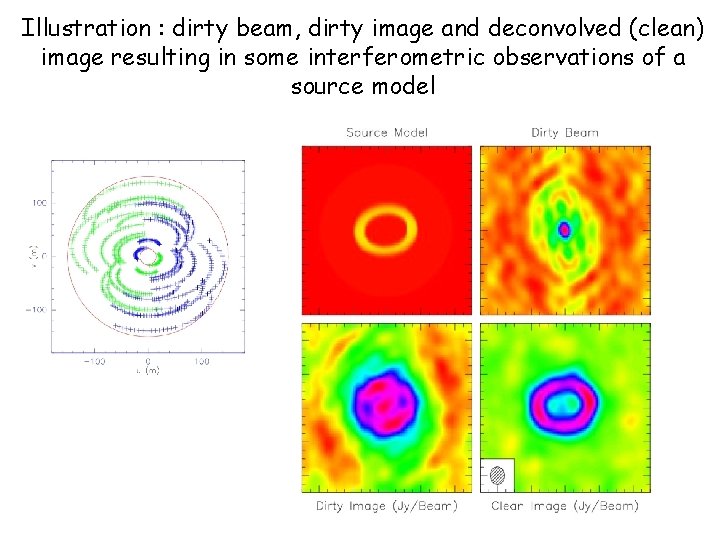
Illustration : dirty beam, dirty image and deconvolved (clean) image resulting in some interferometric observations of a source model
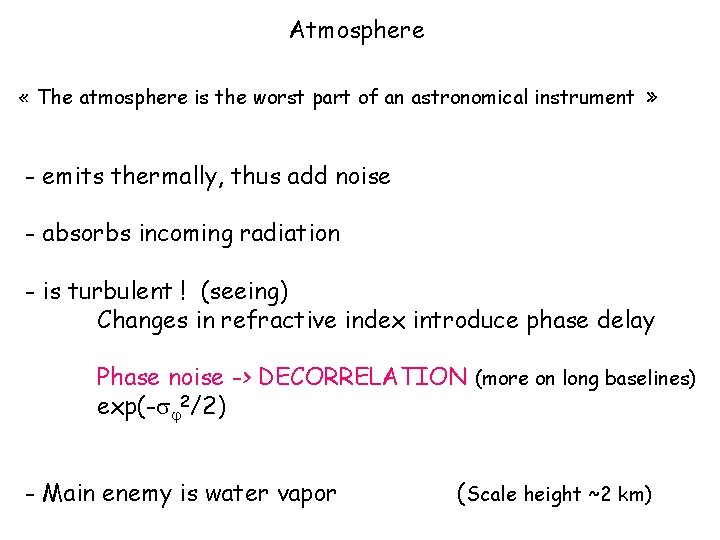
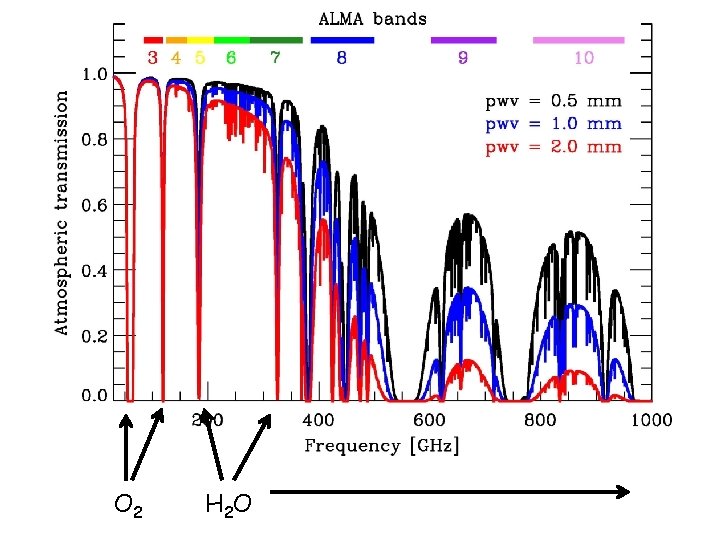
Atmosphere « The atmosphere is the worst part of an astronomical instrument » - emits thermally, thus add noise - absorbs incoming radiation - is turbulent ! (seeing) Changes in refractive index introduce phase delay Phase noise -> DECORRELATION (more on long baselines) exp(- 2/2) - Main enemy is water vapor (Scale height ~2 km)
O 2 H 2 O
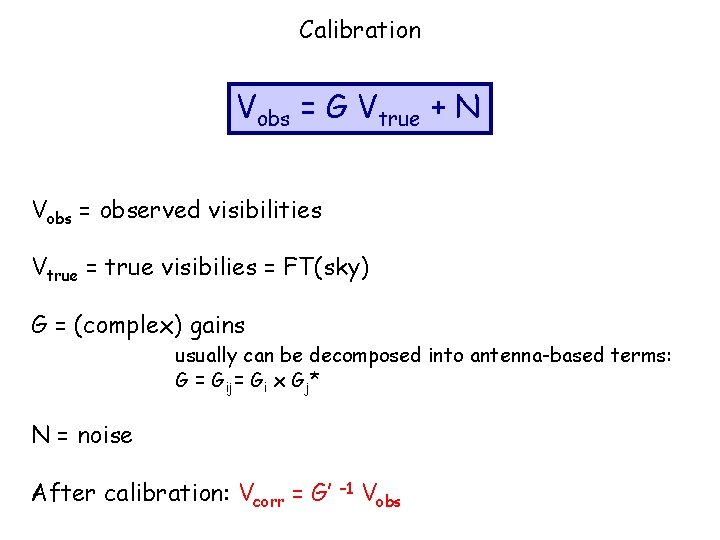
Calibration Vobs = G Vtrue + N Vobs = observed visibilities Vtrue = true visibilies = FT(sky) G = (complex) gains usually can be decomposed into antenna-based terms: G = Gij= Gi x Gj* N = noise After calibration: Vcorr = G’ – 1 Vobs
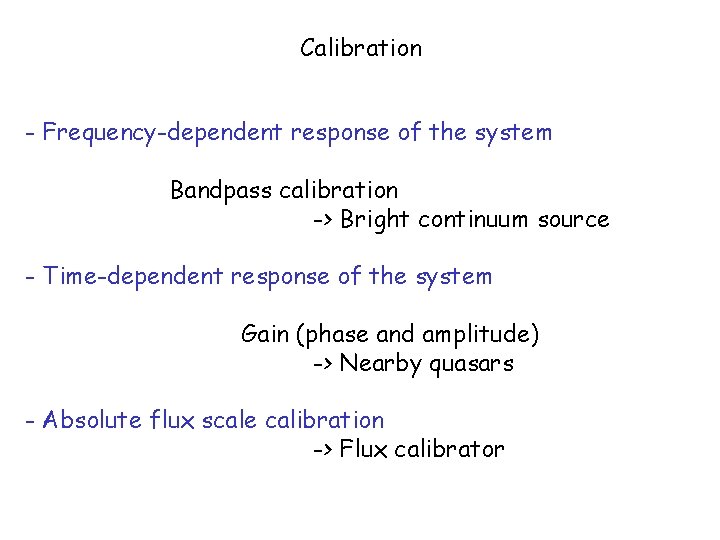
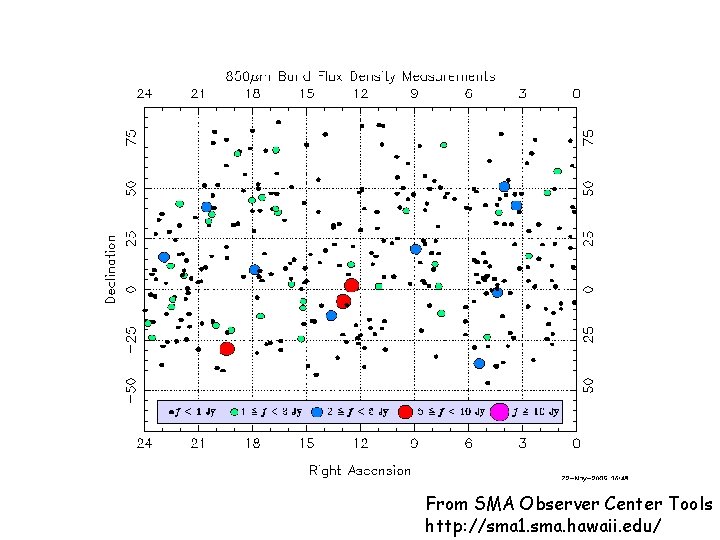
Calibration - Frequency-dependent response of the system Bandpass calibration -> Bright continuum source - Time-dependent response of the system Gain (phase and amplitude) -> Nearby quasars - Absolute flux scale calibration -> Flux calibrator
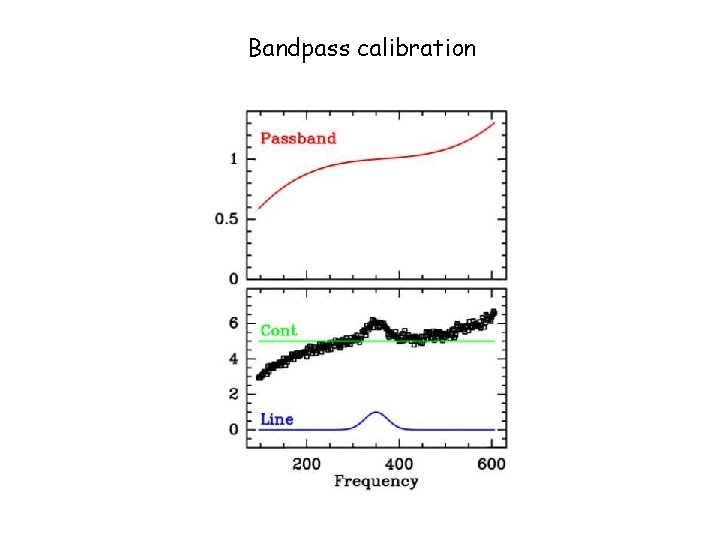
Bandpass calibration
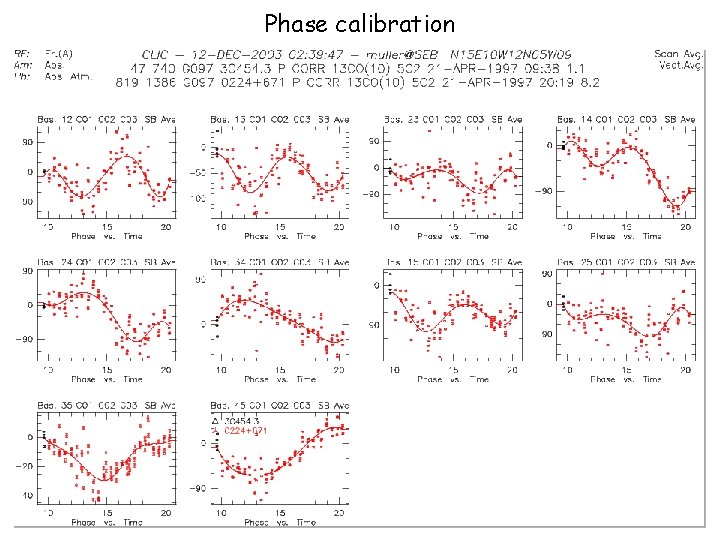
Phase calibration
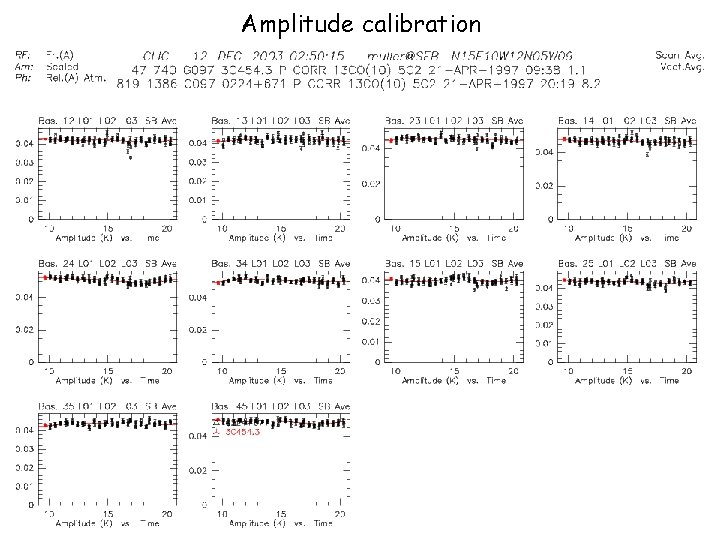
Amplitude calibration
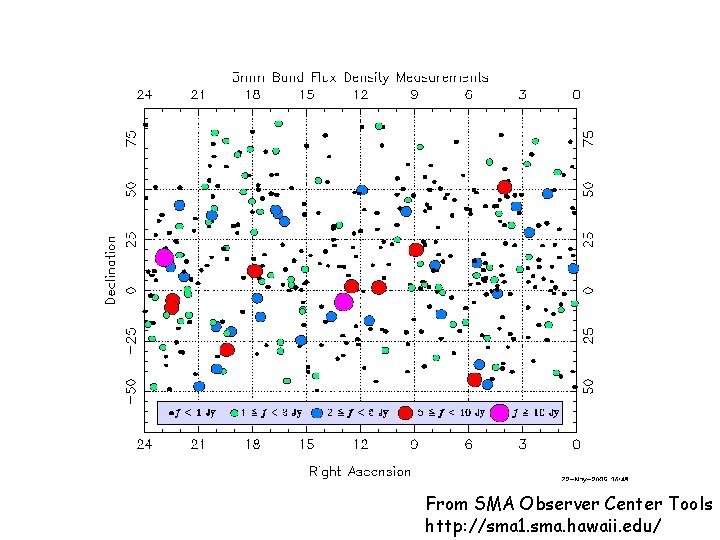
From SMA Observer Center Tools http: //sma 1. sma. hawaii. edu/
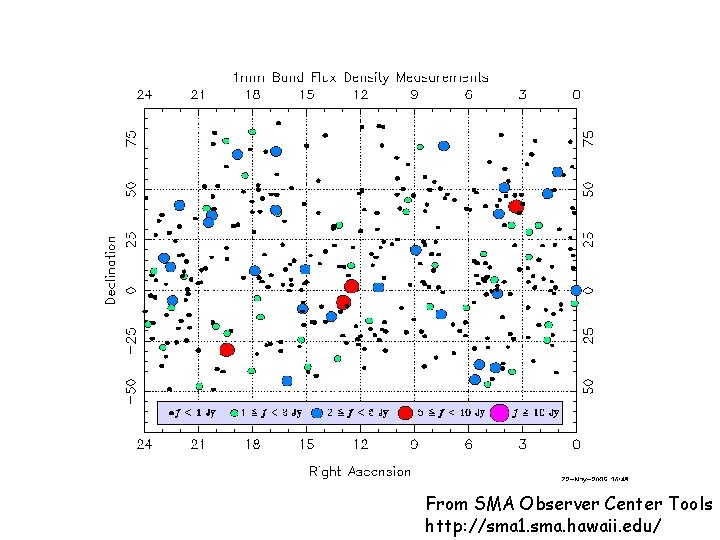
From SMA Observer Center Tools http: //sma 1. sma. hawaii. edu/
From SMA Observer Center Tools http: //sma 1. sma. hawaii. edu/
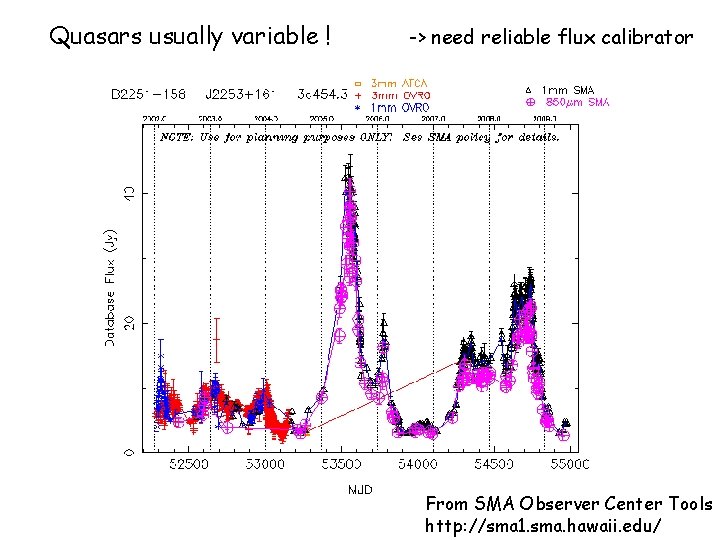
Quasars usually variable ! -> need reliable flux calibrator From SMA Observer Center Tools http: //sma 1. sma. hawaii. edu/
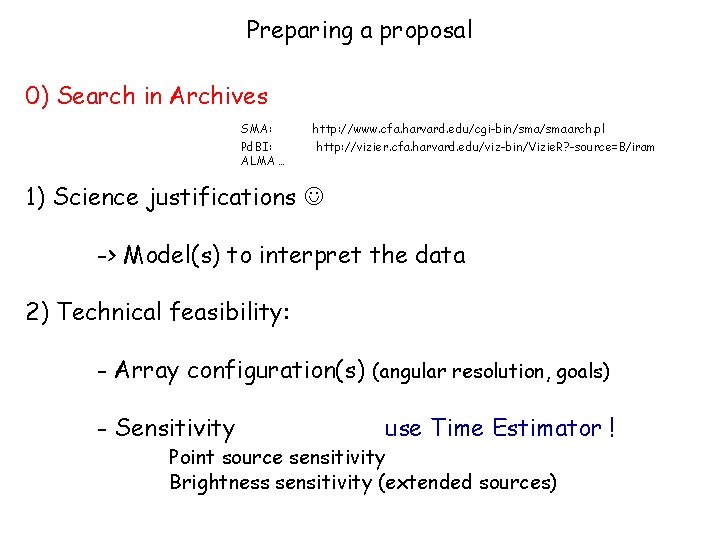
Preparing a proposal 0) Search in Archives SMA: Pd. BI: ALMA … http: //www. cfa. harvard. edu/cgi-bin/smaarch. pl http: //vizier. cfa. harvard. edu/viz-bin/Vizie. R? -source=B/iram 1) Science justifications -> Model(s) to interpret the data 2) Technical feasibility: - Array configuration(s) (angular resolution, goals) - Sensitivity use Time Estimator ! Point source sensitivity Brightness sensitivity (extended sources)
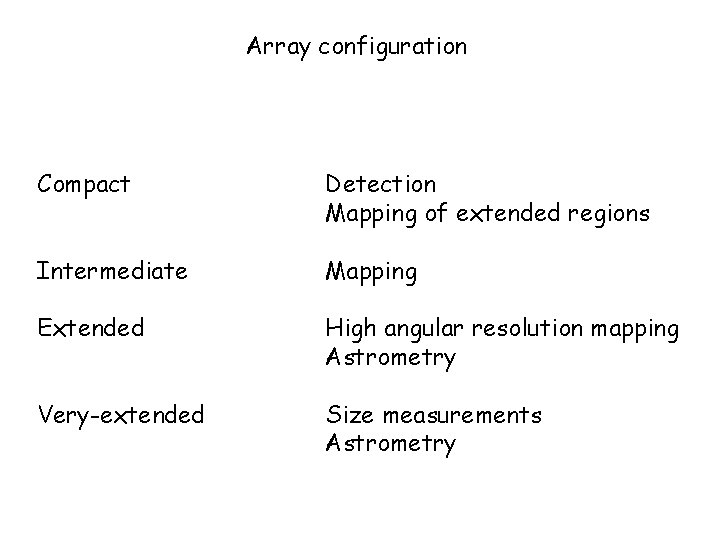
Array configuration Compact Detection Mapping of extended regions Intermediate Mapping Extended High angular resolution mapping Astrometry Very-extended Size measurements Astrometry
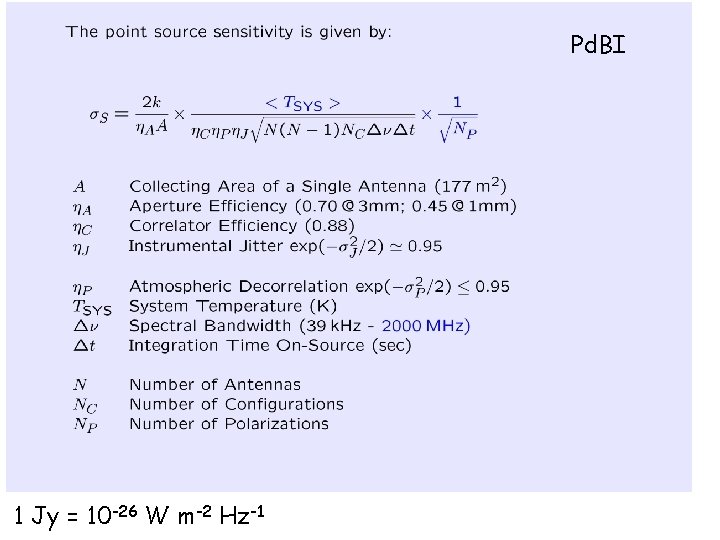
Pd. BI 1 Jy = 10 -26 W m-2 Hz-1
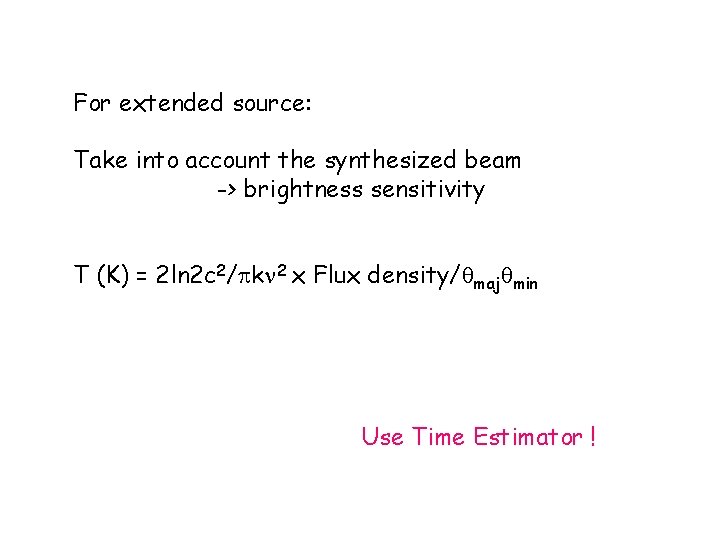
For extended source: Take into account the synthesized beam -> brightness sensitivity T (K) = 2 ln 2 c 2/ k 2 x Flux density/ maj min Use Time Estimator !

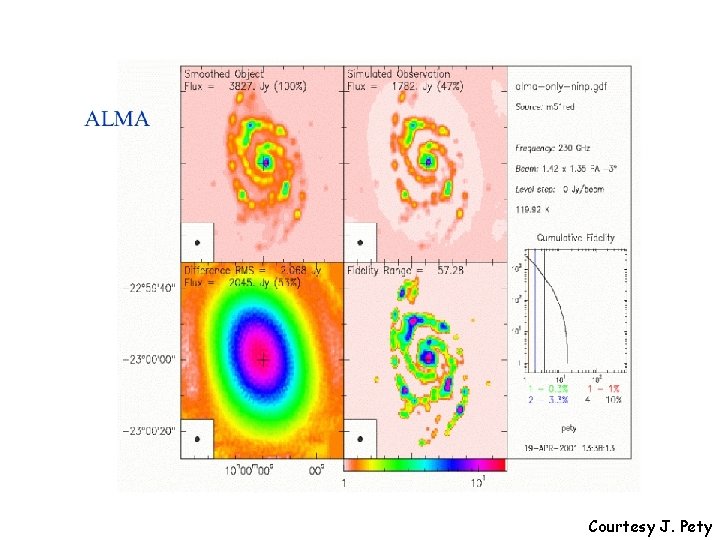
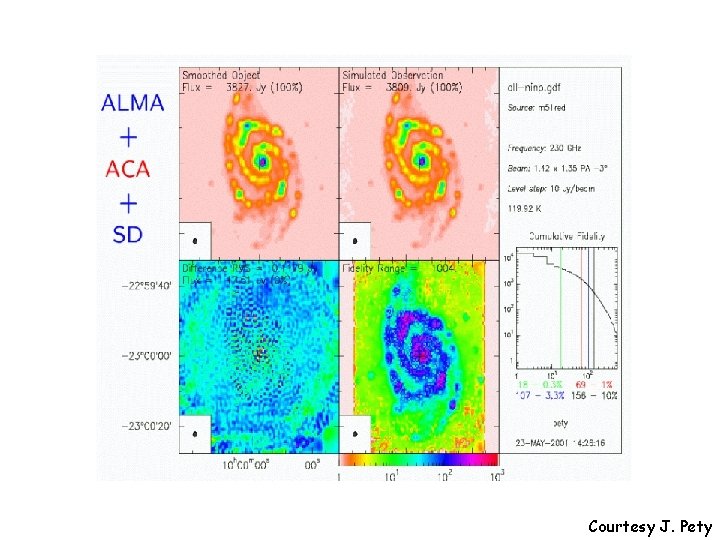
Short spacings V(u, v) = P(x, y) I(x, y) exp –i 2 (ux+vy) dxdy V(0, 0) = P(x, y) I(x, y) dxdy (Forget P), this is the total flux of the source And it is NOT measured by an interferometer ! -> Problem for extended sources !!! -> Try to fill in the short spacings
Courtesy J. Pety
Courtesy J. Pety
Advantages of interferometers - High angular resolution - Large collecting area - Flatter baselines - Astrometry - Can filter out extended emission - Large field of view with independent pixels - Flexible angular resolution (different configuration)
Disadvantages of interferometers - Require stable atmosphere - High altitude and ~flat site (usually difficult to access) - Lots of receivers to do - Complex correlator - Can filter out extended emission - Need time and different configuration to fill in the uv-plane
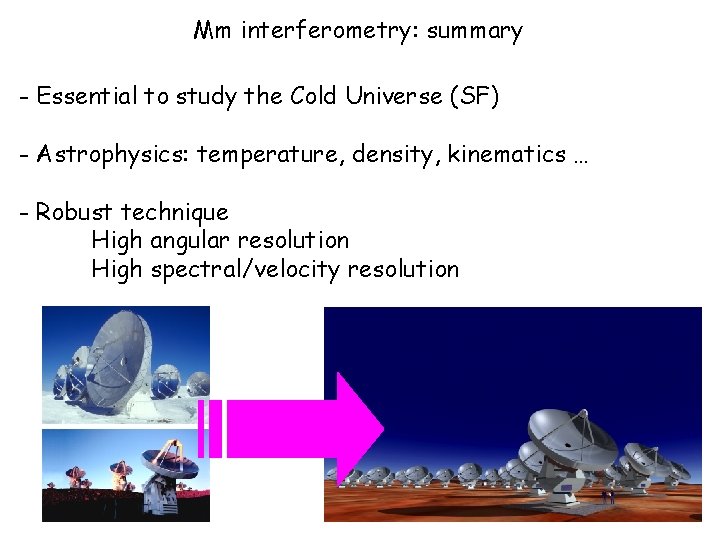
Mm interferometry: summary - Essential to study the Cold Universe (SF) - Astrophysics: temperature, density, kinematics … - Robust technique High angular resolution High spectral/velocity resolution

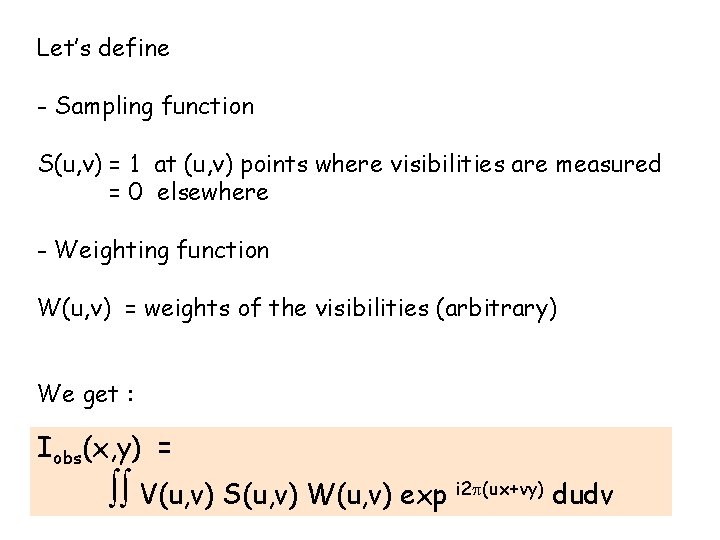
Let’s define - Sampling function S(u, v) = 1 at (u, v) points where visibilities are measured = 0 elsewhere - Weighting function W(u, v) = weights of the visibilities (arbitrary) We get : Iobs(x, y) = V(u, v) S(u, v) W(u, v) exp i 2 (ux+vy) dudv

Due to the Fourier Transform properties : FT { A B } = FT { A } ** FT { B } Iobs(x, y) = V(u, v) S(u, v) W(u, v) exp i 2 (ux+vy) dudv Can be rewritten as : Iobs(x, y) = P(x, y) I(x, y) ** D(x, y) where D(x, y) = S(u, v) W(u, v) exp i 2 (ux+vy) dudv = FT { S W }
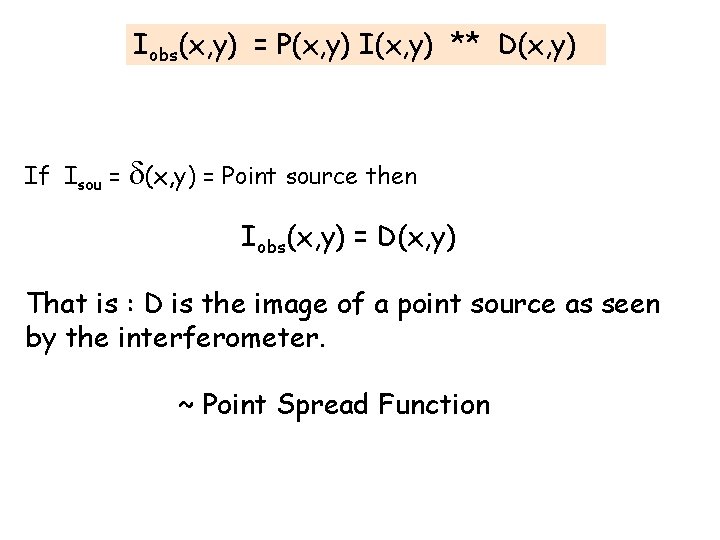
Iobs(x, y) = P(x, y) I(x, y) ** D(x, y) If Isou = (x, y) = Point source then Iobs(x, y) = D(x, y) That is : D is the image of a point source as seen by the interferometer. ~ Point Spread Function
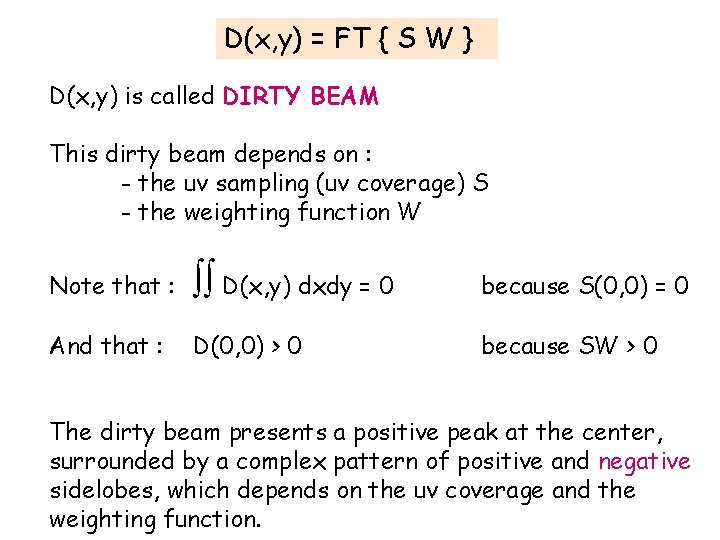
D(x, y) = FT { S W } D(x, y) is called DIRTY BEAM This dirty beam depends on : - the uv sampling (uv coverage) S - the weighting function W Note that : D(x, y) dxdy = 0 because S(0, 0) = 0 And that : D(0, 0) > 0 because SW > 0 The dirty beam presents a positive peak at the center, surrounded by a complex pattern of positive and negative sidelobes, which depends on the uv coverage and the weighting function.
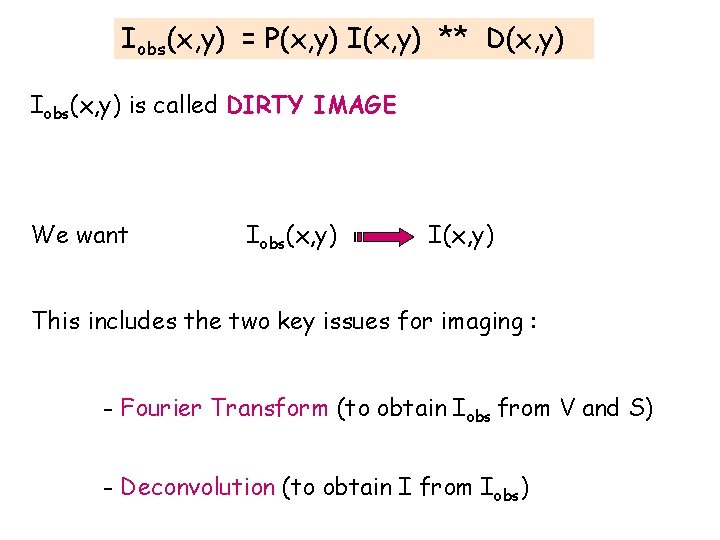
Iobs(x, y) = P(x, y) I(x, y) ** D(x, y) Iobs(x, y) is called DIRTY IMAGE We want Iobs(x, y) I(x, y) This includes the two key issues for imaging : - Fourier Transform (to obtain Iobs from V and S) - Deconvolution (to obtain I from Iobs)
- Slides: 40