Basics of Cardiac Nuclear Imaging v Dr Amol

Basics of Cardiac Nuclear Imaging v Dr. Amol Patil v Dept. of cardiology v GMC, kozhikode
 • PET(Positron Emission")
INTRODUCTION • SPECT (Single-Photon Emission Computed Tomography of Perfusion and Function) • PET(Positron Emission Tomography) • Planar Myocardial Perfusion Imaging • Radionuclide Ventriculography or Angiography • Assessment of Myocardial Blood Flow

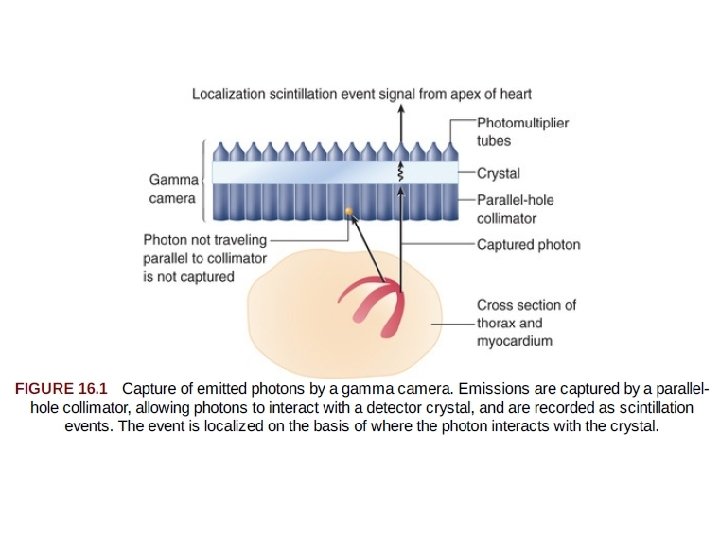
Single-Photon Emission Computed Tomography of Perfusion and Function • injection of the chosen radiotracer - the isotope is extracted from the blood by viable myocytes and retained for sometime • Photons are emitted from the myocardium in proportion to the magnitude of tracer uptake, in turn related to perfusion. • Gamma camera, captures the gamma ray photonsrepresenting the magnitude of uptake and the location of the emission. • The photoemissions collide with a detector crystal - the gamma photons are absorbed and converted into visible light events (scintillation event). • Photomultiplier tubes - sense the light scintillation events and convert the events into an electrical signal to be further processed.

• Emitted gamma rays are selected for capture and quantitation by a collimator attached to the face of the camera detector system. • Most often, parallel-hole collimators are used - Allows appropriate localization of the source of the emitted gamma rays. • The final result of SPECT imaging is the creation of multiple tomograms, or slices, of the organ of interest, composing a digital display representing radiotracer distribution throughout the organ. • With SPECT MPI, the display represents the distribution of perfusion throughout the myocardium.

SPECT Image Acquisition • To construct the three-dimensional model of the heart -the myocardial perfusion data must be sampled from multiple angles over 180 or 360 degrees around the patient. • Multiple images, each comprising 20 to 25 seconds of emission data, are collected. • imaging information from each of the angles is used for organ image reconstruction.

SPECT Image Display • standardized tomographic images in three standard planes 1. Short-axis tomograms 2. vertical long-axis tomograms 3. horizontal long-axis tomograms

Short-axis tomograms, representing donut like slices of the heart cut perpendicular to the long axis of the heart, are displayed beginning from the apex and moving toward the base. (similar to the short-axis view in two-dimensional echocardiography, although it is shifted counterclockwise)

Tomographic slices cut parallel to the long axis of the heart and also parallel to the long axis of the body are termed vertical long-axis tomograms

Slices also cut parallel to the long axis of the heart but perpendicular to the vertical longaxis slices are known as horizontal long-axis tomograms

High-Speed SPECT Imaging • Advances in camera and collimator technology have substantially increased the efficiency of count capture, increasing count sensitivity many-fold. • One approach uses a series of small, pixilated, solid-state detector columns with cadmium zinc telluride or cesium iodide: thallium crystals, which provide considerably more information for each detected gamma ray.

• Compared with the conventional SPECT cameras, the highspeed SPECT systems --eightfold increase in count rates reducing imaging times significantly from 14 to 15 minutes with a conventional Anger gamma camera to 5 to 6 minutes with the newer solid-state camera • achieving a twofold increase in spatial resolution. • Improved resolution recovery.

• Advantages of high-speed SPECT 1. improved patient comfort and satisfaction, as well as less motion artifacts. 2. reducing radiation dose to patients, without sacrificing image resolution and quality.

Patient Preparation • The patient’s physical tolerance for various forms of stress testing should be assessed. The carotid pulses, pulmonary function, and cardiac function should be evaluated, and the lungs should be assessed for evidence of heart failure and pulmonary edema. .

• not to eat for 4 hours before perfusion imaging. • not to ingest caffeine for 12– 24 hours before the imaging examination • Ideally, patients without previously documented CAD also would withhold consumption of b-blockers and calcium channel blockers for 24 hours before the start of imaging. (reduce the sensitivity of stress perfusion imaging) • Long-acting nitrates should be withheld the day of the imaging examination, if possible. • When perfusion imaging is performed for risk stratification of patients who are undergoing medical therapy for known coronary artery disease, medications are not usually withheld

SPECT Perfusion Tracers and Protocols

• 201 Tl -biologic properties similar to potassium. • potassium is the major intracellular cation in muscle and is virtually absent in scar tissue. • 201 Tl is a well-suited radionuclide for differentiation of normal and ischemic myocardium from scarred myocardium. • Thallium-201 emits 80 ke. V of photon energy and has a physical half-life of 73 hours. • The initial myocardial uptake early after intravenous injection of thallium is proportional to regional blood flow. • First-pass extraction fraction =85%.

• It is transported across the myocyte cell membrane by the Na+, K+ – ATPase transport system and by facilitative diffusion. • Peak myocardial concentration of thallium is achieved within 5 minutes of injection, with rapid clearance from the intravascular compartment. • Although the initial uptake and distribution of thallium are primarily a function of blood flow, • the subsequent redistribution of thallium, which begins within 10 to 15 minutes after injection, is unrelated to flow but is related to the rate of its clearance from myocardium, linked to the concentration gradient between myocyte levels and blood levels of thallium • Thallium clearance is more rapid from normal myocardium with high thallium activity than from myocardium with reduced thallium activity (ischemic myocardium), a process termed differential washout
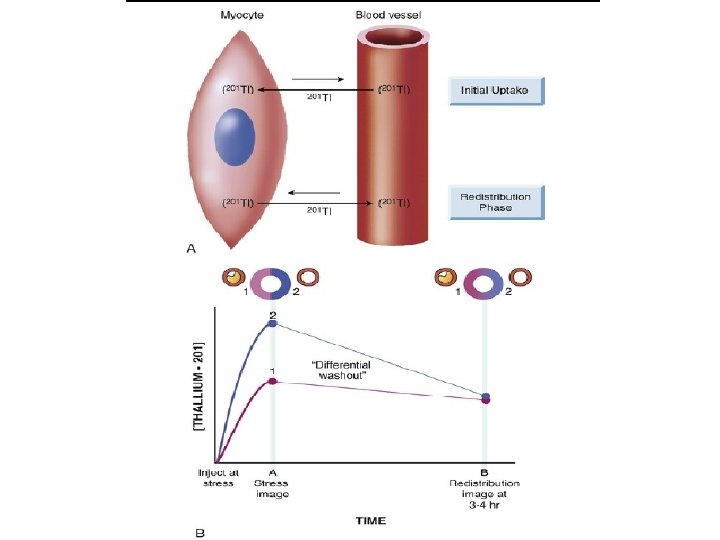

• Thallium studies can be divided into protocols in which • - 201 Tl is administered during stress and • - those in which it is given with the patient at rest. • After stress, the reversal of a thallium defect from the initial peak stress to delayed 3 - to 4 -hour or 24 -hour redistribution images is a marker of reversibly ischemic, viable myocardium. • When thallium is injected in the resting state, the extent of thallium defect reversibility from the initial rest images to delayed redistribution images (at 3 to 4 hours) reflects viable myocardium with hypoperfusion at rest. • When scarred myocardium is present, the initial rest or stress thallium defect persists over time; such deficits are termed irreversible or fixed defects.

• some severely ischemic but viable regions may show no redistribution on either early (3 - to 4 -hour) or late (24 -hour) imaging, even if viable myocardium is present. • Viable myocardium in this situation can be revealed by raising blood levels of thallium by reinjection of a small dose (1 to 2 m. Ci) of thallium at rest. • Thus, in some patients, thallium reinjection is necessary to identify viable myocardium when there are irreversible defects on stress-redistribution images.
–labeled myocardial perfusion tracers")
Technetium 99 m–Labeled Tracers • Technetium 99 m (99 m. Tc)–labeled myocardial perfusion tracers were introduced in the clinical arena in the 1990 s. • 99 m. Tc emits 140 ke. V of photon energy and has a physical halflife of 6 hours. • Despite the excellent myocardial extraction and flow kinetic properties of 201 Tl, its energy spectrum of 80 ke. V is suboptimal for conventional gamma cameras (ideal photopeak in the 140 -ke. V range). • In addition, the long physical half life of 201 Tl (73 hours) limits the amount of 201 Tl that may be administered to stay within acceptable radiation exposure parameters. • Although three 99 m. Tc-labeled tracers—sestamibi, teboroxime, and tetrofosmin—have received FDA approval for detection of CAD, only sestamibi and tetrofosmin are available for clinical use at present.

• Sestamibi and tetrofosmin are lipid-soluble cationic compounds with first-pass extraction fraction in the range of 60%. • They cross sarcolemmal and mitochondrial membranes of myocytes by passive distribution, and they are retained within the mitochondria. • Redistribution of these tracers is minimal compared with that for thallium. • Consequently, myocardial perfusion studies with 99 m. Tclabeled tracers require two separate injections, one at peak stress and the second at rest. • One important difference- tetrofosmin is cleared more rapidly from the liver, Earlier hepatic clearance allows earlier imaging and lessens the likelihood of artifacts related to hepatic uptake.

• Three basic protocols with 99 m. Tc-labeled tracers have been used: • (1) a single-day study, in which myocardial blood flow is interrogated at rest and at peak stress, or in the reverse order, as long as the first injected dose is low (8 to 12 m. Ci) and the second injected dose is high (24 to 36 m. Ci); • (2) a 2 -day study (commonly performed in patients with large body habitus), in which higher doses of the tracer are injected (24 to 36 m. Ci) both at rest and at peak stress to optimize myocardial count rate; and • (3) a dual isotope technique, in which injection of 201 Tl at rest is followed by injection of a 99 m. Tc tracer at peak stress. • The last approach takes advantage of the favorable properties of each of the two tracers, including the high-quality gated SPECT images obtained with 99 m. Tc and the potential to acquire redistribution images with 201 Tl (either at 4 hours before the stress study or at 24 hours after the 99 m. Tc activity has decayed

Advantages of Tc-99 m compared with Tl-201 Advantages of Tl-201 compared with Tc-99 m Shorter T 1/2 allows higher dose resulting in better count statistics. Redistribution allows for single injection studies viability assesment Less radiation exposure. Less expensive Less attenuation effects. Less abdominal and hepatic uptake during exercise High energy- better resolution with gamma camera Diagnostic and prognostic value of lung uptake of Tl-201 Faster imaging protocols due to reinjection.

STRESS PROTOCOLS • Exercise is the most commonly performed form of stress for myocardial perfusion SPECT • The exercise capacity, heart rate, and blood pressure responses and ST segment response are assessed during the exercise. • This provides additional clinical information useful in decision making.
 Tracer should")
• The basic tenets of exercise nuclear imaging are: • (i) Tracer should be administered IV at peak of stress, and • (ii) exercise should continue for an additional minute to allow optimal myocardial tracer concentration. • For patients undergoing treadmill exercise stress, achieving target heart rate (THR), traditional cut-off for an acceptable level of stress. • exercises should be symptom limited.

Pharmacologic Stress Protocols • Dipyridamole • acts by increasing the tissue levels of adenosine by inhibiting its intracellular reuptake and metabolism. • It is infused at 0. 142 mg/kg/min for 4 minutes. • The radiotracer injected 3– 4 minutes after termination of the infusion when maximal pharmacological effect ensues. • Side effects include nonspecific chest pain, shortness of breath, dizziness, and flushing. • The side effects can usually be reversed by IV administration of aminophylline, 50 - to 250 -mg at least 1 minute after the tracer injection. • contraindicated for patients with asthma.

Adenosine • It is infused over a period of 6 minutes (dosage, 0. 14 mg/kg/min), and the radiopharmaceutical is injected between 3 and 4½ minutes after the start of the adenosine infusion • Minor and transient side effects occur more frequently with adenosine as compared to those of dipyridamole. • As the half-life of adenosine is very short (few seconds), side effects usually subside within 30– 45 seconds of termination of infusion. • Aminophylline reversal is not required. • Adenosine is contraindicated in patients with second- or thirddegree AV block, sick sinus syndrome and history of bronchospasm.

Regadenoson • Regadenoson is a highly specific adenosine A 2 A receptor agonist that acts as a coronary vasodilator and has very low affinity for the A 1, A 2 B, and A 3 receptors. • Side effects of the Adenosine & Dipyridamole may include depressed function of sinoatrial and atrioventricular nodes and possible atrioventricular node block (A 1), severe peripheral vasodilation and hypotension (A 2 B), and bronchoconstriction that may be severe and life threatening (A 3) • Because regadenoson has little if any cross reactivity with the adenosine A 3 receptor responsible for bronchospasm, it is safer use in patients with asthma or chronic obstructive pulmonary disease with a reversible component • However, caution is advised when using regadenoson in patients with bronchospastic airway disease, and bronchodilator therapy should be immediately available.

• Regadenoson is administered intravenously at a dose of 0. 4 mg, followed by a saline flush. • The radiotracer 99 m. Tc sestamibi (mean dose and standard deviation, 7. 4 MBq [0. 2 m. Ci] per kilogram body weight ± 18. 5 [± 0. 5]) is injected 10– 20 seconds after the saline flush. • All patients who receive regadenoson also receive 150 mg of intravenous aminophylline at least 3– 4 minutes after the radiotracer injection, to prevent delayed side effects. • Whenever possible, patients undergoing pharmacologic stress induction with a vasodilator also complete a limited exercise protocol tailored to their physical ability. • The combination of walking with pharmacologic induction of stress has been shown to decrease medication-related side effects and reduce gastrointestinal uptake of the radiotracer, and it may also increase the diagnostic sensitivity of the examination

Dobutamine • inotropic stress, usually performed with dobutamine. • Dobutamine stress is associated with a lower rate pressure product than with exercise. • The most common side effects are chest discomfort, palpitations, and shortness of breath. • Due to the strong catecholamine stimulation, hypertension and premature ventricular complexes (PVCs) are also more frequent. • The effects of dobutamine begin to taper approximately 2 minutes after the termination of infusion. • Severe side effects may require IV administration of a short-acting β-blocker (esmolol, 0. 5 mg/kg over 1 minute). • IV metoprolol (5 mg) can also be used.

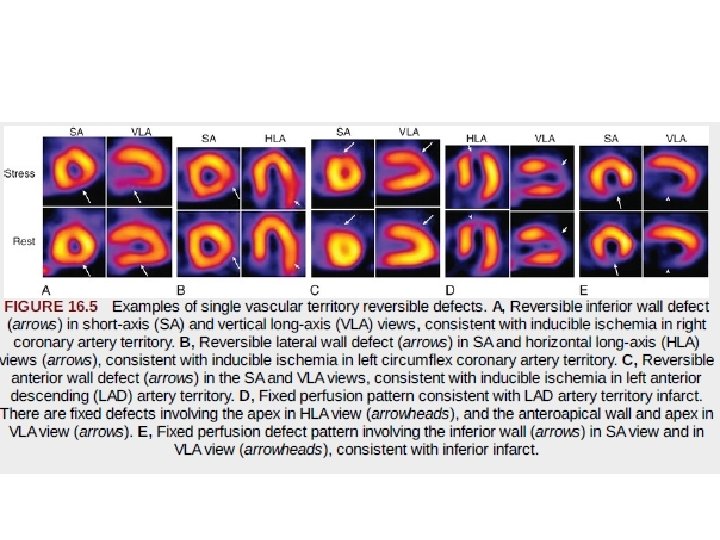
SPECT Image Interpretation and Reporting • SPECT myocardial perfusion images may be evaluated visually. • The interpreter describes the perfusion pattern findings on stress and then visually interprets whether defects observed on the stress images are or are not reversible.

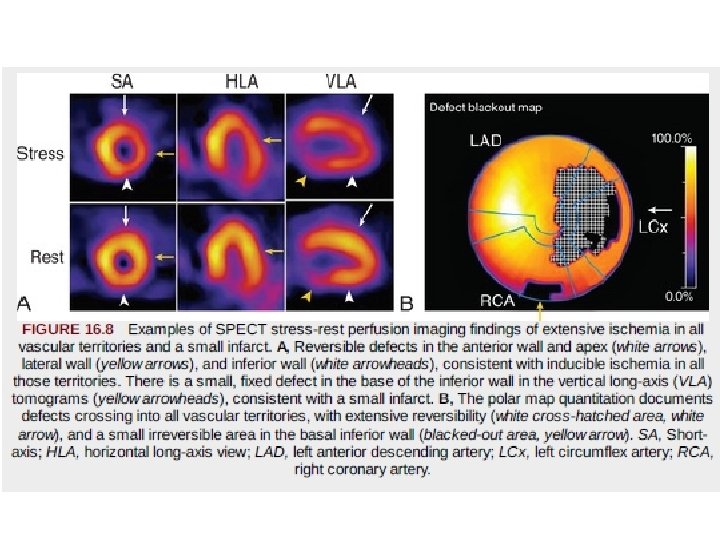
General Principles of Interpretation and Reporting. • Interpretation will include 1. description of the magnitude of abnormality 2. the extent of ischemia, 3. extent of infarct 4. localization to specific myocardial regions or vascular territories.

INFARCT VS ISCHAEMIA

DIFFERING EXTENT AND SEVERITY

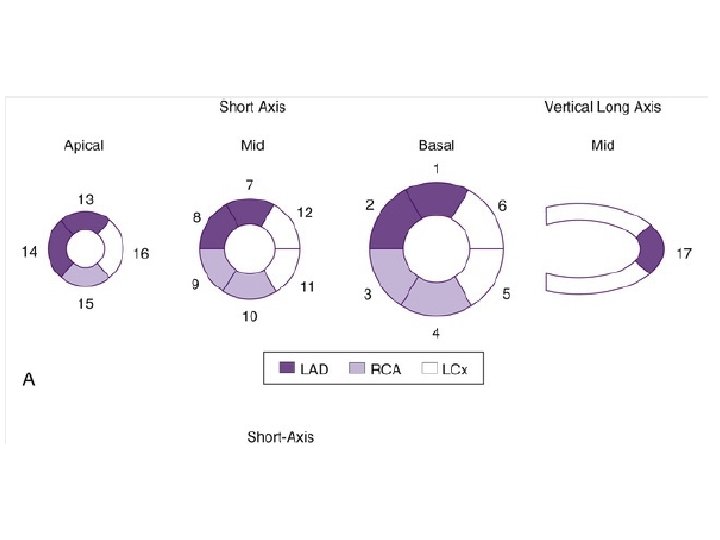
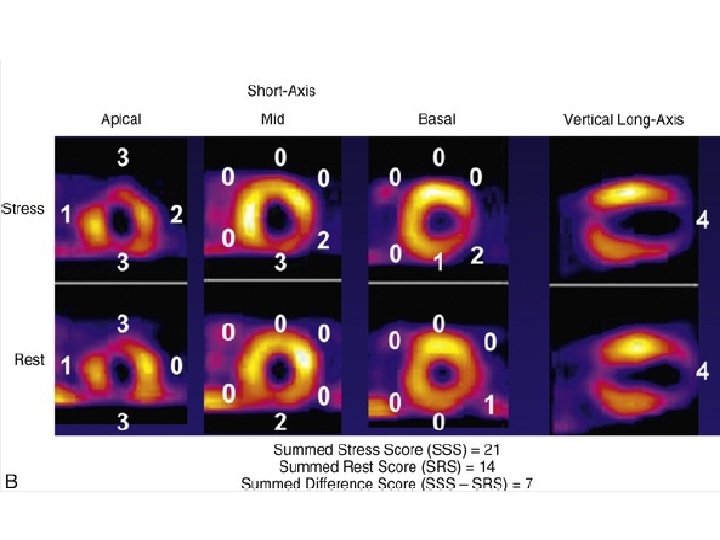
• To minimize subjectivity in image interpretation, semiquantitative visual analysis or fully quantitative computer analysis may be applied to MPI data. • With semiquantitative visual analysis, a score is assigned to represent perfusion for each of multiple segments of the myocardium. • A segmentation model has been standardized for this approach by dividing the myocardium into 17 segments on the basis of three short-axis slices and a representative long-axis slice to depict the apex • Perfusion is graded within each segment on a scale of 0 to 4, with • 0 representing normal perfusion and 4 representing a very severe perfusion defect. • Scores for all 17 segments are added to create a “summed” score.

• The sum of the segmental scores from the stress images, the summed stress score (SSS), represents the extent and severity of stress perfusion abnormality—the magnitude of perfusion defects related to both ischemia and infarction. • The sum of the 17 segmental scores from the rest images, the summed rest score (SRS), represents the extent of infarction. • The summed difference score (SDS) is derived by subtracting the SRS from the SSS and represents the extent and severity of stress-induced ischemia. • The segmental scores can be assigned subjectively by the image interpreter or automatically by widely available software programs.
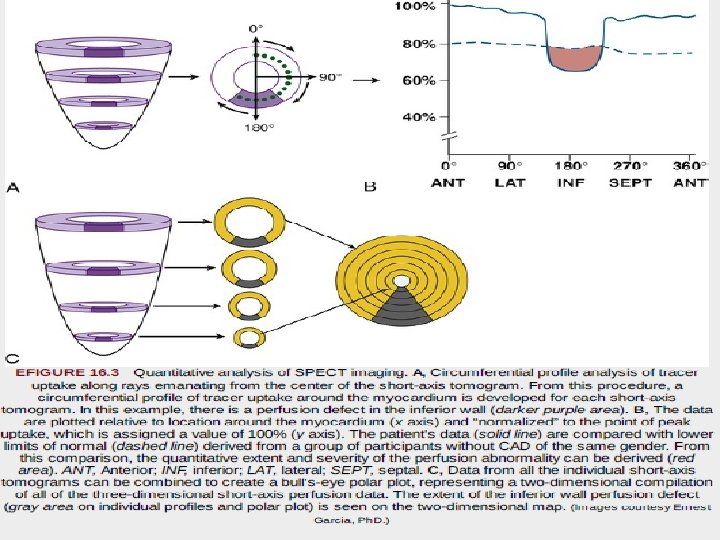

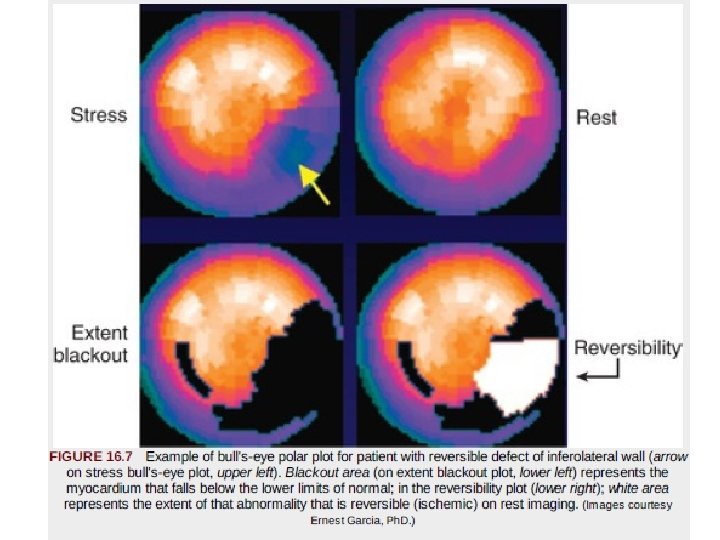
• “bull's-eye” or polar maps representing perfusion of the entire three-dimensional myocardium in a two-dimensional plot • Quantitative data may be derived on the 1. 2. 3. extent of global perfusion abnormality, the abnormality within vascular territories, and the extent of reversible and fixed defects. • These are often displayed as “blackout maps, ” in which any pixel values falling below a set number of standard deviations below the normal limits is assigned the color black, • and the extent of that abnormality is expressed as a percentage of the presumed vascular territory and as a percentage of the left ventricle

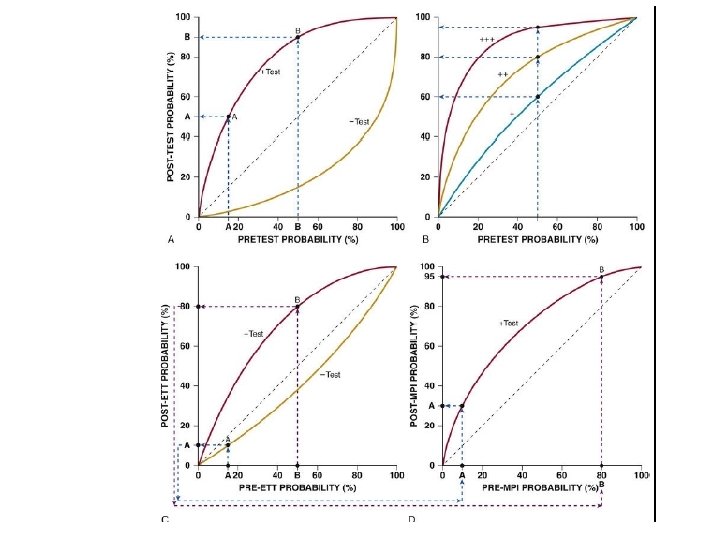
Incorporating Bayesian Principles Into Image Interpretation • Bayes theorem posits that the post-test probability of disease is influenced not only by the sensitivity and specificity of the test, but also by the pretest probability of disease • For a positive test result, the post-test probability of disease may be distinctly lower in a patient with a very low pretest probability of disease compared with a different patient with a much higher pretest probability

Important Signs in SPECT Imaging Analysis Beyond Myocardial Perfusion 1. lung uptake of tracer (particularly 201 Tl) and 2. transient ischemic dilation of the left ventricle.

Lung Uptake • In some patients, substantial tracer uptake is apparent throughout the lung fields after stress that is not present at rest • often have severe multivessel disease • It is likely that ischemia-induced elevation in LA and pulmonary pressures slows pulmonary transit of the tracer, allowing more time for extraction or transudation into the interstitial spaces of the lung, accounting for this imaging sign
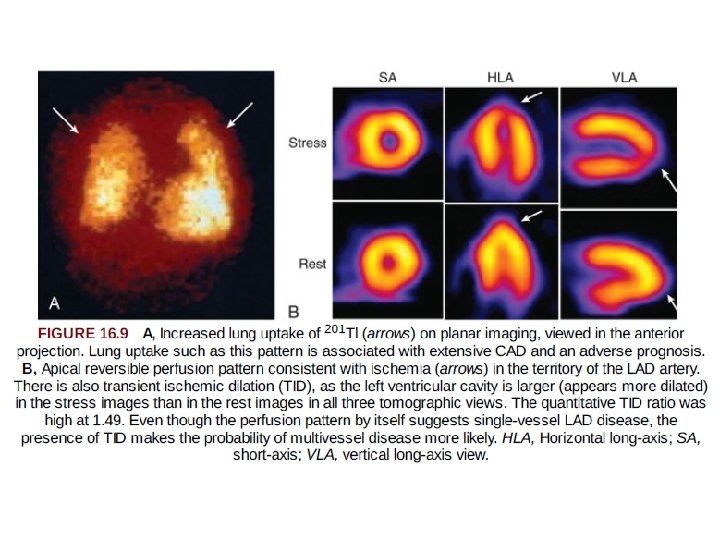

Transient Ischemic Dilation of the Left Ventricle • Transient ischemic dilation refers to an imaging pattern in which the left ventricle or left ventricular (LV) cavity appears larger on the stress images than on those obtained with the patient at rest • The pathophysiology -- extensive ischemia and prolonged postischemic systolic dysfunction, resulting in a dilated, dysfunctional left ventricle during the stress acquisition relative to the rest acquisition. • In other pts this pattern may represent diffuse subendocardial ischemia (relatively less tracer uptake in the subendocardium, creating the appearance of an enlarged LV cavity) and also is associated with severe and extensive CAD.
 is approximately")
Right Ventricular Uptake • Usually, the intensity of the right ventricle (RV) is approximately 50% of peak LV intensity. • Homogeneous increased RV uptake represents RV hypertrophy; most typically result from pulmonary hypertension. • Regional abnormalities of RV uptake may be a sign of ischemia or infarction in the distribution of the right coronary artery (RCA).

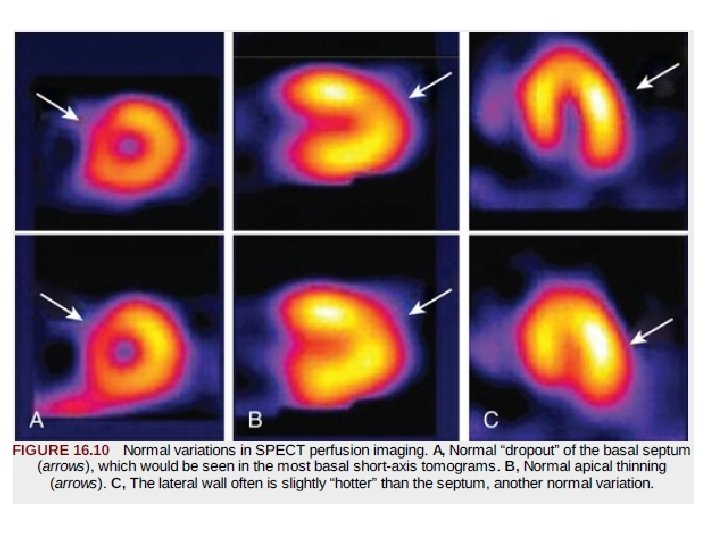
Common Normal Variations in SPECT Imaging. • Normal variations in perfusion images can be falsely interpreted as a defect. • “Dropout” of the upper septum secondary to merging of the muscular septum with the membranous septum • Apical thinning is another variation of normal that can be mistaken for a perfusion defect

• The apex is anatomically thinner than other myocardial regions, creating this appearance. • In normal SPECT images the lateral wall often may appear brighter than the contralateral septum • This difference is not caused by a disparity in lateral versus septal wall myocardial blood flow. • Rather, during a SPECT acquisition, the camera is physically closer to the lateral myocardial wall (in proximity to the lateral chest wall) than to the septum so subject to less soft tissue attenuation.

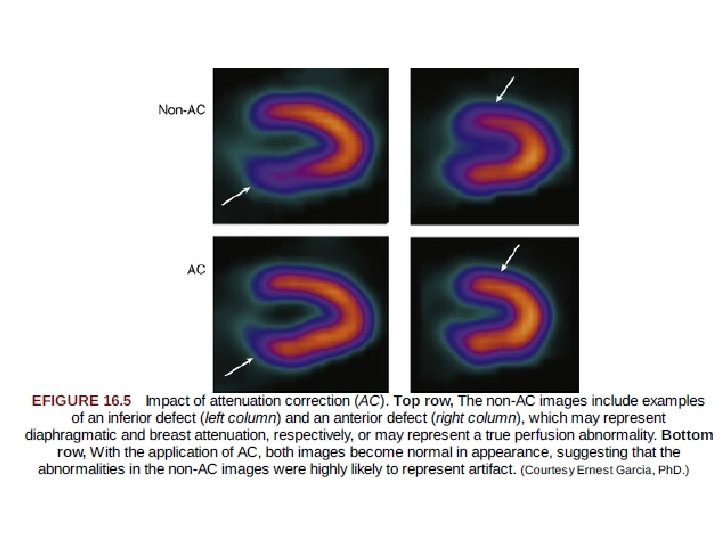
Technical Artifacts Affecting Image Interpretation • Photon Attenuation. This refers to undetected events in the heart caused by interaction of photons with the intervening soft tissue, breast, or diaphragm. • Breast Attenuation. • In patients with large or dense breasts, significant attenuation may create artifacts varying considerably in their appearance and location • The availability of gender-matched quantitative databases had a favorable although modest impact on this issue, because such databases generally consist of individuals of average body and breast size.

• Several approaches to minimizing the impact of breast tissue have been taken to improve specificity (lowering the false-positive rate) in women. • Most well validated is ECG-gated SPECT imaging with 99 m. Tc-based agents • The presence of preserved wall motion in the setting of a mildly to moderately severe fixed defect of the anterior or anterolateral wall suggests the absence of infarction and supports the interpretation of attenuation artifact • Specificity for ruling out CAD in women has been improved significantly with this technique

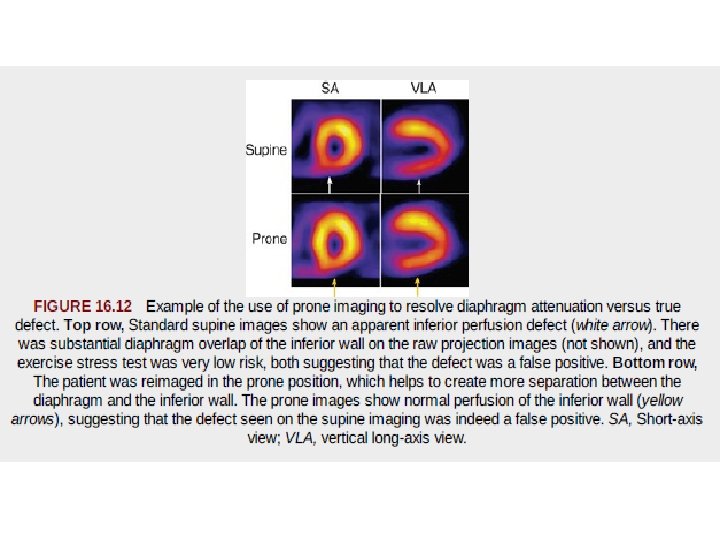
Inferior Wall Attenuation. • frequently encountered in SPECT imaging. – caused by extracardiac structures, such as the diaphragm overlapping the inferior wall – In addition, longer distance of the inferior wall to the camera means that photons must traverse a greater thickness of tissue before reaching the detectors, which may increase the degree of scatter and attenuation

Artifacts of Left Bundle Branch Block • Patients with LBBB - reversible or fixed perfusion defect in the septum during exercise or dobutamine-induced stress (which is associated with a significantly increased heart rate). • Decrease in septal blood flow at higher heart rates may be related to asynchronous septal contraction and incomplete relaxation of the septum during diastole in patients with LBBB. • So stress should be induced by vasodilators, as it has a limited effect on heart rate.

• Besides the appearance of septal perfusion defect, gated. SPECT studies also demonstrate asynchronous, hypokinetic, or paradoxical septal wall motion. • However, while septal motion may be abnormal, normal septal wall thickness is often preserved in the presence of LBBB. • Perfusion defect due to LBBB typically spares the apex and anterior wall segments and any involvement of these regions along with septal perfusion defect is highly suggestive of the presence of concomitant obstructive stenosis of the LAD.

Attenuation Correction Methods • The 511 -ke. V photons emitted in PET imaging are attenuated less per centimeter of soft tissue than are the lower-energy 80 - to 140 -ke. V photons typically emitted by SPECT radiotracers. • In SPECT imaging, a single photon needs to travel from the heart to the camera; in PET imaging, two coincident photons (i. e. , emitted simultaneously) need to travel across the entire body to reach their respective detectors • Therefore, attenuation correction for SPECT is theoretically more challenging.

PET Attenuation Correction. • To measure the attenuation correction factor, a rod that rotates about the patient is filled with germanium-68, or a cesium-137. • The rod is first made to rotate at a fixed speed in the gantry, and total coincident counts are measured without the patient (the blank scan) and repeated with the patient (the transmission scan). • The ratio of coincident counts of blank scan and those of transmission scan yields the array of attenuation correction factors needed to correct each projection line. • Once each projection line has been corrected for attenuation (and scatter), the emission data reconstructed. • As long as the patient does not move during the scanning procedure, cardiac PET images will be free from attenuation artifacts

Gated SPECT Imaging • Incorporation of ECG-gated SPECT perfusion imaging for simultaneous assessment of LV function and perfusion. • in which an average cardiac cycle is created representing the average of several hundred beats acquired over 8 to 15 minutes.

FIGURE : Basis for the technique of ECG gating. A, The scintigraphic acquisition data are collected in conjunction with the electrocardiogram. The R-R interval is divided into a prespecified number of “frames” (in this example, eight frames). At a heart rate of 60 beats/min (1000 msec/beat), each of the eight frames would comprise 125 milliseconds. For the first 125 milliseconds after the peak of the initial R wave, all imaging data are recorded in frame 1; the second 125 milliseconds are recorded in frame 2, and so on, until the peak of the next R wave is detected, and this is repeated for each beat in the acquisition. Frame 1 thus represents the end-diastolic events, and one of the frames in the middle of the acquisition (frame 4 in this example) represents end-systolic events. B, Examples of gated SPECT perfusion imaging. Short-axis images are seen at end diastole and at end systole. C, Similar timing with images displayed in the vertical long-axis orientation. Visually, wall thickening and brightening are seen across the course of systole. These events represent changes in regional and global function across the cardiac cycle. D, ECGgated equilibrium radionuclide ventriculographic schematic images are shown at diastole and at end systole.

• High-quality ECG-gated images require that the cardiac cycles that are included have reasonably homogeneous beat lengths. • This usually is accomplished by beat-length windowing. • Typically, cycles with the beat length represented by the average heart rate of the patient, along with cycles fluctuating up to 10% to 15% around the average beat length, are allowed into the acquisition. • Cardiac cycles with cycle lengths above or below that limit are rejected. • For example , The short pre-PVC beat and the more prolonged post. PVC beat would not be allowed into the acquisition, which have distinctly different systolic and diastolic characteristics from those of the beats occurring during normal sinus rhythm.

Gated SPECT Interpretation of Regional Wall Motion • Normal regional systolic function is depicted as brightening of the wall during systole • The wall appears to thicken, with apparent endocardial excursion. • Although tracer concentration within the myocardium is constant during a gated SPECT image acquisition, the recovery of counts (and thus the brightness of the object being imaged) is related to wall thickness. • Thus, during systolic wall thickening – appears that the LV wall becomes brighter and thicker, even though the isotope concentration per gram of myocardial tissue is actually unchanged. • This principle forms the basis for gated SPECT imaging.

1. Normal-Regions that brighten normally have normal regional systolic performance. 2. Hypokinetic- regions with diminished brightening 3. Severely hypokinetic- Regions with slight brightening 4. Akinetic- regions with no apparent brightening

Hypokinesia vs akinsia

Gated SPECT Assessment of Global Left Ventricular Function • All contemporary camera-computer systems have software capable of quantifying global LV function and computing the EF. • These computer-based methodologies are fully automated and thus highly reproducible. • The most common method involves automated interrogation of the apparent epicardial and endocardial borders of all the tomograms in all three orthogonal planes • These multiple two-dimensional contours are then reconstructed to create a surface-rendered three-dimensional display representing global LV function across the average cardiac cycle • The three-dimensional display is accompanied by automated calculation of EF and LV volumes.
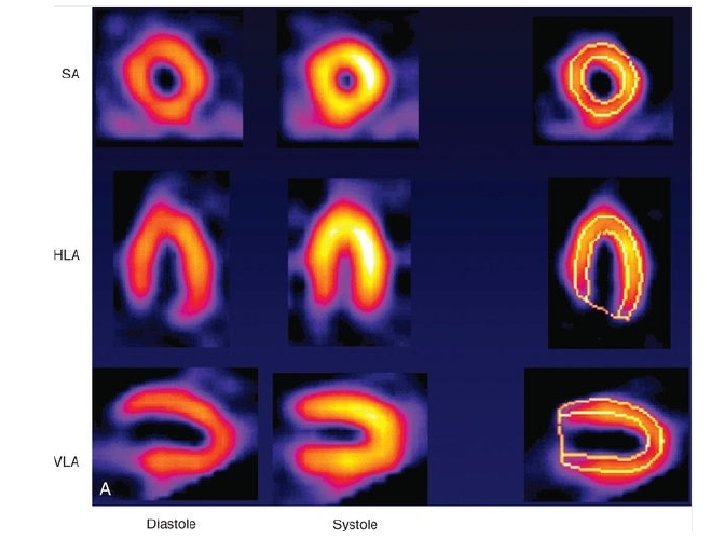

FIGURE 16. 15 From the contours that are created from all the two-dimensional tomograms, a threedimensional surface-rendered image of the left ventricle can be created and displayed in multiple orientations, here frozen at end diastole (left) and end systole (right). The green “mesh” represents the epicardium, and the gray surface represents the endocardium. Ejection fraction (EF) is quantified from the volume change. During image interpretation, gated SPECT images are displayed in the cine format as an endless loop movie, rather than as the still frames depicted here.

• EF measurements from automated analysis of ECG-gated SPECT MPI have been extensively validated. • Across a wide range of LV function, and even in the setting of severe perfusion defects, ECG-gated SPECT imaging provides robust, reproducible estimates of LVEF. • The addition of LV function data to the perfusion information provides incremental and independent prognostic information. • Gated SPECT imaging also has been an important advance in helping to differentiate attenuation artifacts from infarct, because regions with persistent low counts that show normal motion and thickening represent soft tissue artifacts rather than scar • Thus, gated SPECT has improved the specificity of perfusion imaging for ruling out CAD, particularly in women.

Positron Emission Tomography • measurement of myocardial perfusion and metabolism can be obtained with PET in absolute quantitative terms, a potential advantage compared with SPECT imaging. • The radiotracers used in PET are labeled with positron-emitting isotopes that have chemical and physical properties identical to those of naturally occurring elements, such as carbon, oxygen, nitrogen, and fluorine. • Although most positron-emitting radiotracers are cyclotron produced with short half-lives • Clinically available cardiac PET radiotracers fall within two broad categories: – evaluate myocardial perfusion – myocardial metabolism.
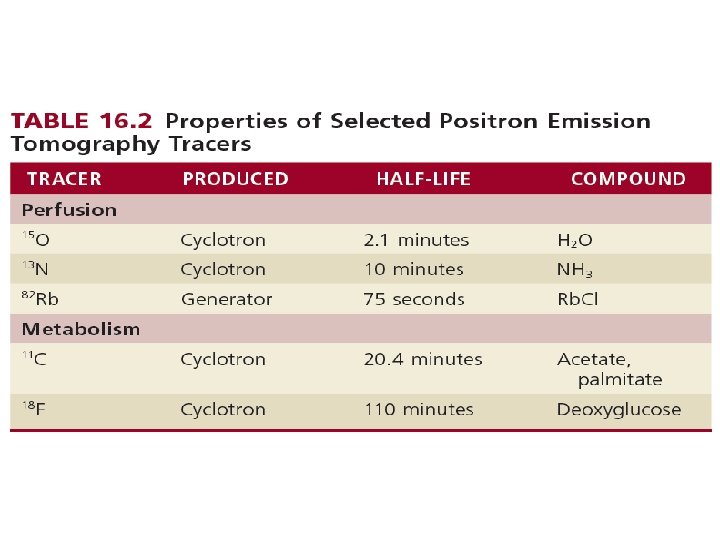

Image Acquisition. • The process by which a positron-emitting radionuclide attempts to stabilize over time is termed beta decay, which occurs when the nucleus of an atom emits a positron. • After a high-energy positron is emitted from a nucleus ultimately collides with an electron. • This collision results in complete annihilation, with conversion to energy in the form of electromagnetic radiation composed of two high-energy gamma rays, each with 511 -ke. V energy. • gamma rays travel in perfectly opposite directions (180 degrees from each other). PET detectors can be programmed to register only events with temporal coincidence of photons that strike at directly opposing detectors. • the coincidence detection with PET provides “intrinsic” collimation and improves the sensitivity of the camera.
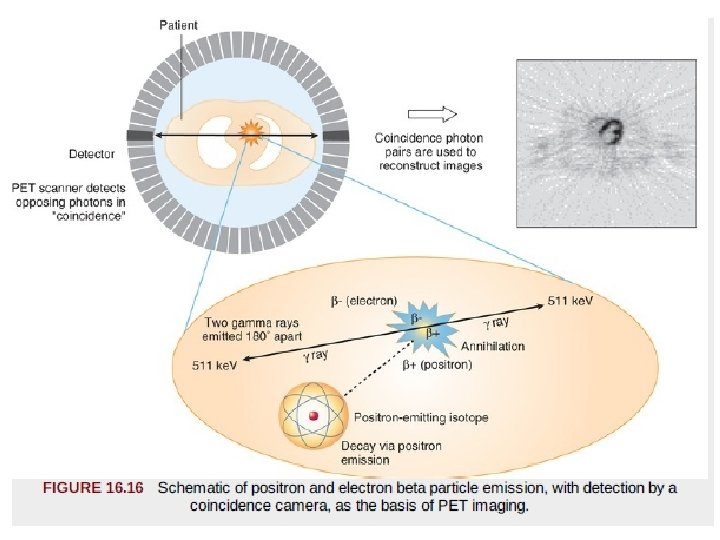

Image Analysis. • Emission data are displayed as tomograms in the horizontal and vertical long-axis and short-axis views, as in SPECT display. • If the data are acquired in dynamic mode, with appropriate mathematical modeling, myocardial perfusion and metabolic data can be displayed in absolute terms: • in milliliters per gram per minute for blood flow • moles per gram per minute for metabolism
 freely diffusible tracers - which accumulate and wash out")
PET Perfusion Tracers • (1) freely diffusible tracers - which accumulate and wash out from myocardial tissue as a function of blood flow – O 15 H 2 O. – makes it possible to repeat studies in rapid sequence. – they do not depend on a metabolic trapping mechanism, which might change as a function of a changing metabolic environment. • (2) nondiffusible tracers - characterized by retention in myocardial tissue as a function of blood flow. eg. 82 Rb and 13 N-ammonia – easier to image, because the tracer is retained in myocardium for a reasonable length of time.

• 82 Rb is a cation, 1. with biologic properties similar to those of potassium and thallium, and active transport by the Na+, K+-ATPase pump. 2. its extraction fraction does not change significantly over a wide range of metabolic conditions. 3. the very short half-life of 75 seconds 4. it is generator produced, and it can be used clinically without the need for an on-site cyclotron.

• 13 N-ammonia is an extractable perfusion tracer 1. physical half-life of 10 minutes. 2. Its transport across cell membranes may occur by passive diffusion or by the active Na+-K+ transport mechanism. 3. Retention of 13 N-ammonia in the myocyte involves metabolic trapping.
")
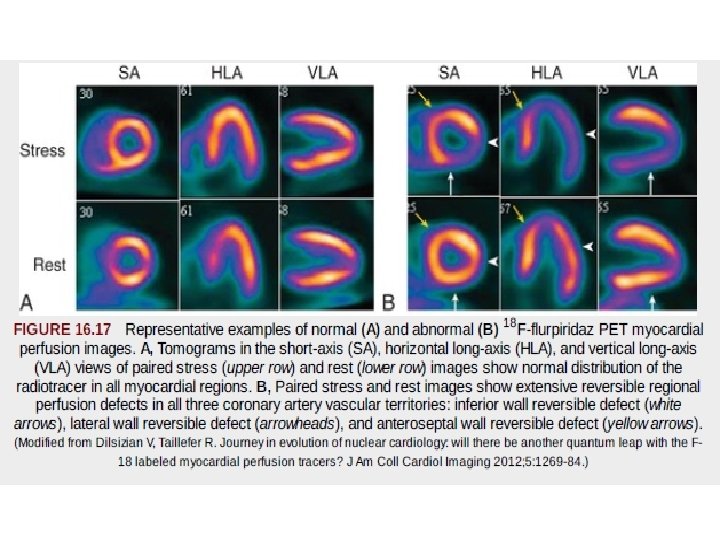
PET Perfusion Tracers: Research Directions. • The longer half-life of 18 F (110 minutes) allows the possibility of distribution as a single-dose unit on a daily basis, which may facilitate the clinical application of myocardial perfusion PET imaging. • the longer half-life of 18 F would allow assessment of perfusion during treadmill exercise, rather than with vasodilator stress alone. • One such investigational agent, 18 F-flurpiridaz PET, has been studied in phase II and III clinical trials in comparison with 99 m. Tc SPECT. • The high spatial resolution of PET imaging, along with high target-to background ratios achieved with 18 F-flurpiridaz, allows the acquisition of very-high-quality electrocardiographic-gated PET images compared to SPECT

Clinical Application of PET Myocardial Perfusion Imaging • Advantages of PET perfusion imaging over SPECT include – higher spatial resolution, – improved attenuation and scatter correction, and – potential for quantifying regional blood flow – the potential for early identification of CAD. • the interpretation of SPECT myocardial perfusion imaging studies has been primarily qualitative or semiquantitative in nature. • SPECT - soft tissue attenuation, which tends to degrade image quality, particularly in patients who are obese or have large body habitus, and increase interpretive errors. • PET permits the assessment of regional MBF of the left ventricle in absolute terms (m. L/min/g tissue).
![• Disadvantage • the requirement of an on-site cyclotron for [13 N] ammonia](http://slidetodoc.com/presentation_image_h2/3562eed07183accbf3623d8cab84001b/image-86.jpg "• Disadvantage • the requirement of an on-site cyclotron for [13 N] ammonia")
• Disadvantage • the requirement of an on-site cyclotron for [13 N] ammonia and the high cost of monthly generator replacement for 82 Rb. • the relatively short half-life of both 82 Rb and [13 N] ammonia limits the utility of PET perfusion studies to patients undergoing pharmacologic stress only.
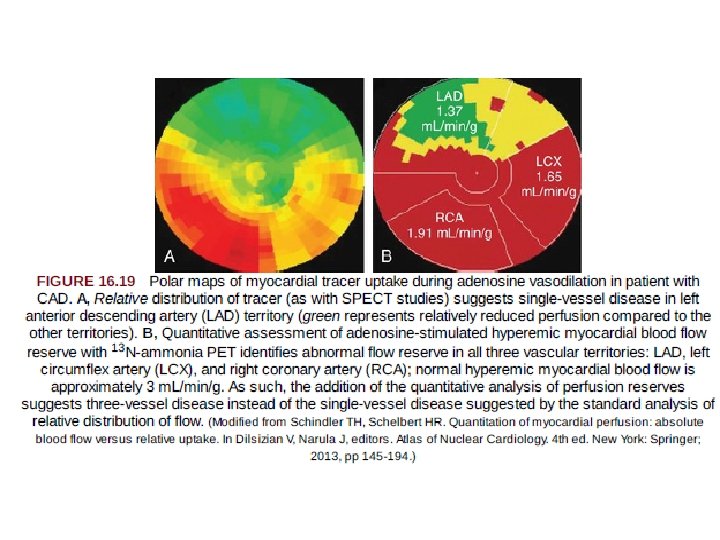

Progress in PET Absolute Hyperemic Myocardial Blood Flow and Flow Reserve Assessment • PET absolute MBF provides a noninvasive alternative to invasive functional assessment of CAD, which may obviate the need for coronary angiography. • At present, quantitative absolute MBF measurements with PET 1. 2. 3. 4. 5. most helpful in patients without known prior history of cardiac disease who present with symptoms suspicious for myocardial ischemia, patients with known CAD in whom more specific physiologic assessment is desired, identification of an increased suspicion for multivessel CAD, situations with a disparity between visual perfusion abnormalities and apparently normal coronary angiography to assess possible microvascular dysfunction, and patients with heart transplant when vasculopathy may be present.
 ratio")
• It is important to recognize, however, that myocardial flow reserve (MFR) ratio can be spuriously lowered by elevated resting blood flow in the denominator, as seen in patients with hypertension or high resting rate pressure product. • Thus, it is important to interpret both hyperemic MBF and flow reserve in all patients.

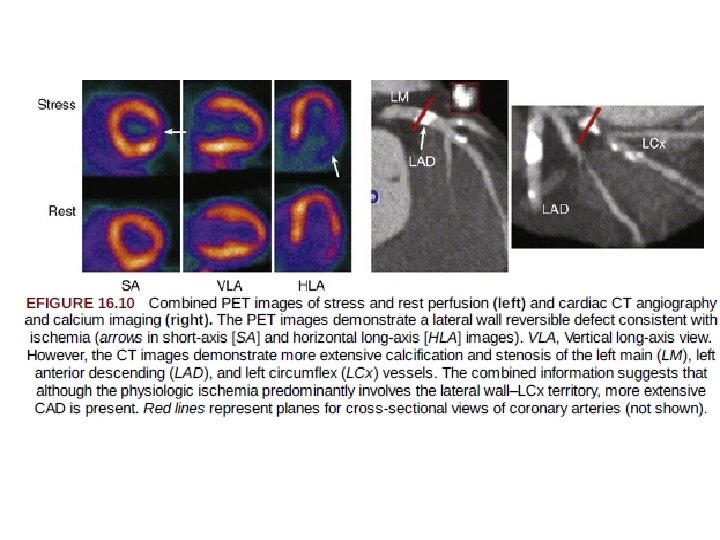
Combined PET-CT and SPECT-CT Scanners • a tool for obtaining complementary anatomic and functional information in a single imaging session. • CT angiography - anatomic assesment of anatomic lesions. • whereas PET and SPECT provide- functional consequences of anatomic lesions. . • particularly relevant in patients who have an intermediate finding on either SPECT-PET or CT angiography. • The advantage afforded by the combined scanner is that the corresponding images are spatially aligned and can be acquired during a single imaging session. • The incremental radiation dose from performing two diagnostic studies also should be considered

• Use hybrid PET-CT • should be limited to only a small subset of patients in whom the knowledge of both coronary anatomy and physiology would be anticipated to have an impact on clinical management (e. g. , anomalous coronary anatomy or myocardial bridging and chest pain). • All other applications, such as • detection of endothelial dysfunction or microvascular disease and • identification of soft plaques, remain experimental at this time, with limited clinical data to support • widespread clinical application.

CT Attenuation Correction for PET • A subsidiary benefit of hybrid PET-CT and SPECT-CT imaging systems is in the potential to use the CT image to create the attenuation map for the MPI data. • This approach has allowed the replacement of germanium-68 or cesium-137 transmission scans with faster CT scans, reducing the overall duration of the PET procedure. • One potential problem of using fast CT scans for attenuation correction, however, is the motion of the organs during respiration. • The CT scanner “freezes” the heart, lungs, and liver at one point in the respiratory cycle, whereas the PET emission data are averaged over many respiratory cycles. • Methods using respiratory gating to correct this problem are currently under investigation.

Planar Myocardial Perfusion Imaging • In planar imaging, three separate two dimensional images are obtained with the gamma camera after radiotracer injection and uptake into the myocardium. • The three standard views are an 1. anterior, 2. left anterior oblique, and 3. more lateral view. • Disadvantage- substantial overlap of myocardial regions, with less differentiation of smaller and particularly milder perfusion abnormalities.
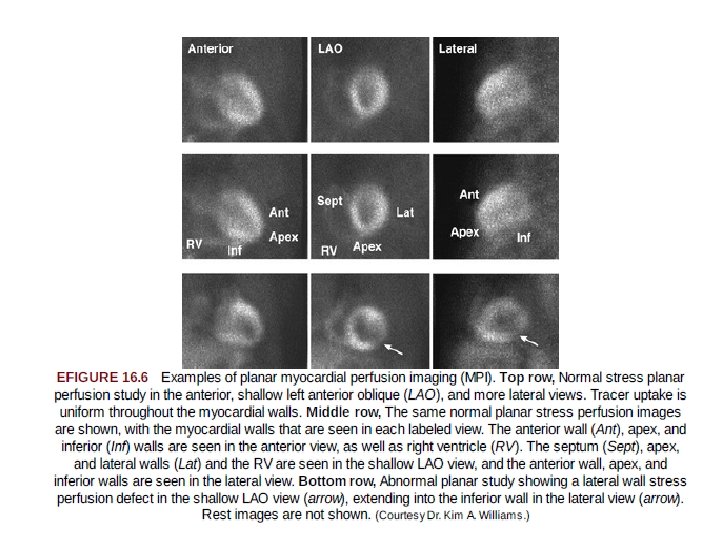

• Advantage of planar imaging over SPECT imaging is its simplicity. • Each of the three views can be acquired during 5 to 8 mins. • less affected by patient motion than is SPECT imaging. • With planar imaging, extensive image processing is not required as with SPECT, so there are fewer sources of potential error and artifact. • In contemporary practice, planar imaging may be used for patients who do not tolerate the position that must be maintained during a SPECT acquisition, those who have difficulty coping with presence of the larger SPECT camera so close to the body, or those with large body habitus that surpasses the weight and size limits of SPECT systems.

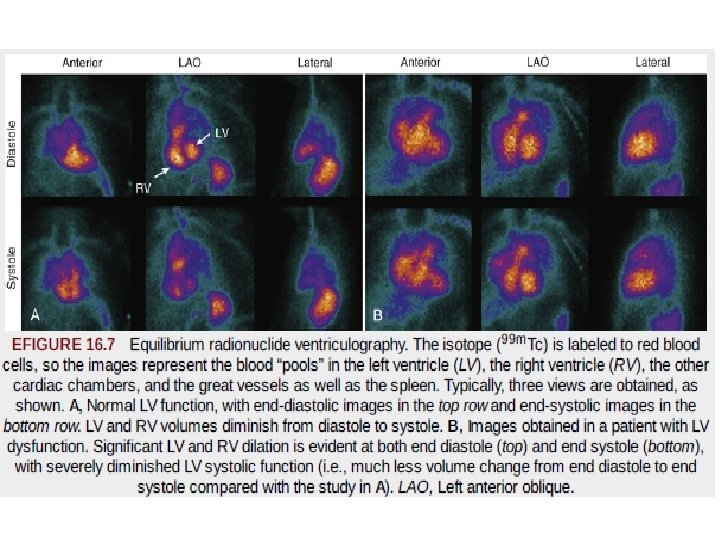
Radionuclide Ventriculography or Angiography • Also known as radionuclide angiography or blood pool imaging. • RVG may be performed using 1. first-pass or 2. equilibrium-gated techniques ( OR multiple gated acquisition (MUGA) scanning) • Although the two techniques each use data-recording methods, they provide similar results for global EF and chamber volumes.
 • data are recorded in")
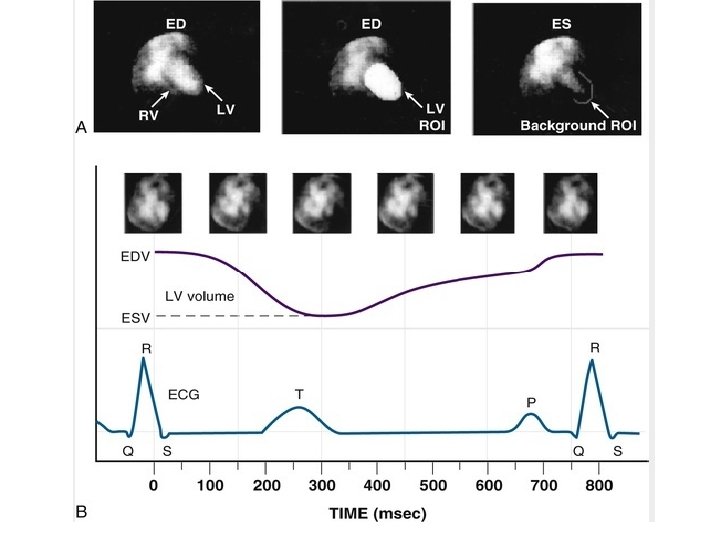
Equilibrium Radionuclide Angiography or Ventriculography (Gated Blood Pool Imaging) • data are recorded in a computer system synchronized with the R wave of the patient's ECG, similar to ECGgated SPECT • For labeling of the blood pool, 99 m. Tc is bound to red blood cells (RBCs) or albumin. • Image contrast usually is better with 99 m. Tc-labeled RBCs, but 99 m. Tc-labeled albumin is preferable in patients in whom RBC labeling may be difficult. • Labeling of RBCs with 99 m. Tc-pertechnetate requires a reducing agent, stannous pyrophosphate, which is administered 15 to 30 minutes before pertechnetate injection.

Image Acquisition. • Images of the heart are usually acquired in three standard projections: 1. anterior, 2. “best septal” left anterior oblique (best separation of the left and right ventricles), and 3. left lateral. • The minimum framing rate for a rest RVG study is 16 frames/cycle (approximately 50 msec/frame). • For quantitative assessment of diastolic indices and regional EF, the framing rate should be increased to 32 frames/cycle (approximately 25 msec/frame).

• Arrhythmias such as multiple PVCs can adversely affect the study if these beats account for more than 10% of the total. • In patients with atrial fibrillation, there may be considerable beat-to-beat variability, and the mean EF obtained during the period of acquisition may underestimate the actual LVEF.

Image Display and Analysis. • Qualitative inspection of equilibrium studies as an endless cinematic loop of the cardiac cycle allows assessment of (1) size of heart chambers and great vessels; (2) regional wall motion; (3) global function (qualitative assessment) (4) ventricular wall thickness, pericardial effusion, pericardial fat pad, or paracardiac mass; and • (5) extracardiac uptake, such as splenomegaly. • •

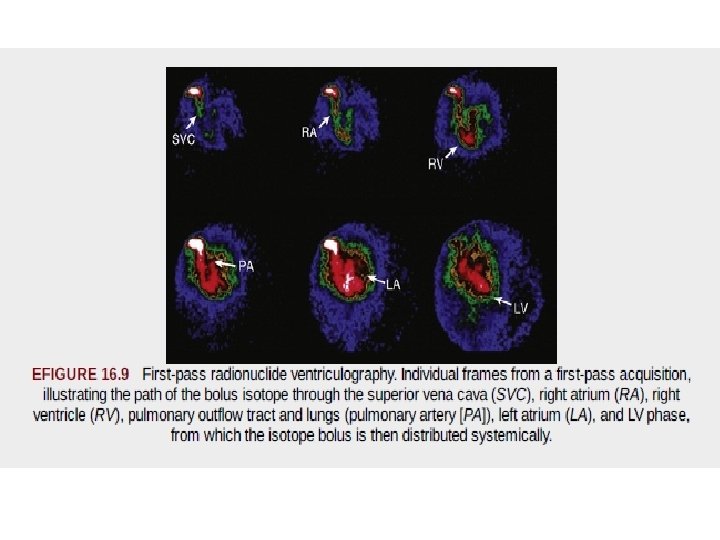
First-Pass Radionuclide Angiography or Ventriculography • In first-pass RVG studies, the bolus of radioactivity passes initially through the right chambers of the heart, then through the lungs, and finally through the left-sided chambers of the heart. • Radiopharmaceuticals used for this purpose must produce adequate counts in a short time at an acceptably low radiation dose to the patient

Image Acquisition. • Images are acquired very rapidly as the tracer passes through the heart chambers. • Separation of the right and left ventricles is achieved because of the temporal separation of the bolus. • Images are acquired in the supine position after the rapid injection of 10 to 25 m. Ci of tracer through an 18 -gauge or larger intravenous catheter placed in the medial antecubital or external jugular vein. • The shallow (20 - to 30 -degree) right anterior oblique projection is used, to optimize separation of the atria and great vessels from the ventricles and to view the ventricles parallel to their long axes. • A 1 -m. Ci tracer dose may be used to ensure proper positioning so that the right and left ventricles are in the field of view.

Comparison of Equilibrium and First-Pass Techniques • Advantages of the first-pass technique are – the high target-to-background ratio, – more distinct temporal separation of the cardiac chambers, and – rapidity of imaging. • RVEF may be more readily assessed by the first-pass technique because of the more distinct separation of this structure from the other chambers with that technique.

• Advantages of equilibrium technique – the potential for repeated assessment of cardiac function during rapidly varying physiologic conditions, – high count density, and – acquisition of images in multiple projections. • the equilibrium technique is performed much more frequently.


Assessment of Myocardial Blood Flow at Rest • the uptake of SPECT perfusion tracers and retention of these tracers do reflect intact regional flow an, also intact myocyte cell membrane integrity. • Decreased regional myocardial tracer uptake at rest could reflect either lack of cell membrane integrity in an area of infarcted myocardium or reduced blood flow secondary to hibernating but viable myocardium. • A severe reduction in tracer activity usually signifies infarction, but a more moderate reduction in regional activity of a blood flow tracer alone cannot always differentiate hibernating from partially scarred myocardium in patients with ischemic LV dysfunction. • In these patients, techniques that assess intact cellular metabolic processes (e. g. , FDG), the myocardial potassium space (e. g. , 201 Tl redistribution), or the presence of some degree of uptake of the 99 m. Tc tracers may be used as an adjunct to assessing viability of the myocardium.

Imaging of Myocardial Infarction • severely reduced uptake of a radionuclide perfusion tracer in a rest study is a good marker of presence, location, and extent of MI

Assessment of Infarct Size • Contemporary studies have used 99 m. Tc-sestamibi to provide an assessment of infarct size. • Because clearance from the myocardium after initial uptake of this tracer is minimal, images acquired even hours after initial injection represent a “snapshot” of blood flow conditions and tracer uptake at the time of injection. • Infarct size as assessed by quantitative analysis of rest sestamibi uptake has been validated against many other measures of infarct size. • Moreover, a significant association between SPECT infarct size and death occurring during long-term follow-up has been demonstrated. • Many clinical trials now use “final infarct size” as determined by sestamibi SPECT imaging as an early post-MI surrogate endpoint to assess new agents to reduce infarct size. • When a tracer such as sestamibi is injected during acute MI in the setting of an occluded infarct-related artery before reperfusion therapy, the resulting defect, even when imaged hours later after successful reperfusion, represents the “area at risk” of the occluded artery.

• A second injection of sestamibi at rest with subsequent imaging can be done later during the post-MI course and represents final infarct size. • The change in defect size between the initial image acquired in the acute stage and the later image represents the magnitude of salvaged myocardium from reperfusion. • Therefore, SPECT imaging at rest in the early post -MI period can provide important information about final infarct size and infarct zone viability

Assessment of Myocardial Perfusion During Stress • Oxygen extraction by the myocardium is nearly maximum at rest; thus any increase in oxygen demand can be met only through increasing coronary blood flow to deliver more oxygen per unit time • The major determinants of coronary blood flow include the perfusion pressure at the head of the system (principally aortic diastolic pressure) and the downstream resistance, residing predominantly in the coronary arteriolar bed. • Because aortic diastolic pressure during exercise varies little from the value at rest, the major mechanism responsible for increasing coronary blood flow during stress involves a reduction in coronary vascular resistance.

• During exercise stress, coronary blood flow can increase approximately two to three times above levels at rest. • During pharmacologic stress to minimize coronary arteriolar resistance, using intravenous coronary arteriolar vasodilator agents such as dipyridamole, adenosine, or regadenoson , coronary blood flow can increase up to four to five times above rest levels. • The magnitude of blood flow increase secondary to any stress relative to flow values at rest is termed the coronary blood flow reserve.

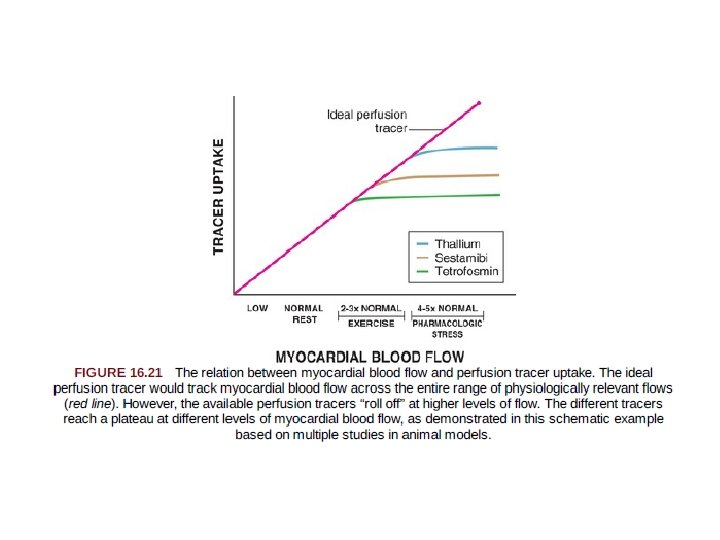
Perfusion Tracers and Coronary Blood Flow Reserve • The ideal perfusion tracer should track MBF across the entire physiologically relevant range achievable in animal models and in humans • It should be extracted rapidly (from the blood into the myocyte), because the hemodynamic conditions during peak stress are not maintained for long periods. • The ideal tracer also should be extracted as completely as possible out of the bloodstream, and it should be retained in myocardium for a sufficient period to be imaged. • Moreover, perturbations in metabolic conditions, such as ischemia or common cardioactive drugs, should neither influence nor interfere with uptake so that the resulting regional tracer concentrations primarily reflect myocardial perfusion
, the energy spectrum of 201")
• Despite its excellent first-pass myocardial extraction (85%), the energy spectrum of 201 Tl is lower (69 to 80 ke. V) than optimum for current gamma cameras. • The 140 -ke. V energy spectrum of 99 m. Tc perfusion tracers results in less scatter and soft tissue attenuation, with improved spatial resolution compared with thallium. • However, the first-pass myocardial extraction of both sestamibi and tetrofosmin is only in the 60% range with nonlinear extraction at high flows. • Thus, none of the clinically available SPECT perfusion tracers has all the properties of an ideal perfusion tracer • The PET perfusion tracer 13 N-ammonia displays an extraction fraction exceeding 90%; 82 Rb has a lower extraction fraction and reaches a plateau more rapidly at hyperemic range of flow. • In the clinical setting, evaluation of regional MBF and flow reserve with 13 N-ammonia and 82 Rb has been validated for detection and localization of CAD.

THANK YOU


https: //www. ncbi. nlm. nih. gov/pmc/articles/PMC 6133155/
- Slides: 122