BASIC STATISTICS Westgard Rules and Multirules Dr Hijab

BASIC STATISTICS, "Westgard Rules" and Multirules Dr. Hijab Batool Chemical Pathology

BASIC STATISTICS • Mean • Standard Deviation • Degrees of freedom • Variance • Normal distribution • Coefficient Of Variation

Are any calculations necessary if the control material has an assay sheet that lists the range of acceptable values for my method? • We need to collect our own control measurements and calculate the control limits that apply in our own laboratory. • Values and limits found on assay sheets often describe the performance observed by a specific method in several different laboratories, which means that the figures are likely to include variations that occur between laboratories. • If the control limits are too wide, we won't be able to detect problems in our own laboratory.

US CLIA regulations "When calibration or control materials are used, statistical parameters (e. g. , mean and standard deviation) for each lot number of calibration material and each lot of control material must be determined through repetitive testing. "

Mean, SD, CV How many control measurements should be collected before making these calculations? • The rule of thumb is to collect at least 20 measurements over at least 2 weeks or 10 working days, and preferably over at least 4 weeks or 20 working days. • Include control materials as part of your daily work for a long enough period to observe the variation expected in your laboratory. • Longer period is better because the estimates will include more operators and more method changes, such as pre and post maintenance performance, changes in reagent lot numbers, sample probes or pipettes, etc. , thus even one month might be too short a period. • In practice, calculations of the mean and standard deviation are often made monthly and then the monthly data are added to data from previous months to calculate the cumulative or lot-to-date mean and standard deviation that are then used for setting control limits. These cumulative or lot-to-date control limits are a better representation of long term test performance.

How many significant figures are needed in the control results that are used to estimate the mean and standard deviation? • Control results should have at least one more significant figure than the values reported for patient test results in order to get good estimates of the mean and standard deviation and to be able to set appropriate control limits. • With some instrument systems where test results are rounded for clinical significance, only whole numbers end up being reported for control results, thereby giving a discrete distribution of control values with only a few possible results, rather than the continuous gaussian distribution that is expected.
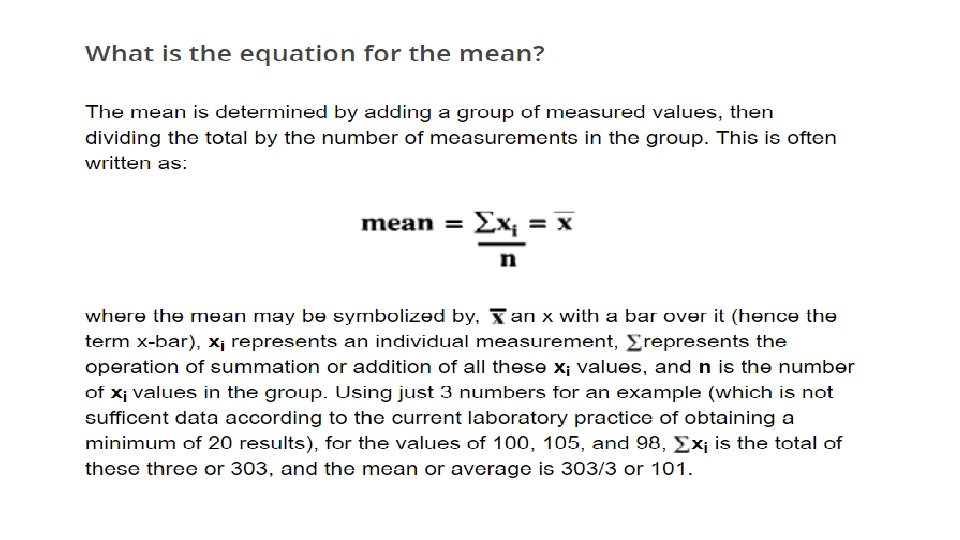

Mean or average • Simplest statistic is the mean or average. • For example, given the following ten analyses of a control material - 90, 91, 89, 84, 88, 93, 80, 90, 85, 87 - the mean or Xbar is 877/10 or 87. 7. • Xbar refers to a symbol having a line or bar over the X, mean • The mean value characterizes the "central tendency" or "location" of the data. • When assaying control materials, it is obvious that technologists will not achieve the mean value each and every time a control is analyzed. The values observed will show a dispersion or distribution about the mean, and this distribution needs to be characterized to set a range of acceptable control values.

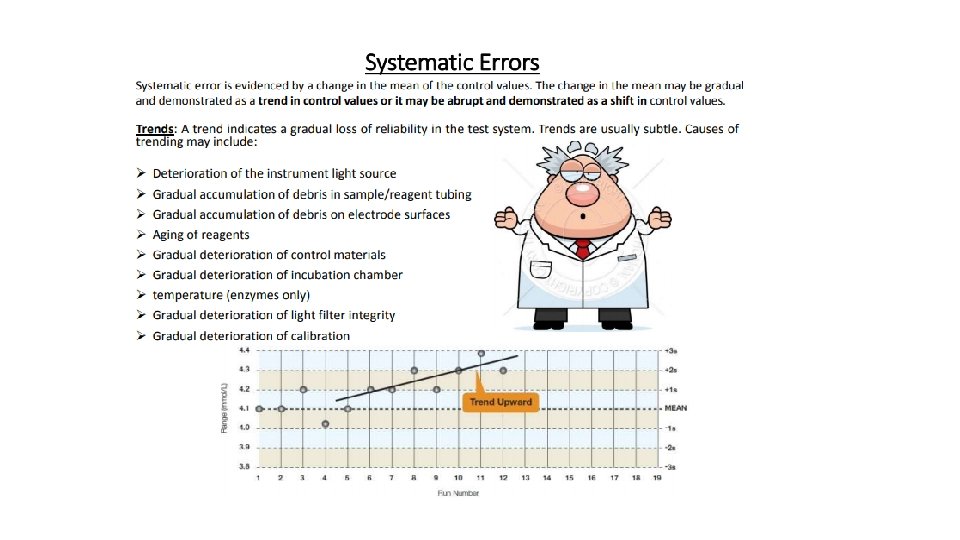
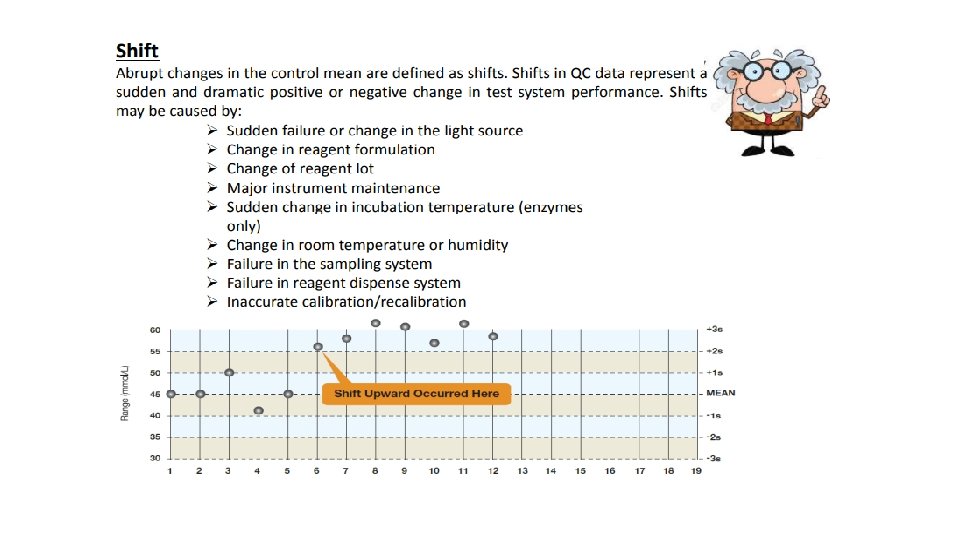
What does the mean tell me about method performance? The mean value for a control material provides an estimate of the central tendency of the distribution that is expected if method performance remains stable. Any change in accuracy, such as a systematic shift or drift, would be reflected in a change in the mean value of the control, which would be shown by a shift or drift of the distribution of control results. Always keep in mind that the mean is related to accuracy or systematic error and the standard deviation is related to precision or random error.

Standard deviation

Standard deviation • The dispersion of values about the mean
 the individual")
Standard deviation • The first mathematical manipulation is to sum (summation symbol) the individual points and calculate the mean or average, which is 877 divided by 10, or 87. 7 in this example. • The second manipulation is to subtract the mean value from each control value, as shown in column B. This term, shown as X value - Xbar, is called the difference score. As can be seen here, individual difference scores can be positive or negative and the sum of the difference scores is always zero. • The third manipulation is to square the difference score to make all the terms positive, as shown in Column C. • Next the squared difference scores are summed. • Finally, the predictable dispersion or standard deviation (SD or s) can be calculated as follows:

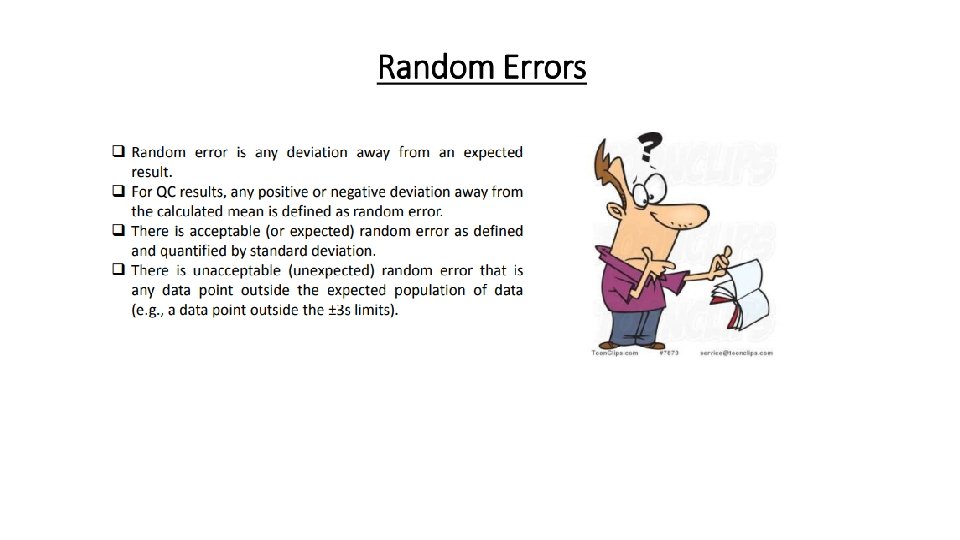
What does the standard deviation tell about method performance? • The standard deviation is related to the spread or distribution of control results about the expected mean. Whereas the mean is an indicator of central tendency and therefore related to accuracy or systematic error, the standard deviation is a measure of the width of the distribution and is related to imprecision or random error. • The bigger the standard deviation, the wider the distribution, the greater the random error, and the poorer the precision of the method; the smaller the standard deviation, the narrower and sharper the distribution, the smaller the random error, and the better the precision of the method.

Degrees of freedom • The "n-1" term in the above expression represents the degrees of freedom (df). • "degrees of freedom" indicates how much freedom or independence there is within a group of numbers. • For example, if you were to sum four numbers to get a total, you have the freedom to select any numbers you like. However, if the sum of the four numbers is stipulated to be 92, the choice of the first 3 numbers is fairly free (as long as they are low numbers), but the last choice is restricted by the condition that the sum must equal 92. For example, if the first three numbers chosen at random are 28, 18, and 36, these numbers add up to 82, which is 10 short of the goal. For the last number there is no freedom of choice. The number 10 must be selected to make the sum come out to 92. • Therefore, the degrees of freedom have been limited by 1 and only n-1 degrees of freedom remain. • In the SD formula, the degrees of freedom are n minus 1 because the mean of the data has already been calculated (which imposes one condition or restriction on the data set).
. The SD")
Variance • Variance, is the standard deviation squared (variance = SD² ). The SD may be either positive or negative in value because it is calculated as a square root, which can be either positive or negative. • By squaring the SD, the problem of signs is eliminated. • One common application of the variance is its use in the F-test to compare the variance of two methods and determine whethere is a statistically significant difference in the imprecision between the methods.
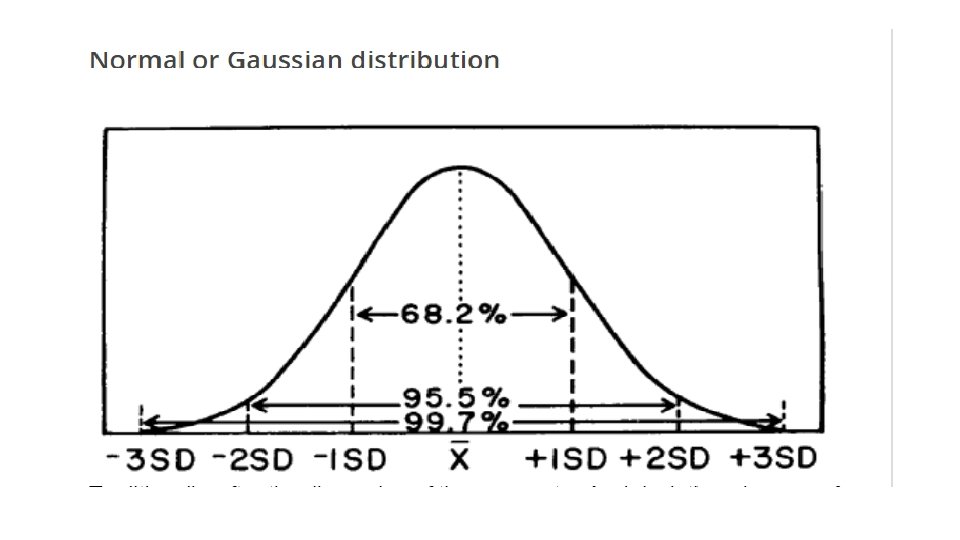

Normal or Gaussian distribution • The figure here is a representation of the frequency distribution of a large set of laboratory values obtained by measuring a single control material. • This distribution shows the shape of a normal curve. • Note that a "gate" consisting of ± 1 SD accounts for 68% of the distribution or 68% of the area under the curve, ± 2 SD accounts for 95% and ± 3 SD accounts for >99%. At ± 2 SD, 95% of the distribution is inside the "gates, " 2. 5% of the distribution is in the lower or left tail, and the same amount (2. 5%) is present in the upper tail. • Also called an error curve to illustrate that small errors from the mean occur more frequently than large ones. Other authors refer to this curve as a probability distribution.

Coefficient of variation • . The CV expresses the variation as a percentage of the mean, and is calculated as follows: CV% = (SD/Xbar)100 • CV is preferred when the SD increases in proportion to concentration. For example, the data from a replication experiment may show an SD of 4 units at a concentration of 100 units and an SD of 8 units at a concentration of 200 units. The CVs are 4. 0% at both levels and the CV is more useful than the SD for describing method performance at concentrations in between. • The CV also provides a general "feeling" about the performance of a method. CVs of 5% or less generally give us a feeling of good method performance, whereas CVs of 10% and higher sound bad. • Look carefully at the mean value before judging a CV. At very low concentrations, the CV may be high and at high concentrations the CV may be low. For example, a bilirubin test with an SD of 0. 1 mg/d. L at a mean value of 0. 5 mg/d. L has a CV of 20%, whereas an SD of 1. 0 mg/d. L at a concentration of 20 mg/d. L corresponds to a CV of 5. 0%.

Why is a CV useful? • The standard deviation of a method often changes with concentration, i. e. , the larger the concentration, the larger the standard deviation, therefore it is usually necessary to estimate the standard deviation at the concentration level of interest. • Because the CV reflects a ratio of the standard deviation to the concentration, it is often provides a better estimate of method performance over a range of concentrations. • For example, you may be interested in planning a QC procedure on the basis of the performance needed at a critical decision concentration of 200 mg/d. L, but the nearest control available has a mean of 190 mg/d. L. Therefore, it is best to calculate the CV from the observed results at 190 mg/d. L, then apply that CV to the 200 mg/d. L decision level. • This is the reason that QC planning applications with the QC Validator program use a percentage figure for the imprecision of the method.

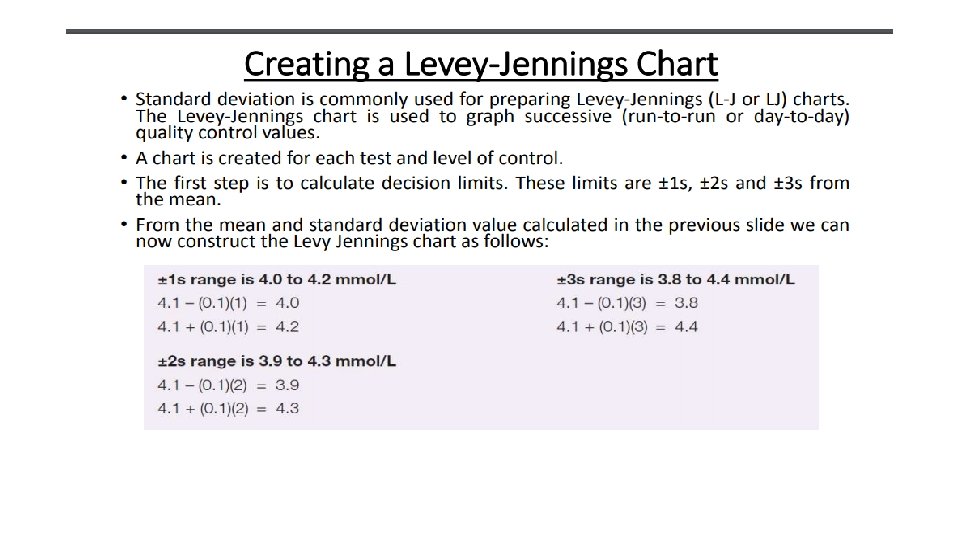
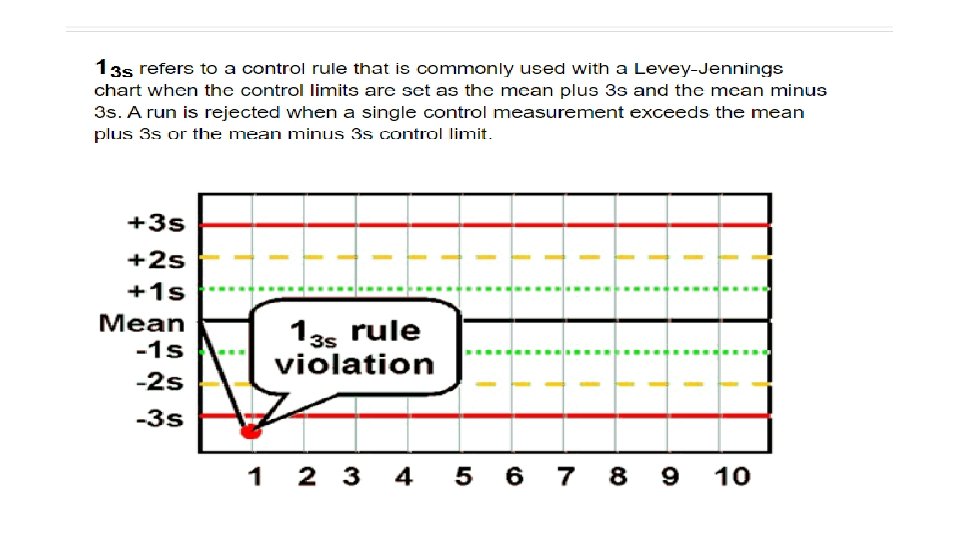
Control limits • Given the mean and standard deviation for a control material, control limits are calculated as the mean plus and minus a certain multiple of the standard deviation, such as 2 s or 3 s. • For cholesterol where a control material has a mean of 200 mg/d. L and a standard deviation of 4 mg/d. L, the 2 s control limits would be 192 and 208 mg/d. L, and the 3 s control limits would be 188 and 212 mg/d. L.

How many significant figures should be used in control limit calculations? • As a rule of thumb, the control results and the calculated standard deviation should have at least one more significant figure than needed for clinical significance of the patient test result • The mean of a control material should include at least two more significant figures than needed for clinical significance of the patient test result.

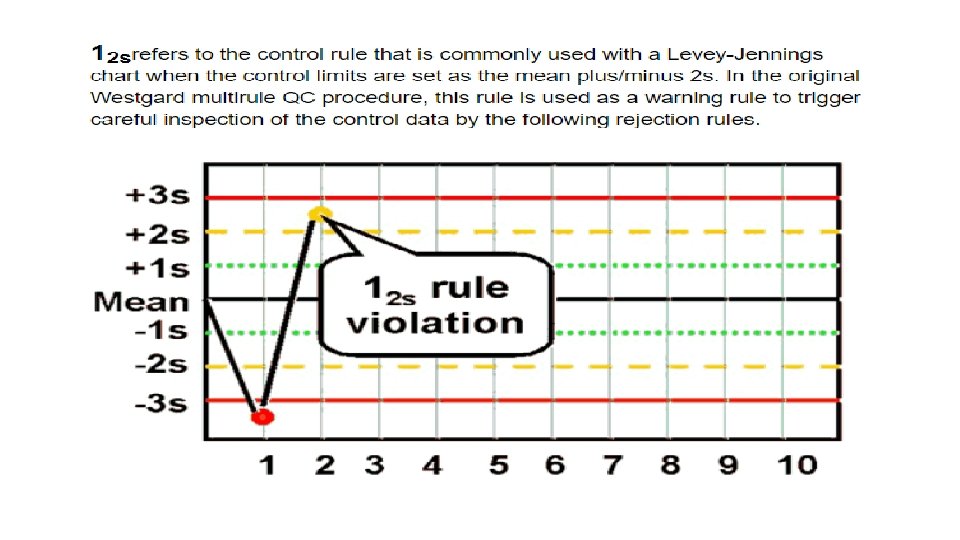
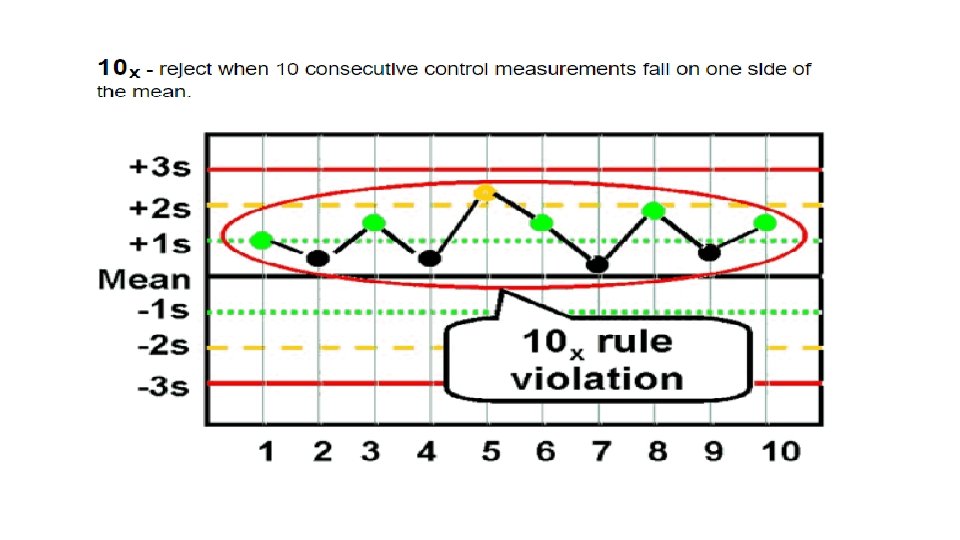
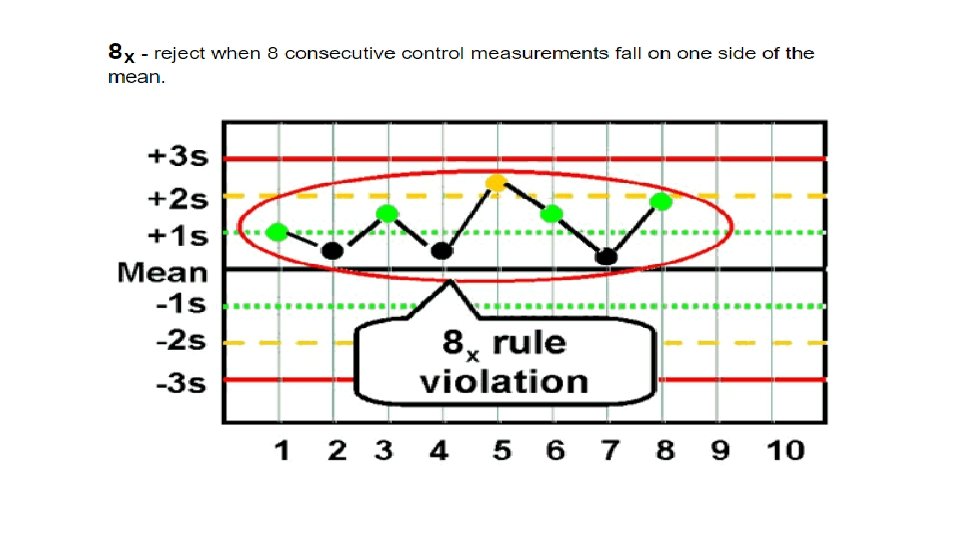
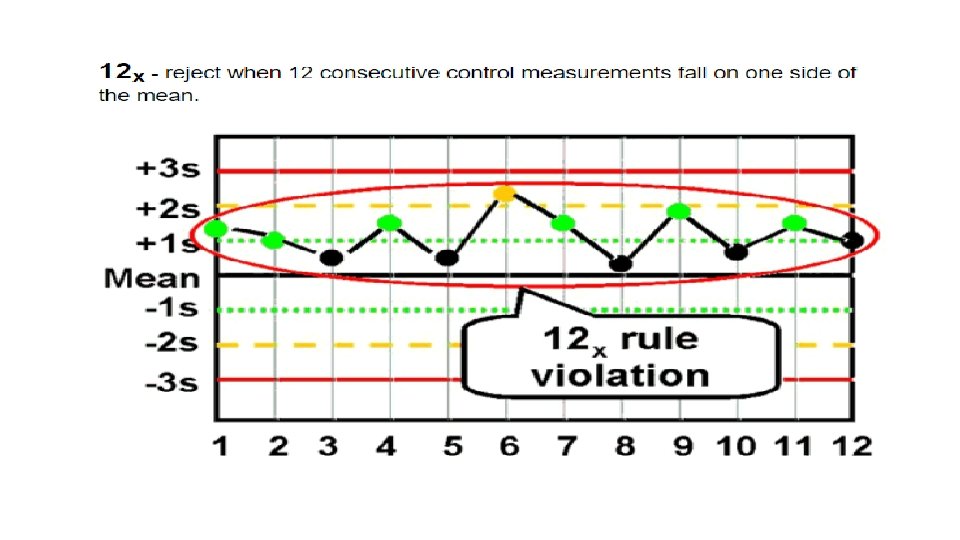
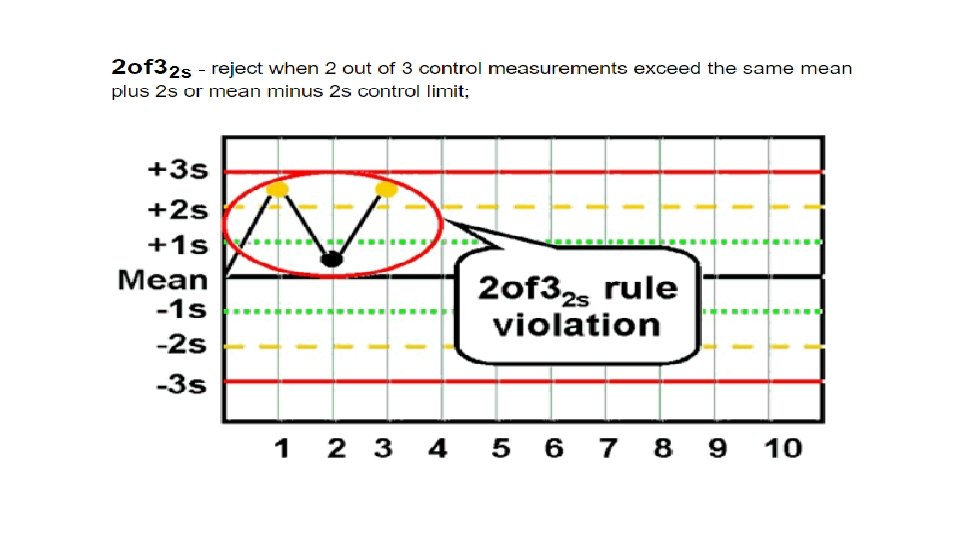
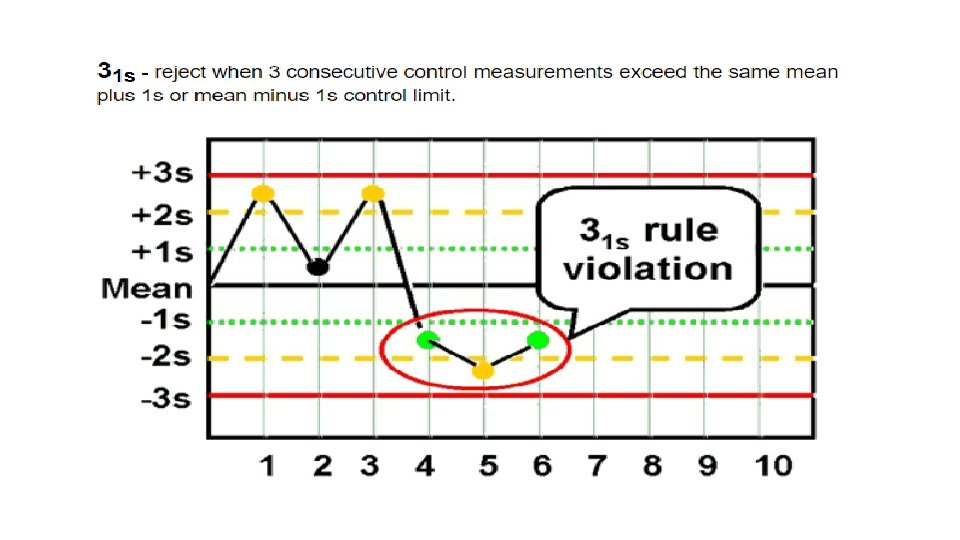
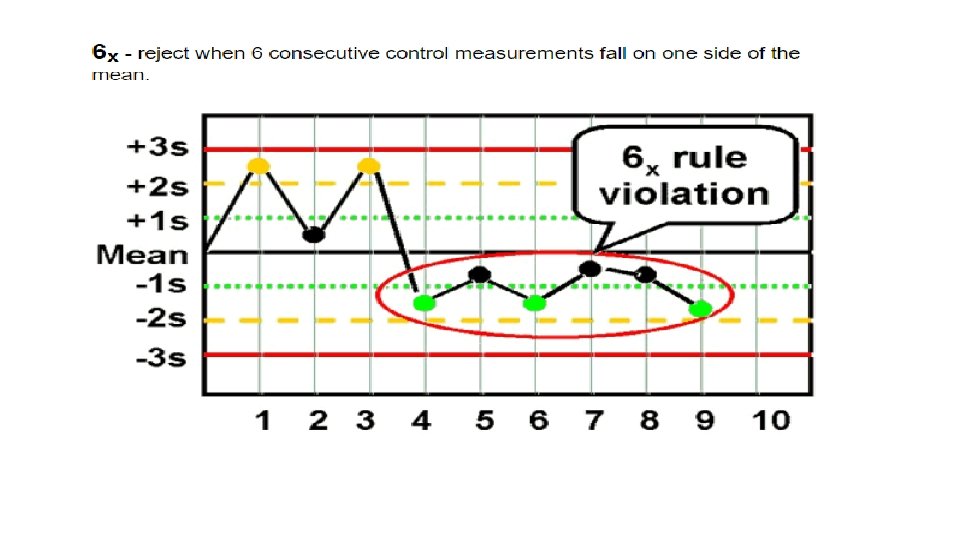
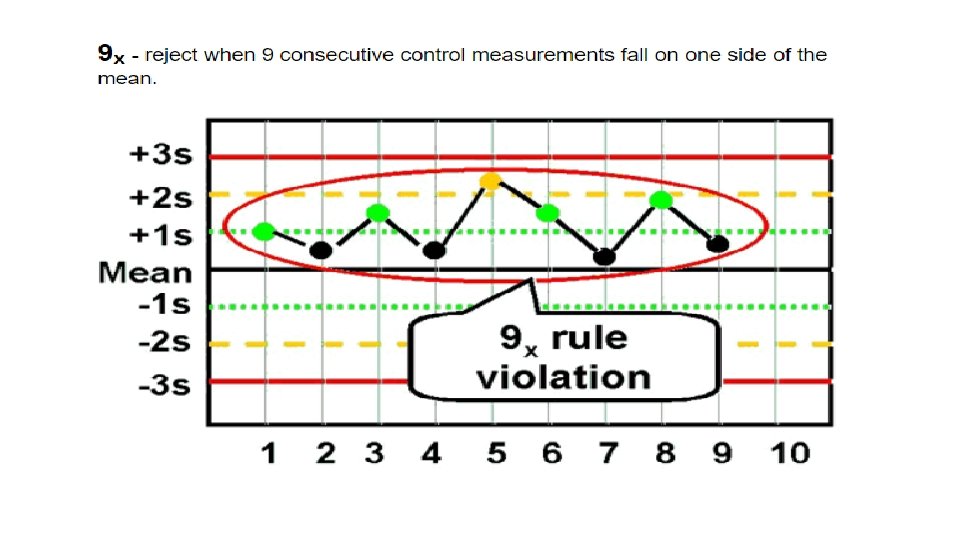
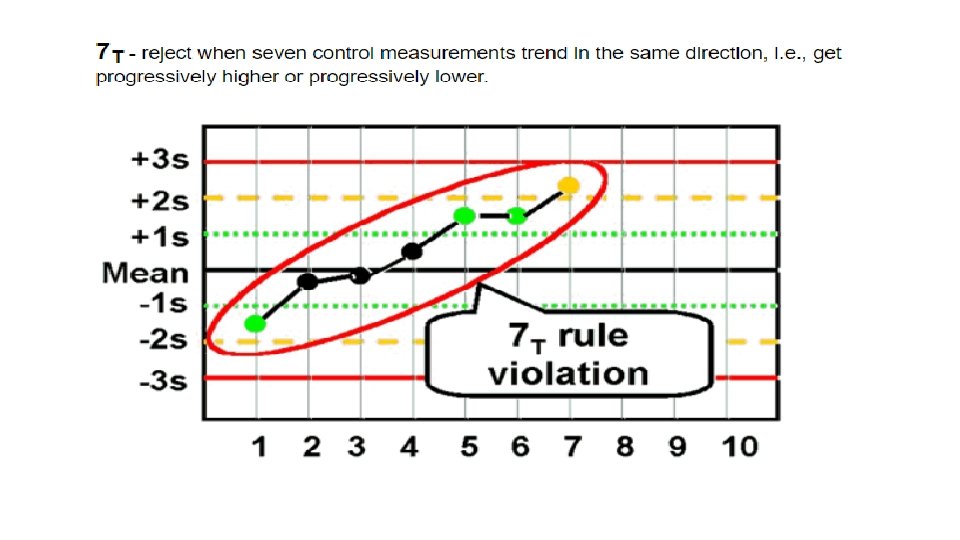
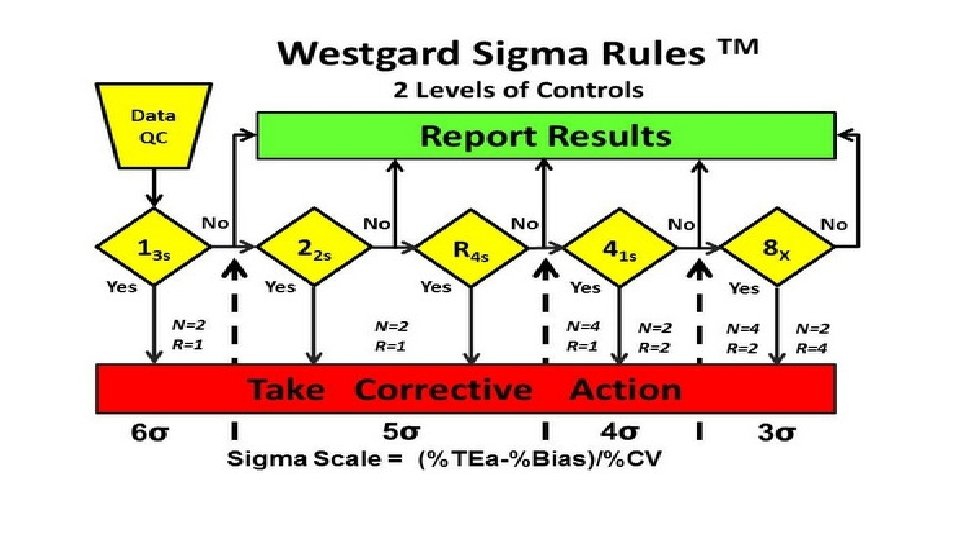
What are the "Westgard rules"? The Westgard Rules are a set of rules used for laboratory quality control. They are a copyrighted set of modified Western Electric rules, developed by James Westgard and provided in his books and seminars on quality control

Follow-up action • Accept the test run in its completeness - this usually applies when only a warning rule is violated. • Reject the whole test run - this applies only when a Rejection rule is violated

When a rule is violated • Warning Rule – Use other rules to inspect the control points. • Rejection Rule – Out of Control • • • Stop Testing • Identify & Correct Problem • Repeat Test on patient samples & controls • Don't report results until problem solved and controls indicate proper performance

RESOLVING QC PROBLEMS • Take action in a sequential manner to identify a problem – not in a random manner • • Analyse QC material • • Check if problem is resolved – If QC problem still persists take next step • • Record the problem, action taken • • Technologists encouraged to perform corrective action steps by themselves

STEPS IN RESOLVING QC PROBLEMS • 1. Check whether QC is out of control for many analytes using same wavelength • • 2. Check whether the QC is out- of- control for both levels or any one level for same analyte • • 3. Check whether reagent has reached its onboard stability period / nearing it • • 4. Check whether QC material has reached its open vial stability period / nearing it • • 5. Check whether latest calibration was OK

STEPS IN RESOLVING QC PROBLEMS 1. Repeat Assay on control specimen using fresh aliquot of QC pool 2. Repeat assays on control specimen using a newly reconstituted set of control 3. Look for obvious problems – clots, blocks in probes, carryover reagent levels, mechanical fault 4. Recalibrate instrument for the analyte in question reassay all controls 5. Install a new lot of reagent bottle ( one or all), recalibrate & reassay all controls 6. Perform machine maintenance , recalibrate & reassay all controls

. THANK YOU
- Slides: 47