BASIC PRINCIPLES OF REMOTE SENSING LAND O R

BASIC PRINCIPLES OF REMOTE SENSING LAND O R OL O GY E M TE ATMOSPHERE OCEAN

WHY MAKE MEASUREMENT FROM SPACE? 750 600 SYNOPTIC COVERAGE 4 3 450 Latitude 800 km REPEAT OBSERVATIONS 300 150 2 1 14 13 12 11 10 9 8 7 150 300 Orbit Number 5 450 10 km 6 00 600 750 2820 km 100 m Swath = 70 km 10 m 1. 6 m 4. 5 km 11. 3 km 35. 7 km 357 km 1956 km
 meteorological observations are the")
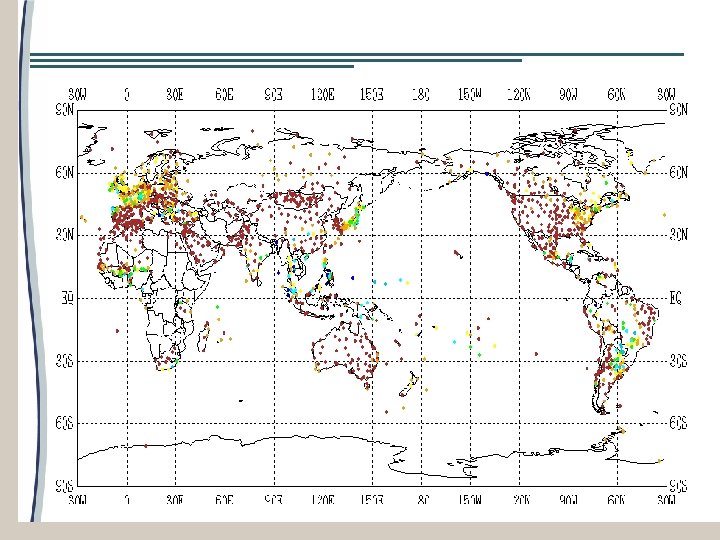
Need for a Meteorological Satellite Observation System Surface-based (in situ) meteorological observations are the most reliable But they are confined to land In situ observations are scanty over oceans which occupy two-thirds of the earth’s surface It is difficult to set up observatories in inhospitable regions Automatic weather stations cannot observe all parameters

Need for a Meteorological Satellite Observation System Meteorological parameters inferred indirectly Satellites can provide extensive coverage Satellites can provide continuous monitoring Problem is that a single satellite cannot perform both tasks simultaneously Satellites are expensive

History of Remote Sensing The history of remote sensing began with the invention of photography. The term "photography" is derived from two Greek words meaning "light" (phos) and "writing" (graphien).

First photograph in the world by Niepce French inventor, most noted as the inventor of photography

History of Remote Sensing 1858 - Gasper Felix Tournachon “Nadar" takes the first aerial photograph from a captive balloon from an altitude of 1, 200 feet over Paris. Boston from a captive balloon at 1, 200 feet, October 13, 1860, James Wallace Black. This is the oldest conserved aerial photograph

History of Remote Sensing 1903 - The Bavarian Pigeon Corps uses pigeons to transmit messages and take aerial photos.

History of Remote Sensing 1914 – WW I provided a boost in the use of aerial photography, but after the war, enthusiasm waned

History of Remote Sensing 1946 - First space photographs from V -2 rockets. 1954 - U-2 takes first flight.

Photograph from V-2 Rocket Typical example of an oblique photograph, looking across Arizona and Gulf of California

History of Remote Sensing • EXPLORER-7 launched in 1959 • Carried Suomi radiometer measuring solar &terrestrial radiation (ERB study)

History of Remote Sensing TIROS-1, Launched 01 Apr 1960 Carried just an ordinary TV camera. It was the Beginning of Satellite Meteorology.

Remote Sensing: Definitions Remote Sensing is the art, science and technology of obtaining reliable information about physical objects and the environment, through a process of recording, measuring and interpreting imagery and digital representations of energy patterns derived from non-contact sensor systems" (Colwell, 1997).

History of Remote Sensing "Remote sensing may be broadly defined as the collection of information about an object without being in physical contact with the object. The term remote sensing is restricted to methods that employ electromagnetic energy as the means of detecting and measuring target characteristics" (Sabins, 1978).

History of Remote Sensing "Remote sensing is the art and science of obtaining information from a distance, i. e. obtaining information about objects or phenomena without being in physical contact with them. (Aronoff, 1995). The science of remote sensing provides the instruments and theory to understand how objects and phenomena can be detected. The art of remote sensing is in the development and use analysis techniques to generate useful information"

Basic Principles of EM Wave Propagation Black body radiation at different temperatures ( 300, 950, and 2500 Kelvin).

Electromagnetic Waves

Period, Amplitude and Wavelength

Electromagnetic Spectrum 0. 4 0. 5 0. 6 0. 7

Infinite Possibilities The electromagnetic spectrum stretches across x-rays to radio waves Theoretically speaking, it can be broken into an infinite number of parts

Infinite Possibilities Depending on which spectral region is scanned we will get different information

Infinite Possibilities Depending upon where we place a satellite, we will get different information

What Happens When EMR Strikes Matter? Transmission Reflection Absorption

Transmission It is a process by which incident radiation passes through matter w/o measurable attenuation Medium 1 Medium 2 1 1> 2 2 1= 3 Medium 1 3

Reflection and Scattering Reflection process whereby incident radiation "bounces off" the surface of substance in a single, predictable direction; caused by surfaces smooth relative to wavelengths of incident radiation; no change in velocity or wavelength 1 2 Medium 1 Medium 2 Reflection 1= 2
 occurs when incident radiation is dispersed or spread out")
Reflection and Scattering (Diffused reflection) occurs when incident radiation is dispersed or spread out unpredictably in many different directions; occurs when surfaces rough relative to wavelengths of incident radiation; no change in velocity or wavelength Medium 1 Medium 2 Scattering

Absorption It is a process by which incident radiation is taken in by the medium (e. g. , surface, atmospheric particulates, atmospheric layer); medium opaque to incident radiation It is the tendency for materials to simply soak up electromagnetic energy and convert it to heat. Some of this energy can be measured as radiated (emitted) heat that is at a longer wavelength than the original energy. Emission Absorption Emission

EMR - Atmosphere Interactions EMR travels through space w/o modification Diversion and depletion occurs as solar and terrestrial radiation interact with earth's atmosphere Interference is wavelength selective meaning at certain wavelengths EMR passes freely through atmosphere, whereas restricted at other wavelengths
 - areas of EMS where specific")
Windows and Absorption Bands Atmospheric Windows (transmision bands) - areas of EMS where specific wavelengths pass relatively unimpeded through atmosphere Absorption Bands - areas where specific wavelengths are totally or partially blocked

Windows and Absorption Bands

Important Atmospheric Windows 0. 3 - 1. 3 um UV, visible, near infrared 1. 5 - 1. 8 um SWIR 2. 0 - 2. 4 um Mid infrared 3. 0 - 5. 0 um Mid infrared 8. 0 - 14. 0 um Thermal Infrared > 0. 6 cm Microwave

IMAGING AND SOUNDING Objective to study earth's surface different remote sensing instruments designed to operate in windows where cloudless atmosphere will transmit sufficient radiation for detection Objective to study atmosphere constituents - operate in atmospheric absorption bands
 ( VHRR, SSMI, SCATTEROMETERS, MADRAS) •")
SATELLITE OBSERVATIONAL SYSTEM FOR METEOROLOGY SURFACE SENSING (IMAGING) ( VHRR, SSMI, SCATTEROMETERS, MADRAS) • • LAND COVER SEA SURFACE TEMPERATURE • • CLOUD MOTION VECTOR OCEAN SURFACE WIND VECTOR • SNOW COVER • CLOUD STRUCTURE • CYCLONE MOVEMENT SOUNDERS (TOVS, TRMM-RADAR, SAPHIR) ØT, P, RH PROFILE ØMINOR CONSTITUENTS ØPRECIPITATION PROFILE

Atmospheric Absorption and Transmission Most significant absorbers of EMR: Ozone Carbon dioxide Water vapor Oxygen Nitrogen

Spectral Signatures A primary use of remote sensing data is in classifying the myriad features in a scene into meaningful categories The image then becomes a thematic map (the theme is selectable e. g. , land use, geology, vegetation types, rainfall). A farmer may use to monitor the health of his crops without going out to the field A geologist may use the images to study the types of minerals or rock structure A biologist may want to study the variety of plants in a certain location.

Spectral Signatures At certain wavelengths, sand reflects more energy than green vegetation while at other wavelengths it absorbs more (reflects less) energy. Therefore, in principle, various kinds of surface materials can be distinguished from each other by these differences in reflectance. When more than two wavelengths are used, the resulting images tend to show more separation among the objects. The improved ability of multispectral sensors provides a basic remote sensing data resource for quantitative thematic information, such as the type of land cover. These data provide unique identification characteristics leading to a quantitative assessment of the Earth's features.

Spectral Signatures

PRINCIPLE OF LAND COVER DISCRIMINATION FRESH SNOW GREEN VEGETATION DARK TONED SOIL LIGHT TONED SOIL CLEAR WATER TURBID WATER

SNOW Snow reflectance depends on: Wavelength Snow pack thickness Liquid water content Reflectance relative to Ba. SO 4 Grain size (hence age) Snow condition cold, sifted, `sugar’ consistency. Snow density 0. 357 g/cm 3 Contaminant present Wavelength in micrometer Solar zenith angle TYPICAL SPECTRAL REFLECTANCE CURVE OF SNOW.
 (b) IRS LISS-3 image over part of Himalayas. (a) is in band-2")
SNOW (a) (b) IRS LISS-3 image over part of Himalayas. (a) is in band-2 (Green) and (b) in band-5 (SWIR).

DIFF STAGES OF REMOTE SENSING SYSTEM

Questions if any ?
- Slides: 45